

Intro
This tutorial will walk you through building the “SugarForce” app. Before beginning make sure you’ve completed the Quick Start, which includes setup and installation and the prerequisites for building on the Domo App Platform.
What we’re building
We will go through how to create an app, get data to power it, visualize that data, use app development tools in the Domo platform, and publish an app. This example will help you understand the core elements of building apps in Domo that you can then take and apply to your own custom apps. You can check out complete code examples of the SugarForce app here.Step 1: Create the App
Create a New App
Run the following commands from your command line to set up a new Domo App project.sugarforce.
When asked to connect a dataset, select yes (y) and then paste the dataset ID from the previous step. Use “leads” for the dataset alias.
Finally, open the project directory in your favorite editor. You should now have a project with the following structure.
Deploy for Testing
In order to test your app with the sample dataset you just created, you’ll need to publish your app to your Domo instance. Publishing does not make your app public, it simply sets up the connections between your app, your Domo instance, and your data. Publish your app by running the followingStep 2: Connect to and Query Data in Domo
Connect Data in Domo
We’ll be using some sample data provided by Domo’s Sample Data Connector. To make the sample data available to your app, you need to create the dataset in Domo using the Sample Data Connector. Click here to create that dataset. You’ll select “SugarForce” as the datasource and “Leads” as the report. Select the default refresh schedule and give it a name. Once your dataset is created, copy and save the dataset ID displayed in the URL as we’ll need this for the next section.
Get Data
To use data from Domo in your app, simply call the Domo Data API via thedomo resource provided.
Open leads.js and look at the data query
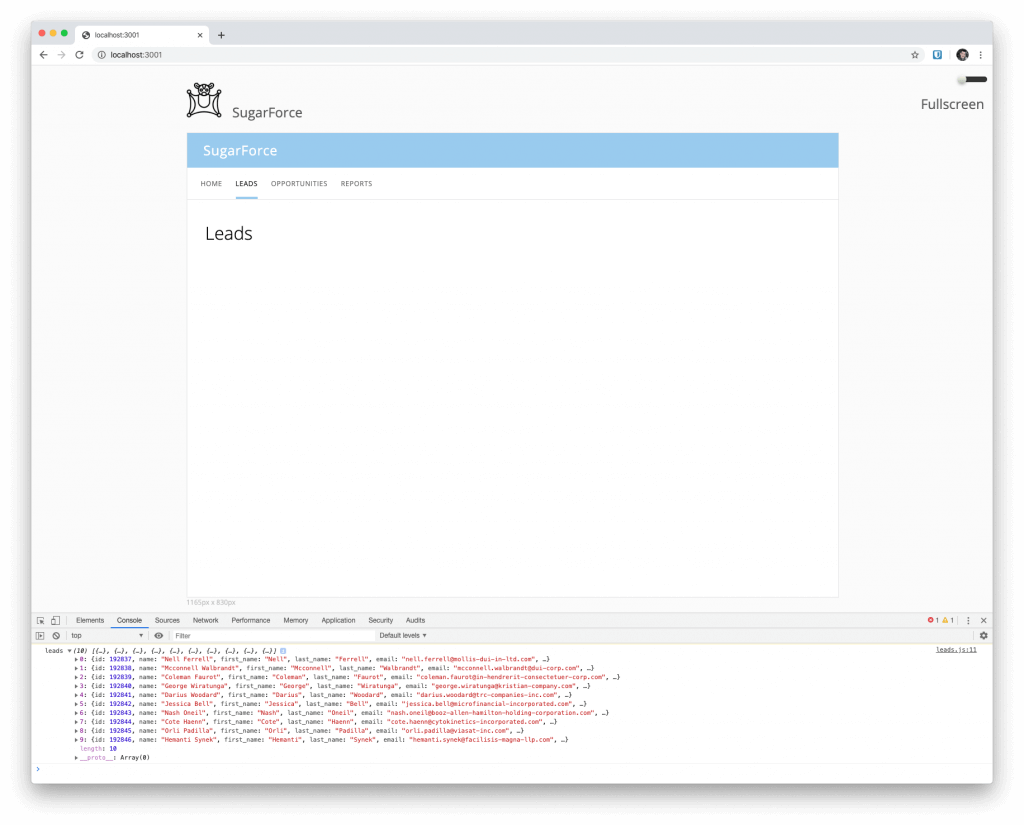
leads in manifest.json and returning the last 10 rows. Click the “Leads” tab. You’ll see the response output to console.log which is viewable by opening your developer console in your browser. If you’re not familiar with the developer tools, this is where you can see console logs, errors in your code, and other useful things like network responses, etc. More information about Chrome developer tools can be found here and Firefox developer tools can be found here.
Select Fields
Modify the data query by adding afields parameter to the URL
Draw a Table
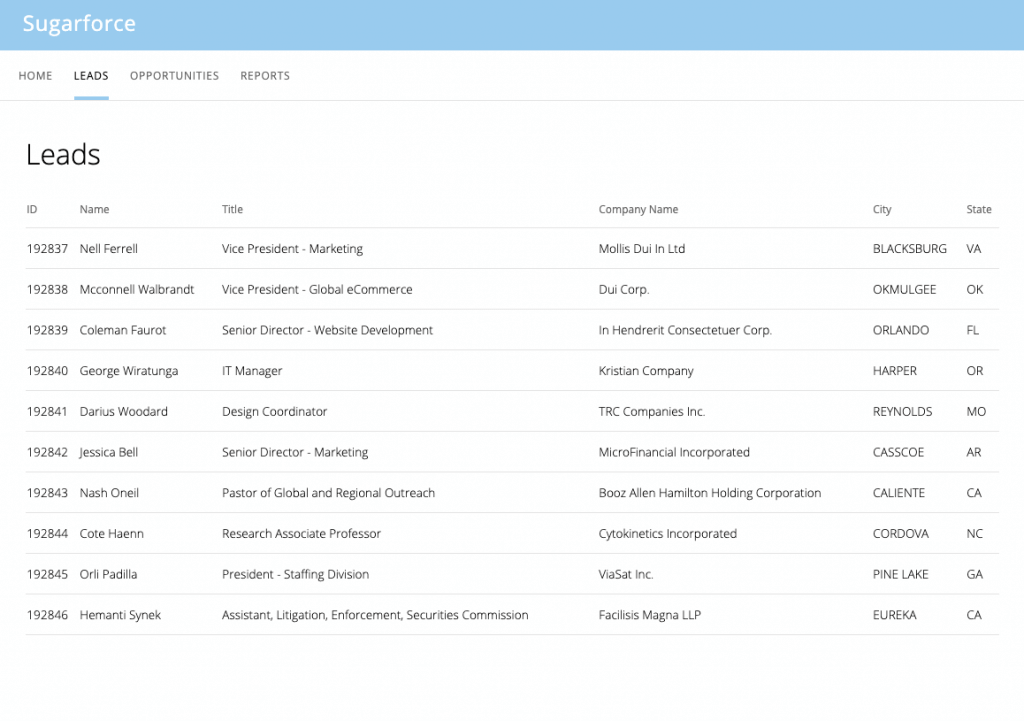
Now that we have the data response the way we’d like from Domo, output the data to a table. For our example, you can just pass the response todrawTable and it does the work for you.
drawTable expects a data object (the response from the data query) and the ID of a table target to output to. Create the table target by appending the following to leads.html
leads.js
Additional resources
For more examples on how to create complex queries of your data refer to the Data Queries samples guide.Step 3: Visualize Data
To visualize data, you can use Domo’s charting library called Phoenix. Phoenix allows you to leverage all of Domo’s native chart types and add custom styles. If needed, you can check out Phoenix’s full documentation here.
Create a Map
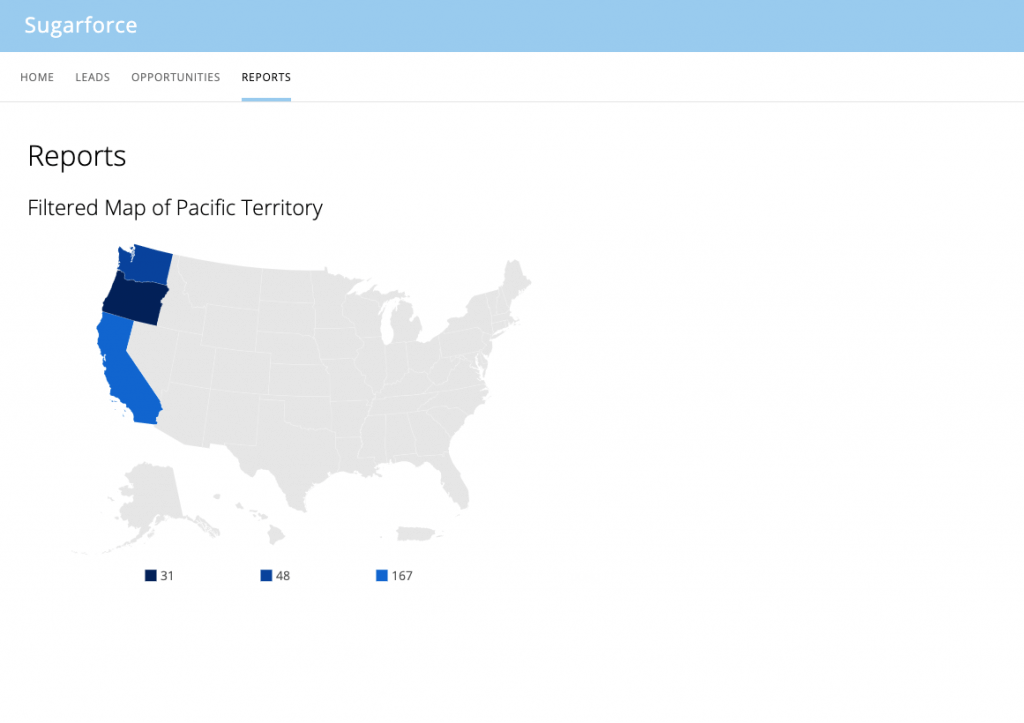
The “Reports” page of SugarForce is where we’ll add visualizations of our “Leads” data. This example helps you create a single visualization but you can always add more. Openreports.js and add the following
reports.html. Append the following
groupby to aggregate the data. By default, values that are not part of the grouping are counted. That is, company_name is a count of all company_namevalues grouped by state. Finally we added a unique parameter to make that count distinct.
type attribute uses one of Phoenix’s pre-defined data types. name is the identifier of the charted dimension. mapping is specific to the chart type used, and more details can be found in the official Phoenix documentation.
columns, and rows. columns is an array of columns as defined in the previous example. rows is an array of arrays, each representing a single row. The code example is simply converting our result set to the expected format.
chart variable is assigned a new instance of the Phoenix chart which is then rendered as a child of the element specified.
Customize Colors
You can customize chart colors to align with your brand. Let’s use a different hue of blue. Inreports.js, replace
Step 4: Use AppDB for Data Storage
No need to stand up a database to store your app’s business logic. AppDB is a nosql database for storing arbitrary JSON documents and creating Domo DataSets from your application.
Define a Collection
If you’re coming from a SQL background, think of collections like tables and documents like rows. We’ll be creating a new collection and then creating documents in that collection. We’ll need to let users create Opportunities that we can associate with the Leads that we’re getting from our Domo dataset. We’ll start by deciding what attributes an Opportunity object will contain. For our example, we’ll create a very simple Opportunity object which will have an association to a lead, an amount, notes, and an attachment for uploading a sales order.manifest.json. Add the following
manifest.json will look something like the following
Set Up Your Proxy
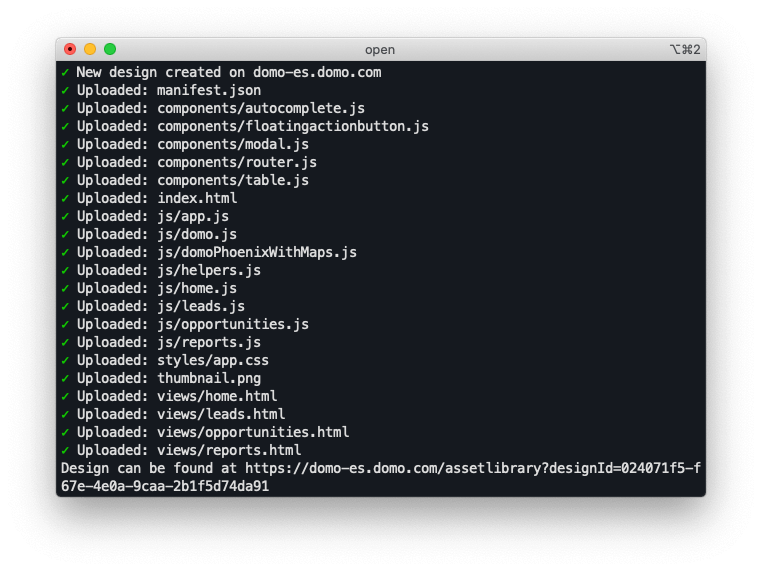
You’ll be making advanced requests to use AppDB, so in order to make these requests in your development environment, you’ll need to publish your app in your Domo instance and use the published version as a proxy. Publish your current work by closing your dev server and publishing your app. (Use CTRL+C to stop your dev server). Usedomo publish, which returns a URL which is where you can view your design in Domo.
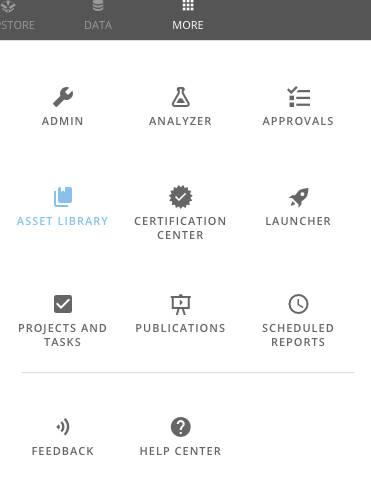
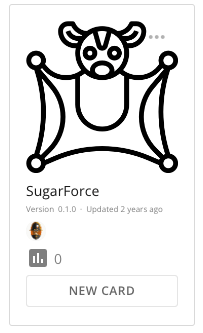
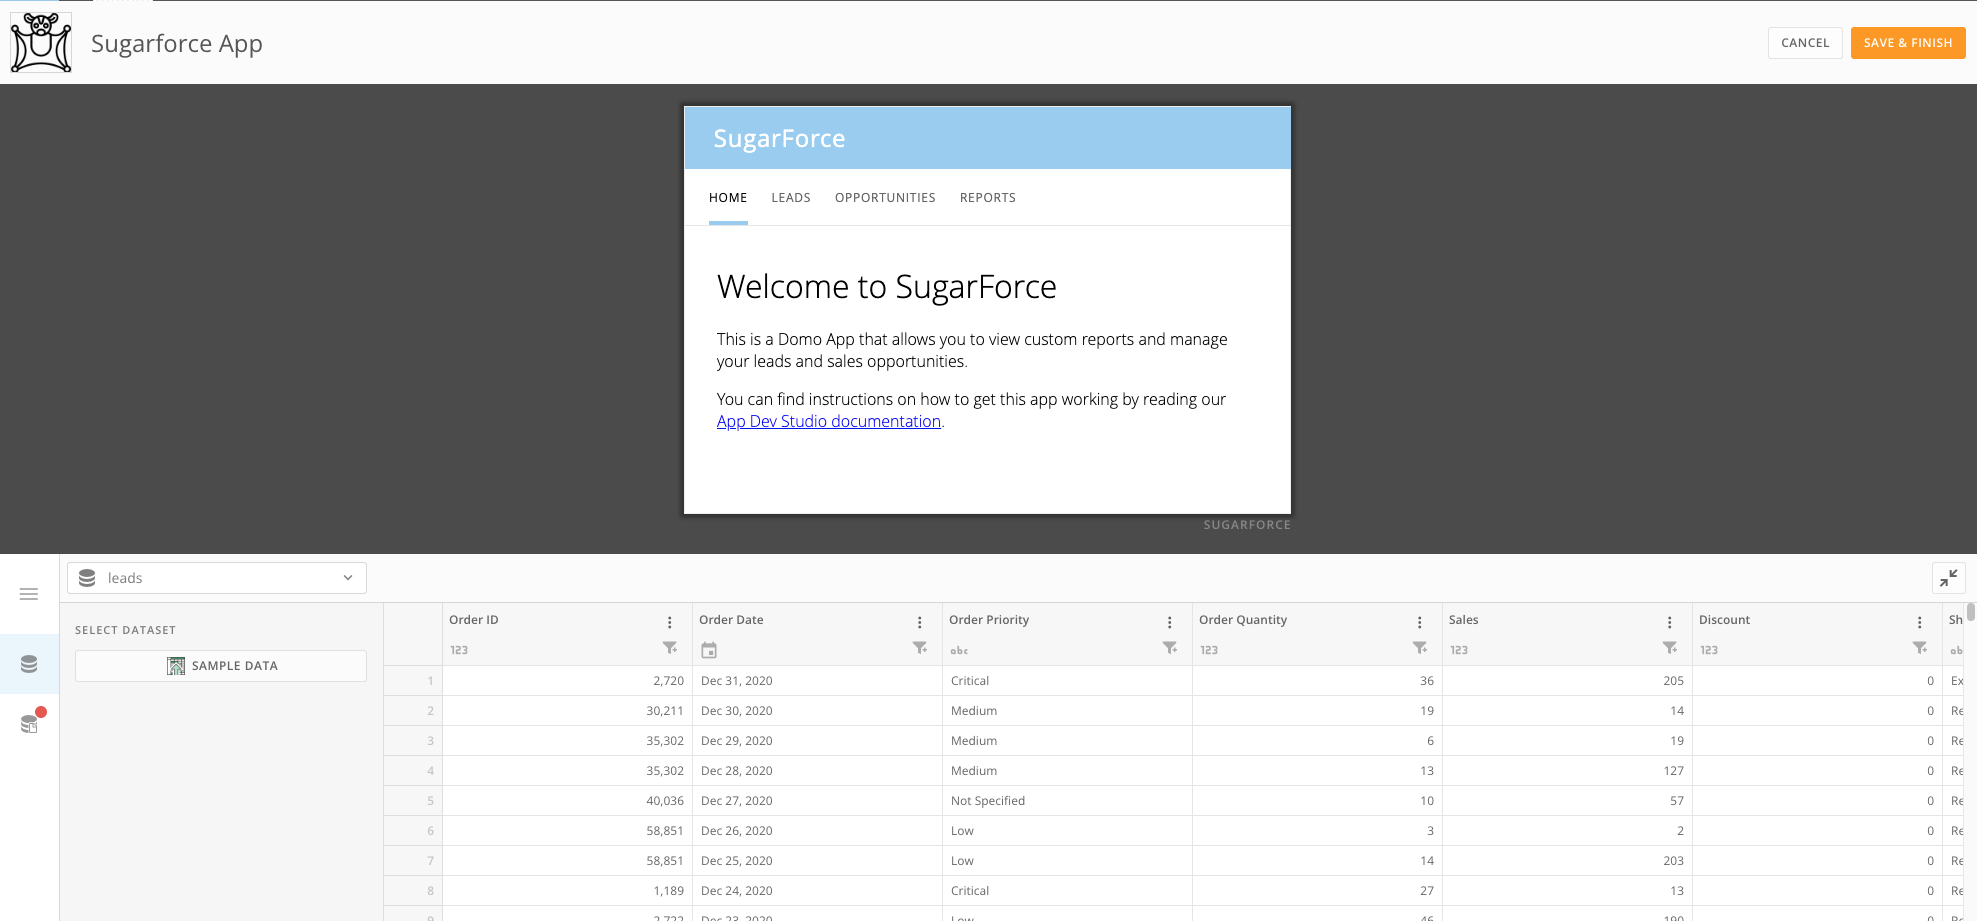
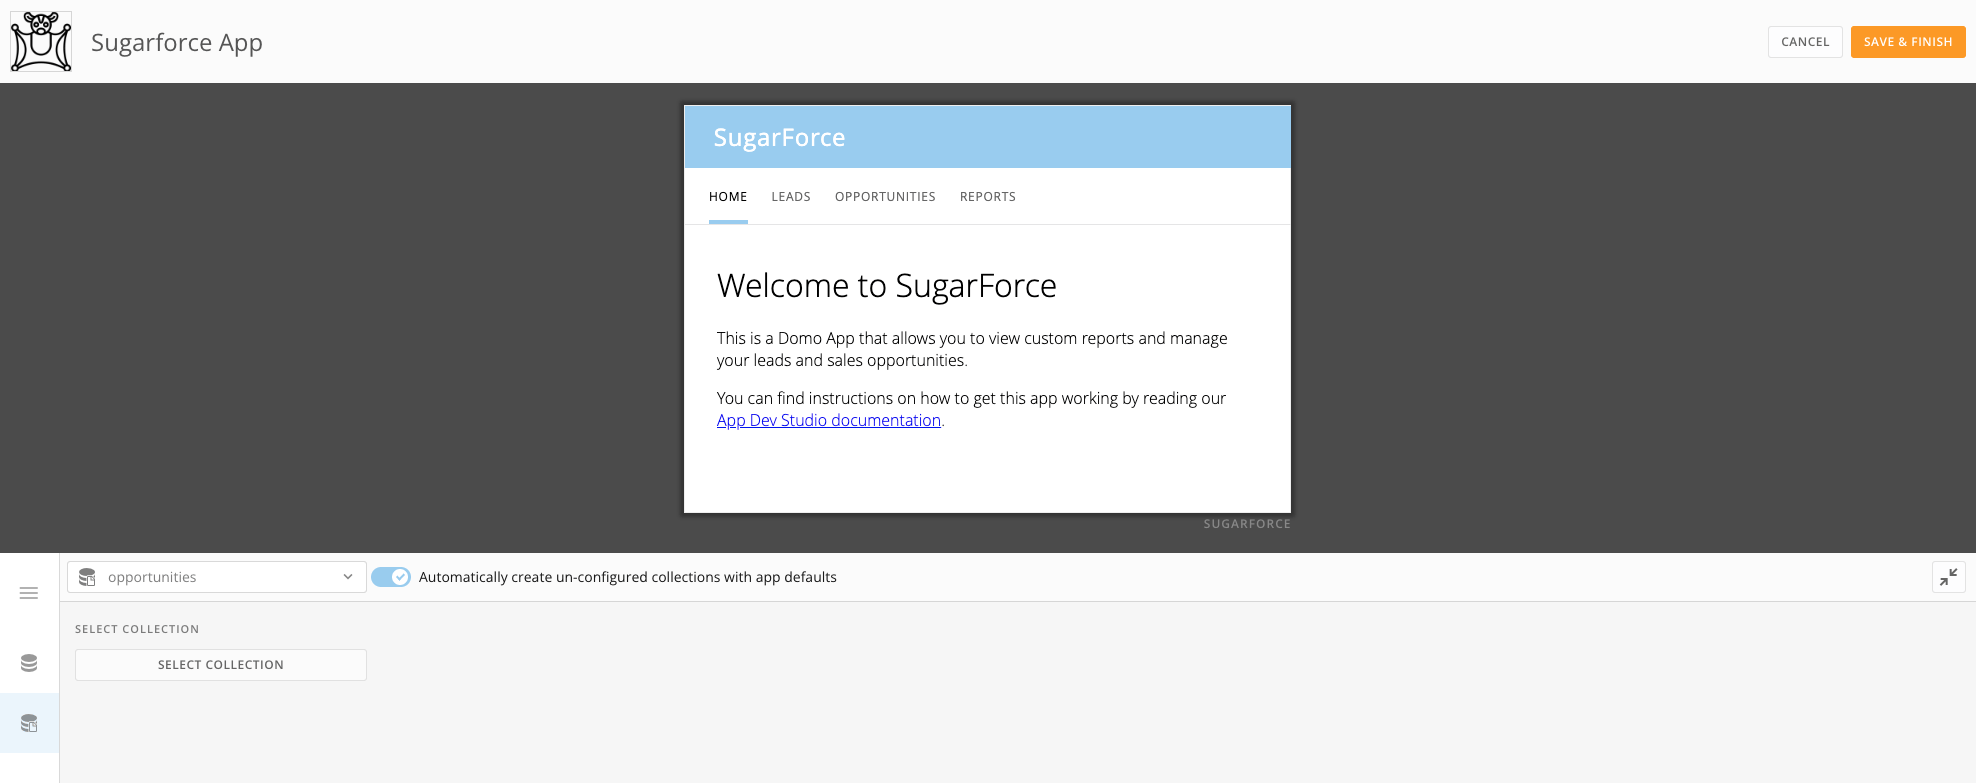
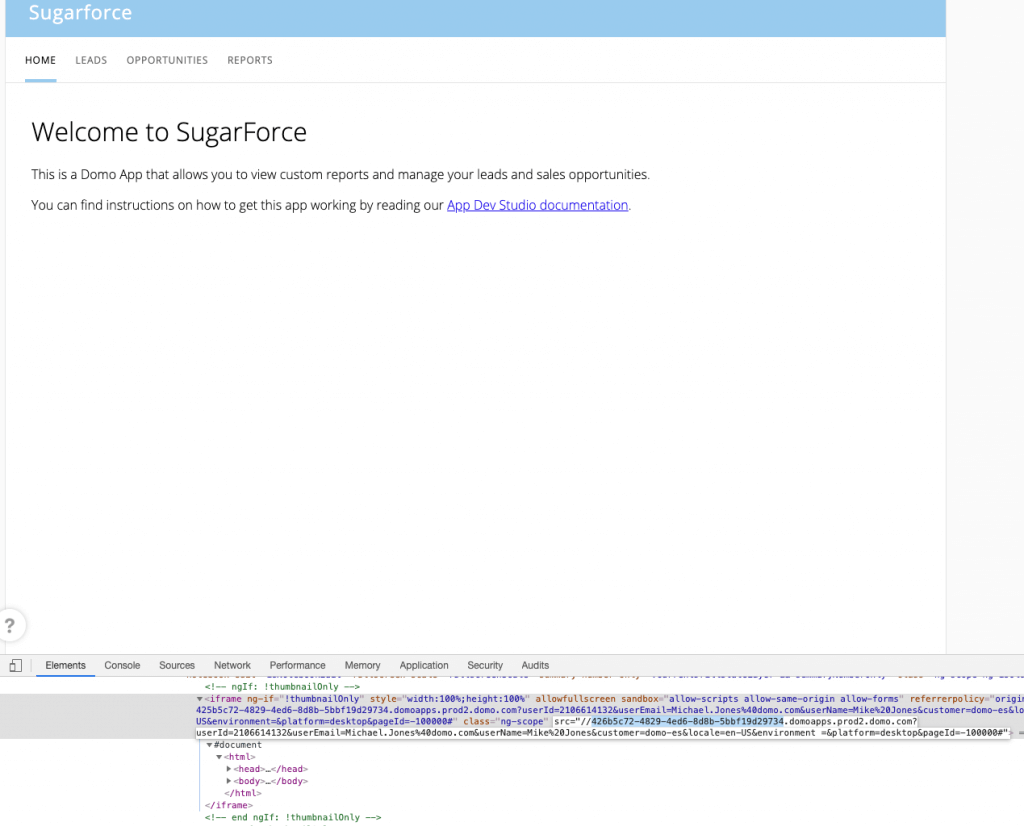
- Right-click anywhere in the card and choose “View Frame source”
- When the frame source opens in a new tab, the URL should be of the form…//{HASH}.domoapps.prodX.domo.com?userId=…
- Copy the ID found between // and.domoapps. That is your app’s ID.
manifest.json
Create a Document
Now we’re ready to create a new document. Openopportunities.js and add the following
getOpportunities callback is a function that first transforms the data returned from AppDB into rows we can use to populate our table, and then sets the objects to be editable and defines what function to use to edit an opportunity. Finally it renders the table to a table element with the ID opportunities-table. Let’s add that to opportunities.html now by appending the following
createOpportunity with data (a document).
To test this, let’s add the following to opportunities.js
domo dev in the command line).
Use a Form
Prepare to use a form by thinking about how to simplify user input. Try to minimize manual input. Instead of making users type the company name associated to an opportunity manually, give them a dropdown list of options from theLeads dataset already stored in Domo. Add the following to opportunities.js
opportunities.js
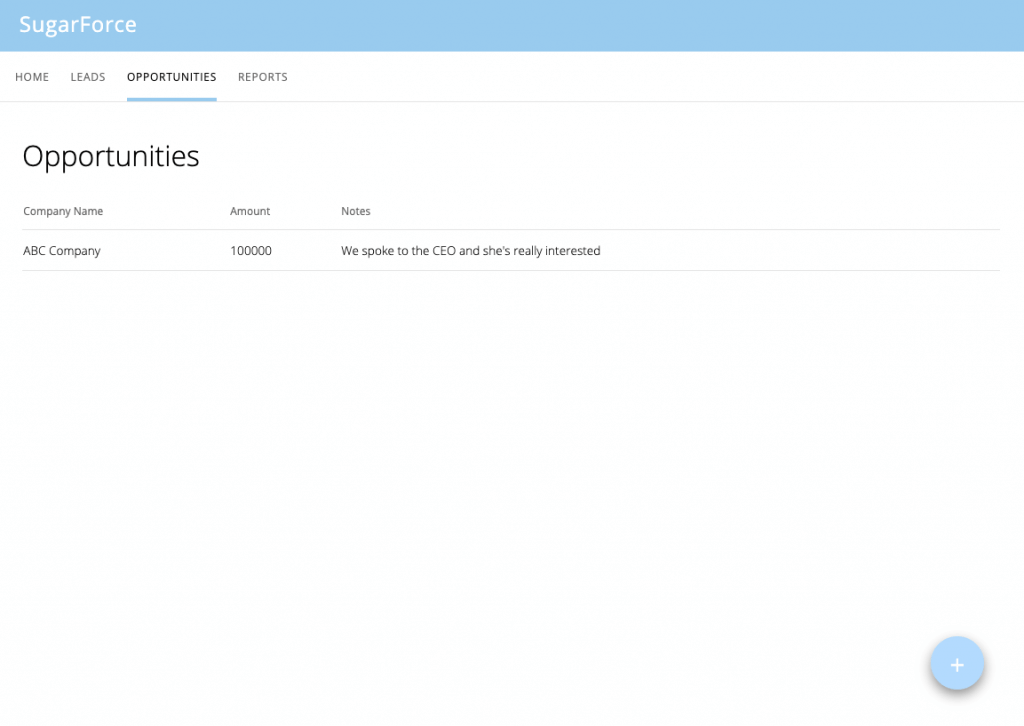
getOpportunities when the page loads.
Additional Resources
For additional information on using AppDB, refer to the AppDB API Reference Guide.Step 5: Working with Files
Leverage Files API
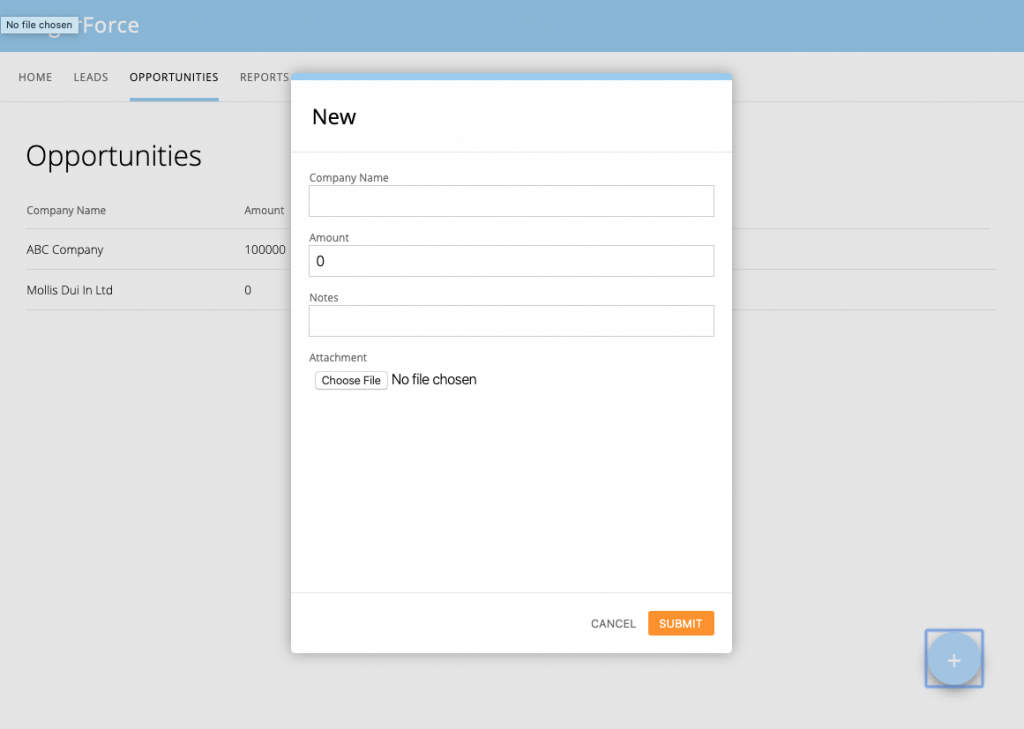
The Files API gives you the ability to handle files in a Domo app. Let users upload a file by adding the following toopportunities.js
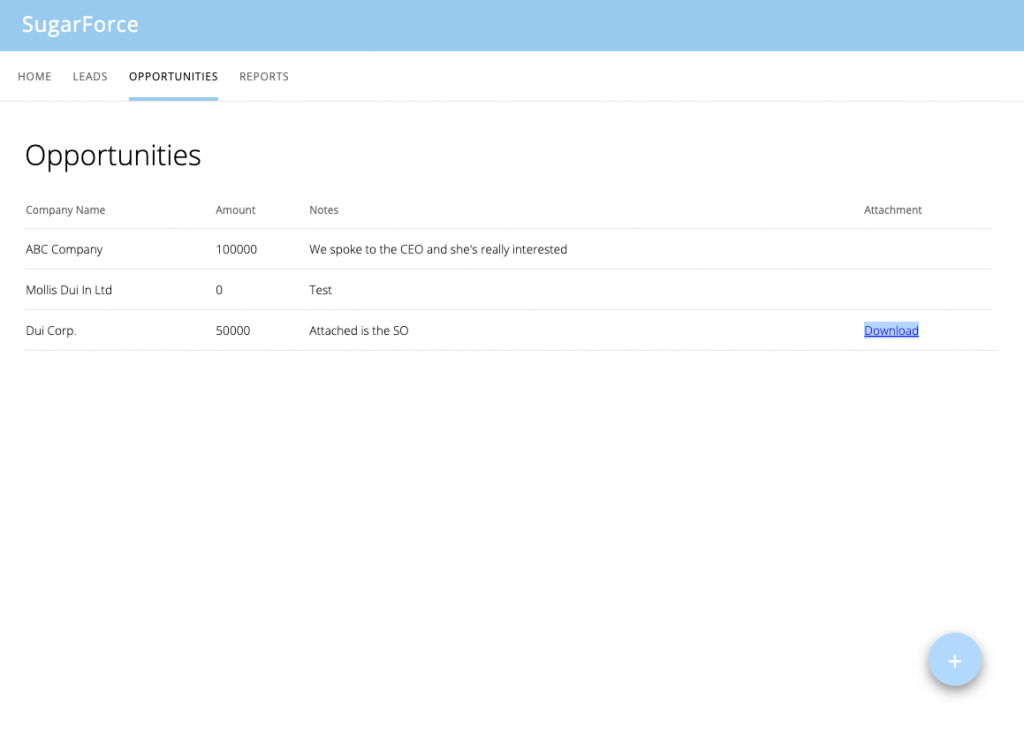
file. It will return a promise that yields a file ID which we’ll store in AppDB to access these attachments later.
Example response:
Publish and Share
We publish our final product to Domo using