> ## Documentation Index
> Fetch the complete documentation index at: https://domoinc-openapi-sync-dataflows.mintlify.site/llms.txt
> Use this file to discover all available pages before exploring further.

# Magic ETL Tiles: Dates and Numbers

export const InlineImage = ({src, alt = '', height = '1.6em'}) => {
  return <img noZoom src={src} alt={alt} style={{
    display: 'inline',
    verticalAlign: 'start',
    height: height,
    margin: '0'
  }} />;
};

## Intro

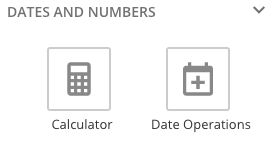
There are two available tiles in the Dates and Numbers tab of Magic ETL DataFlows. These include:

* Calculator
* Date Operations

For information about creating a Magic ETL DataFlow, see [Creating a Magic ETL DataFlow](/s/article/360055259234 "Creating a Magic ETL DataFlow").

For information about the Data Center, see [Data Center Layout](https://domo-support.domo.com/s/article/360047553253?language=en_US).

<Warning>
  **Important:** There are significant behavioral differences in the new Magic ETL. Read the Behavior Changes and Feature Updates in Magic ETL article before converting mission-critical Magic ETL DataFlows. **Failure to do so may risk an unintended change to your DataFlow’s behavior.**
</Warning>

<Warning>
  <Frame>
    <img alt="Dates_and_Number_Tab.png" src="https://mintcdn.com/domoinc-openapi-sync-dataflows/YY6W1U347GpqLSJS/images/kb/ka05w00000124Tm-00N5w00000Ri7BU-0EM5w000005vNiR.png?fit=max&auto=format&n=YY6W1U347GpqLSJS&q=85&s=2af85f13a27879bf0ee7d5aa8c6221b1" width="276" height="142" data-path="images/kb/ka05w00000124Tm-00N5w00000Ri7BU-0EM5w000005vNiR.png" />
  </Frame>
</Warning>

## Calculator Tile

<Frame>
  <img alt="Calculator.png" src="https://mintcdn.com/domoinc-openapi-sync-dataflows/YY6W1U347GpqLSJS/images/kb/ka05w00000124Tm-00N5w00000Ri7BU-0EM5w000005vNiP.png?fit=max&auto=format&n=YY6W1U347GpqLSJS&q=85&s=5b5a98cf7cc2df3eb985df7b0ccf3f88" width="84" height="95" data-path="images/kb/ka05w00000124Tm-00N5w00000Ri7BU-0EM5w000005vNiP.png" />
</Frame>

The Calculator tile lets you add a column with values from a simple calculation.

Do the following to configure the **Calculator** tile:

1. Click the **Calculator** tile in the canvas.

2. (Optional) Rename the tile by clicking
   <InlineImage src="/images/kb/ka05w00000122yV-00N5w00000Ri7BU-0EM5w000005vNgL.png" />, then entering the name you want.

3. Enter the name of the new column.

4. Select the operation you want.

   <table border="1" cellpadding="1" cellspacing="1"><thead><tr><th colspan="1" rowspan="1"><p> Operation </p></th><th colspan="1" rowspan="1"><p> Description </p></th></tr></thead><tbody><tr><td colspan="1" rowspan="1"><p> Addition </p></td><td colspan="1" rowspan="1"><p> Adds values from two columns. </p></td></tr><tr><td colspan="1" rowspan="1"><p> Subtraction </p></td><td colspan="1" rowspan="1"><p> Subtracts values from two columns. </p></td></tr><tr><td colspan="1" rowspan="1"><p> Multiplication </p></td><td colspan="1" rowspan="1"><p> Multiplies values from two columns. </p></td></tr><tr><td colspan="1" rowspan="1"><p> Division </p></td><td colspan="1" rowspan="1"><p> Divides values from two columns. </p></td></tr><tr><td colspan="1" rowspan="1"><p> Ceiling </p></td><td colspan="1" rowspan="1"><p> Returns the highest value for each series in a numeric column. </p></td></tr><tr><td colspan="1" rowspan="1"><p> Floor </p></td><td colspan="1" rowspan="1"><p> Returns the lowest value for each series in a numeric column. </p></td></tr></tbody></table>

5. Select the columns to use or specify the values you want.

<Tip>
  **Tip:** You can preview the data transformed by a tile by running a preview, clicking the tile in the canvas, then clicking the **Preview** tab.
</Tip>

## Date Operations Tile

<Frame>
  <img alt="Date_Operations.png" src="https://mintcdn.com/domoinc-openapi-sync-dataflows/YY6W1U347GpqLSJS/images/kb/ka05w00000124Tm-00N5w00000Ri7BU-0EM5w000005vNiT.png?fit=max&auto=format&n=YY6W1U347GpqLSJS&q=85&s=21473f0f2f67acc8ce3e46f54c450120" width="113" height="97" data-path="images/kb/ka05w00000124Tm-00N5w00000Ri7BU-0EM5w000005vNiT.png" />
</Frame>

The Date Operations tile lets you add a column with values from a date-based calculation.

Do the following to configure the **Date Operations** tile:

1. Click the **Date Operations** tile in the canvas.

2. (Optional) Rename the tile by clicking
   <InlineImage src="/images/kb/ka05w00000122yV-00N5w00000Ri7BU-0EM5w000005vNgL.png" /> **Edit**, then entering the name you want.

3. Enter the name of the new column.

4. Select the date operation you want.

   <table border="1" cellpadding="1" cellspacing="1"><thead><tr><th colspan="1" rowspan="1"><p> Operation </p></th><th colspan="1" rowspan="1"><p> Description </p></th></tr></thead><tbody><tr><td colspan="1" rowspan="1"><p> Add to date </p></td><td colspan="1" rowspan="1"><p> Returns the result of adding a unit of measurement to values in a date column. Units of measurement include months, weeks, days, hours, minutes, seconds, or milliseconds. </p></td></tr><tr><td colspan="1" rowspan="1"> Subtract from date </td><td colspan="1" rowspan="1"> Returns the result of subtracting a unit of measurement from values in a date column. Units of measurement include months, weeks, days, hours, minutes, seconds, or milliseconds. </td></tr><tr><td colspan="1" rowspan="1"> Difference between dates </td><td colspan="1" rowspan="1"> Returns the difference in a unit of measurement between two dates. Units of measurement include days, working days, hours, minutes, seconds, milliseconds. </td></tr><tr><td colspan="1" rowspan="1"><p> Year of date </p></td><td colspan="1" rowspan="1"><p> Returns the year for values in a date column. </p></td></tr><tr><td colspan="1" rowspan="1"><p> Quarter of date </p></td><td colspan="1" rowspan="1"><p> Returns the quarter for values in a date column. </p></td></tr><tr><td colspan="1" rowspan="1"><p> Month of date </p></td><td colspan="1" rowspan="1"><p> Returns the month for values in a date column. </p></td></tr><tr><td colspan="1" rowspan="1"><p> Day of year </p></td><td colspan="1" rowspan="1"><p> Returns the numerical day of the year for values in a date column. </p></td></tr><tr><td colspan="1" rowspan="1"><p> Day of month </p></td><td colspan="1" rowspan="1"><p> Returns the numerical day of the month for values in a date column. </p></td></tr><tr><td colspan="1" rowspan="1"><p> Day of week </p></td><td colspan="1" rowspan="1"><p> Returns the numerical day of the week for values in a date column. </p></td></tr><tr><td colspan="1" rowspan="1"><p> Week of year </p></td><td colspan="1" rowspan="1"><p> Returns the numerical week for values in a date column. Weeks are Sun-Sat. Week 1 is the first week with a Saturday in this year. </p></td></tr></tbody></table>

5. Select the columns to use or specify the values you want.

<Tip>
  **Tip:** You can preview the data transformed by a tile by running a preview, clicking the tile in the canvas, then clicking the **Preview** tab.
</Tip>