> ## Documentation Index
> Fetch the complete documentation index at: https://domoinc-openapi-sync-dataflows.mintlify.site/llms.txt
> Use this file to discover all available pages before exploring further.
# Magic ETL Tiles: Pivot
export const InlineImage = ({src, alt = '', height = '1.6em'}) => {
return  ;
};
### Intro
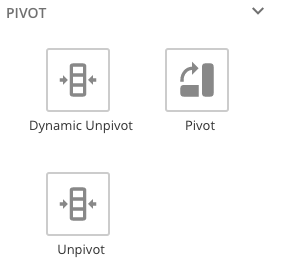
There are three available tiles under **Pivot** in Magic ETL:
* Dynamic Unpivot
* Pivot
* Unpivot
Learn what it means to [pivot a table](#video) in the video below.
Learn how to [Create a Magic ETL DataFlow](/s/article/360055259234 "Creating a Magic ETL DataFlow").
;
};
### Intro
There are three available tiles under **Pivot** in Magic ETL:
* Dynamic Unpivot
* Pivot
* Unpivot
Learn what it means to [pivot a table](#video) in the video below.
Learn how to [Create a Magic ETL DataFlow](/s/article/360055259234 "Creating a Magic ETL DataFlow").
 ***
### Dynamic Unpivot Tile
***
### Dynamic Unpivot Tile
 The Dynamic Unpivot tile lets you "unpivot" or normalize data in tables, transforming multiple columns in a single row into a single column with multiple rows. This tile is good in situations where the number of columns could potentially change. As columns are added, the Dynamic Unpivot tile automatically unpivotsthem.
##### Example
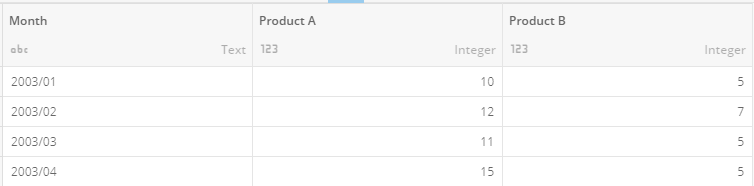
For example, the Dynamic Unpivot tile converts data where two products (Product A and Product B) appear in separate columns...
The Dynamic Unpivot tile lets you "unpivot" or normalize data in tables, transforming multiple columns in a single row into a single column with multiple rows. This tile is good in situations where the number of columns could potentially change. As columns are added, the Dynamic Unpivot tile automatically unpivotsthem.
##### Example
For example, the Dynamic Unpivot tile converts data where two products (Product A and Product B) appear in separate columns...
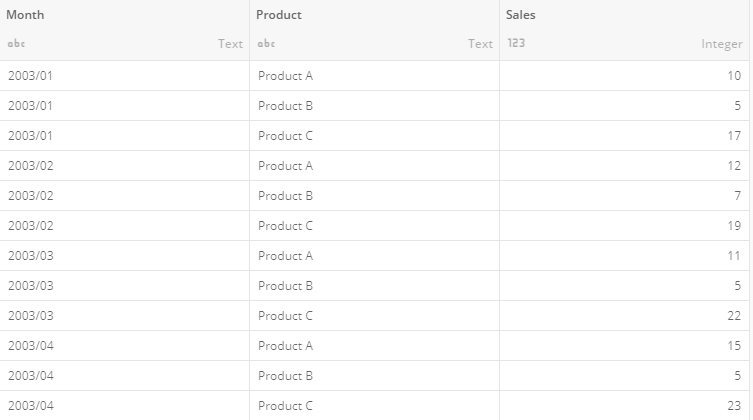
 ... to data where all products appear in the same column...
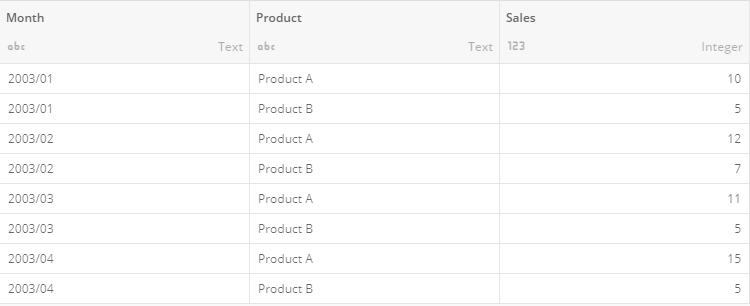 In this image, a third product (Product C) has been added to the `Product` column.
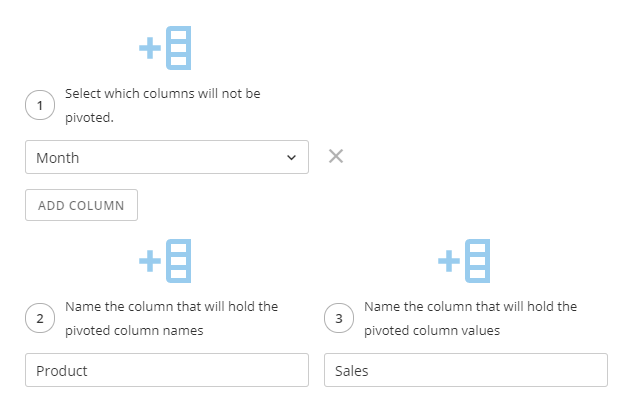
 The following configuration was used to achieve the results above.
* In step 1 of the Dynamic Unpivot tile editor, choose **Month**. This column is not pivoted.
* In step 2, name the column that will hold the pivoted column names. In this example, this column name is `Product.`
* In step 3, name the column that will hold the pivoted column values. In this example, this column name is `Sales.`
The following configuration was used to achieve the results above.
* In step 1 of the Dynamic Unpivot tile editor, choose **Month**. This column is not pivoted.
* In step 2, name the column that will hold the pivoted column names. In this example, this column name is `Product.`
* In step 3, name the column that will hold the pivoted column values. In this example, this column name is `Sales.`
 Follow these steps to configure the Dynamic Unpivot tile:
1. Drag the **Dynamic** **Unpivot** tile to the canvas and connect it to the rest of your flow.
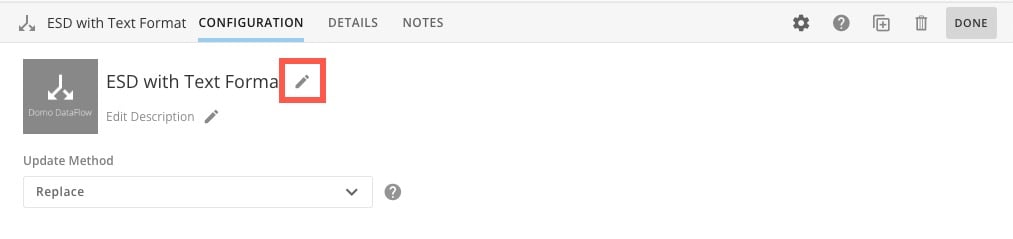
2. (Optional) Rename the tile. In the **Configuration** tab of the tile editor, select **Edit**.
Follow these steps to configure the Dynamic Unpivot tile:
1. Drag the **Dynamic** **Unpivot** tile to the canvas and connect it to the rest of your flow.
2. (Optional) Rename the tile. In the **Configuration** tab of the tile editor, select **Edit**.
 3. In step 1 of the tile editor, enter the name of the column that you DO NOT want to be pivoted. This will duplicate the value in this row per column that is being pivoted.
4. In step 2, name the column you want to create to contain the column headings from the columns to unpivot.
5. In step 3, name the column you want to create to contain the row values from the columns to be unpivoted.
Now, each new column added to this DataSet will automatically be pivoted unless you add it to Step 1 (these columns are not pivoted.)
**Tip:** You can preview the data transformed by a tile by running a preview, clicking the tile in the canvas, then clicking the **Preview** tab.
### Pivot Tile
3. In step 1 of the tile editor, enter the name of the column that you DO NOT want to be pivoted. This will duplicate the value in this row per column that is being pivoted.
4. In step 2, name the column you want to create to contain the column headings from the columns to unpivot.
5. In step 3, name the column you want to create to contain the row values from the columns to be unpivoted.
Now, each new column added to this DataSet will automatically be pivoted unless you add it to Step 1 (these columns are not pivoted.)
**Tip:** You can preview the data transformed by a tile by running a preview, clicking the tile in the canvas, then clicking the **Preview** tab.
### Pivot Tile
 The Pivot tile lets you "pivot" or de-normalize data in tables using key-value pairs, transforming a single column with multiple rows into multiple columns in a single row.
**Note:** If you create a table that reaches the 1500-column limit, you will receive an error. You must reduce the number of columns to continue running your Magic ETL DataFlow.
**Example**
For example, the Pivot tile converts data where products A, B, and C are in the same column...
The Pivot tile lets you "pivot" or de-normalize data in tables using key-value pairs, transforming a single column with multiple rows into multiple columns in a single row.
**Note:** If you create a table that reaches the 1500-column limit, you will receive an error. You must reduce the number of columns to continue running your Magic ETL DataFlow.
**Example**
For example, the Pivot tile converts data where products A, B, and C are in the same column...
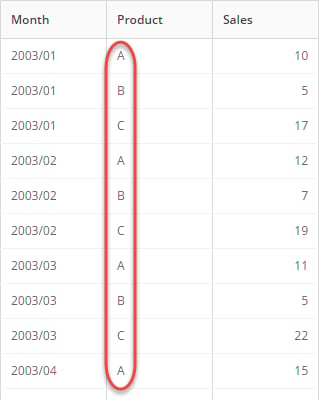 ... to data where products A, B, and C each have their own column.
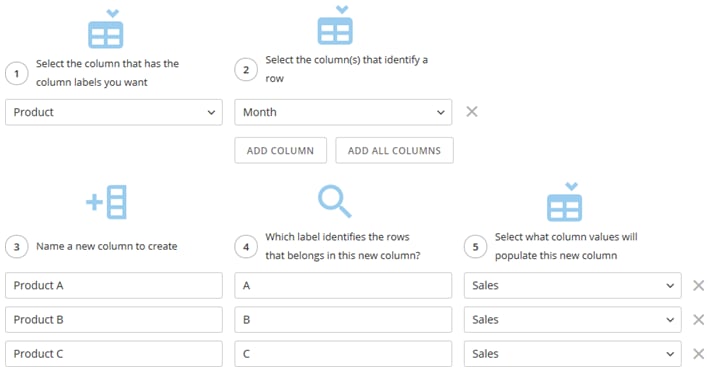
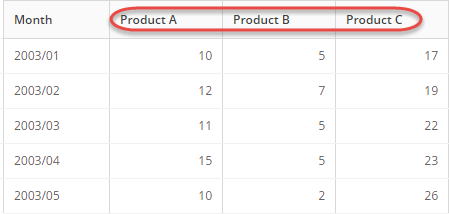 The following configuration was used to achieve the results above.
* In step 1 of the Pivot tile editor, choose **Product**.
* In step 2, select the column(s) that identify a row. In this example, the column is `Month.`
* In step 3, name the new column(s) to create. In this example, three columns are created, `Product A,` `Product B,` and `Product C.`
* In step 4, provide the label that identifies the rows that belong in each new column. In this example, the labels are `A,` `B,` and `C.`
* In step 5, select what column values will populate the new column. In this example, the column for each product is `Sales.`
The following configuration was used to achieve the results above.
* In step 1 of the Pivot tile editor, choose **Product**.
* In step 2, select the column(s) that identify a row. In this example, the column is `Month.`
* In step 3, name the new column(s) to create. In this example, three columns are created, `Product A,` `Product B,` and `Product C.`
* In step 4, provide the label that identifies the rows that belong in each new column. In this example, the labels are `A,` `B,` and `C.`
* In step 5, select what column values will populate the new column. In this example, the column for each product is `Sales.`
 Follow these steps to configure the Pivot tile:
1. Drag the **Pivot** tile to the canvas and connect it to the rest of your flow.
2. (Optional) Rename the tile. In the **Configuration** tab of the tile editor, select **Edit**.
3. Enter the name of the key column you want to pivot into new column headers.
For example, "Product".
4. Select the column to use to group the row values of the new columns.
For example, "Month".
5. For each new column you want to create from the key column, do the following:
1. Enter the name of the new column header.
For example, "Product A".
2. Enter a value from the key column that represents the column header to be pivoted.
For example, "A".
3. Select the value column to use to fill the row value of the new column.
4. For example, "Sales".
**Note:** For each column you add to be pivoted, select the same value column.
5. (Conditional) If you want to add another column, then click **Add Column**.
**Tip:** You can preview the data transformed by a tile by running a preview, clicking the tile in the canvas, then viewing the **Preview** tab.
### Unpivot Tile
Follow these steps to configure the Pivot tile:
1. Drag the **Pivot** tile to the canvas and connect it to the rest of your flow.
2. (Optional) Rename the tile. In the **Configuration** tab of the tile editor, select **Edit**.
3. Enter the name of the key column you want to pivot into new column headers.
For example, "Product".
4. Select the column to use to group the row values of the new columns.
For example, "Month".
5. For each new column you want to create from the key column, do the following:
1. Enter the name of the new column header.
For example, "Product A".
2. Enter a value from the key column that represents the column header to be pivoted.
For example, "A".
3. Select the value column to use to fill the row value of the new column.
4. For example, "Sales".
**Note:** For each column you add to be pivoted, select the same value column.
5. (Conditional) If you want to add another column, then click **Add Column**.
**Tip:** You can preview the data transformed by a tile by running a preview, clicking the tile in the canvas, then viewing the **Preview** tab.
### Unpivot Tile
 The Unpivot tile lets you "unpivot" or "normalize" data in tables, transforming multiple columns in a single row into a single column with multiple rows. This action is useful only for unpivoting data in which the number of columns stays the same. If you add another column of data to the original file, this action does not unpivot the new column.
**Example**
For example, the Unpivot tile converts data in this pivoted format...
The Unpivot tile lets you "unpivot" or "normalize" data in tables, transforming multiple columns in a single row into a single column with multiple rows. This action is useful only for unpivoting data in which the number of columns stays the same. If you add another column of data to the original file, this action does not unpivot the new column.
**Example**
For example, the Unpivot tile converts data in this pivoted format...
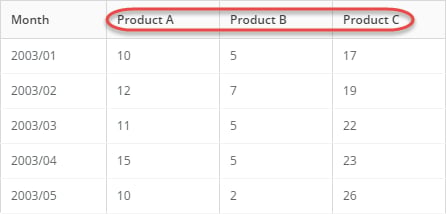 ... to data in this format...
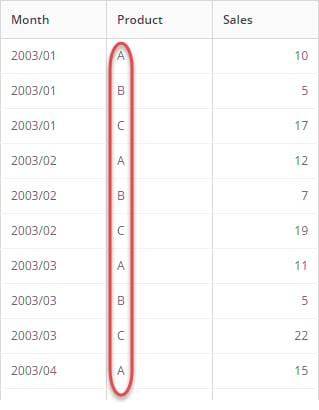 ... using this configuration:
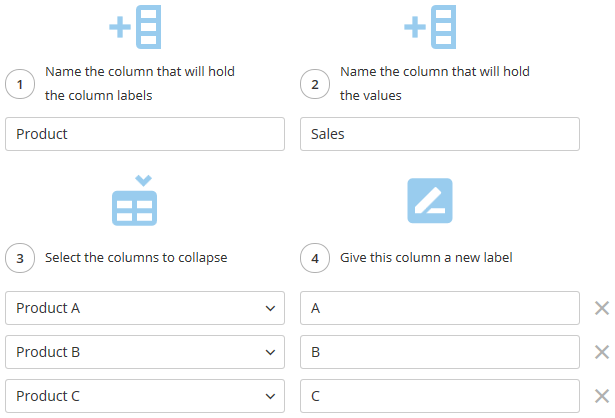 **To configure the Unpivot tile,**
1. Click the **Unpivot** tile in the canvas.
2. (Optional) Rename the tile by clicking
, then entering the name you want.
3. Enter the name of the column you want to create to contain the column headings from the columns to unpivot.
For example, "Product".
4. Enter the name of the column you want to create to contain the row values from the columns to be unpivoted.
For example, "Sales".
5. For each column you want to unpivot, do the following:
1. Select a column to normalize.
For example, "Product A".
2. Enter a value representing the column header to be normalized.
The value appears in the row of the new column. For example, "A".
3. (Conditional) If you want to unpivot another column, then click **Add Column**.
**Tip:** You can preview the data transformed by a tile by running a preview, clicking the tile in the canvas, then clicking the **Preview** tab.
### What it Means to Pivot a Table (video)
**To configure the Unpivot tile,**
1. Click the **Unpivot** tile in the canvas.
2. (Optional) Rename the tile by clicking
, then entering the name you want.
3. Enter the name of the column you want to create to contain the column headings from the columns to unpivot.
For example, "Product".
4. Enter the name of the column you want to create to contain the row values from the columns to be unpivoted.
For example, "Sales".
5. For each column you want to unpivot, do the following:
1. Select a column to normalize.
For example, "Product A".
2. Enter a value representing the column header to be normalized.
The value appears in the row of the new column. For example, "A".
3. (Conditional) If you want to unpivot another column, then click **Add Column**.
**Tip:** You can preview the data transformed by a tile by running a preview, clicking the tile in the canvas, then clicking the **Preview** tab.
### What it Means to Pivot a Table (video)