> ## Documentation Index
> Fetch the complete documentation index at: https://domoinc-openapi-sync-dataflows.mintlify.site/llms.txt
> Use this file to discover all available pages before exploring further.
# Magic ETL Tiles: Filter
export const InlineImage = ({src, alt = '', height = '1.6em'}) => {
return  ;
};
### Intro
This article describes the available Filter tiles in Magic ETL: Filter Rows, Split Filter (limited release), and Remove Duplicates.
;
};
### Intro
This article describes the available Filter tiles in Magic ETL: Filter Rows, Split Filter (limited release), and Remove Duplicates.
 Learn to [create a Magic ETL DataFlow](/s/article/360055259234 "Creating a Magic ETL DataFlow").
***
### Filter Rows Tile
Learn to [create a Magic ETL DataFlow](/s/article/360055259234 "Creating a Magic ETL DataFlow").
***
### Filter Rows Tile
 The Filter Rows tile lets you include or exclude rows based on specified rules.
**Example**
For example, the Filter Rows tile transforms the column in the first image to the column in the second image.
The Filter Rows tile lets you include or exclude rows based on specified rules.
**Example**
For example, the Filter Rows tile transforms the column in the first image to the column in the second image.
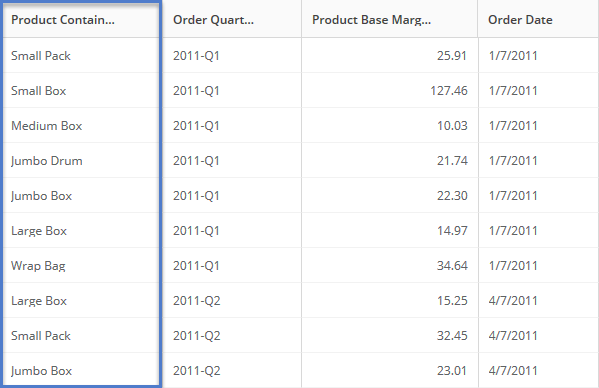
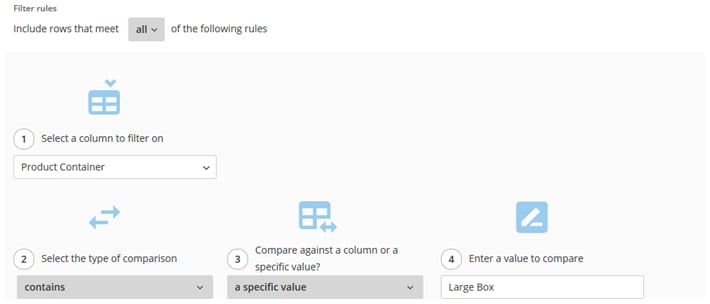
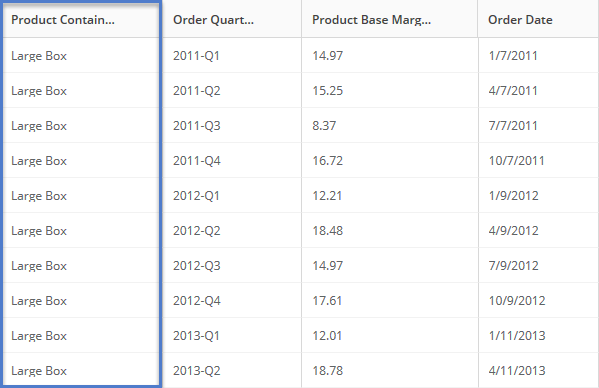 The configuration for this transformation is as follows:
1. Choose the `Product Container` column to filter on.
2. Choose a `contains` comparison.
3. Choose to compare against a specific value.
4. Enter the value `Large Box.`
The configuration for this transformation is as follows:
1. Choose the `Product Container` column to filter on.
2. Choose a `contains` comparison.
3. Choose to compare against a specific value.
4. Enter the value `Large Box.`
 You can configure the Filter Rows tile by following these steps:
1. Drag the **Filter Rows** tile from the **Filters** section in the left panel to the canvas and connect it to the rest of your DataFlow.
2. (Optional) Rename the tile.
3. Select either **Add Filter Rule** or **Add Formula Rule**.
1. If you choose **Add** **Filter Rule**, do the following:
1. Select a column to filter on.
2. Select the operation to use.
Operation items appear in the list, depending on the type of data in the column to filter on.
3. Select whether to compare against values in a specific column or a specific value, then do one of the following:
* (Conditional) If comparing against a column, select the column to use.
* (Conditional) If comparing against a specific value, enter the value to use.
4. (Conditional) If you want to add another rule, select either **Add Filter Rule** or **Add Formula Rule**.
2. If you choose **Add** **Formula Rule**, do the following:
1. Enter the formula you want to use.
2. Select
**Validate** to check the formula.
OR
1. Select **Open the Formula Editor**.
You can configure the Filter Rows tile by following these steps:
1. Drag the **Filter Rows** tile from the **Filters** section in the left panel to the canvas and connect it to the rest of your DataFlow.
2. (Optional) Rename the tile.
3. Select either **Add Filter Rule** or **Add Formula Rule**.
1. If you choose **Add** **Filter Rule**, do the following:
1. Select a column to filter on.
2. Select the operation to use.
Operation items appear in the list, depending on the type of data in the column to filter on.
3. Select whether to compare against values in a specific column or a specific value, then do one of the following:
* (Conditional) If comparing against a column, select the column to use.
* (Conditional) If comparing against a specific value, enter the value to use.
4. (Conditional) If you want to add another rule, select either **Add Filter Rule** or **Add Formula Rule**.
2. If you choose **Add** **Formula Rule**, do the following:
1. Enter the formula you want to use.
2. Select
**Validate** to check the formula.
OR
1. Select **Open the Formula Editor**.
 2. In the expanded formula editor, enter the formula you want to use in the **Calculation** field.
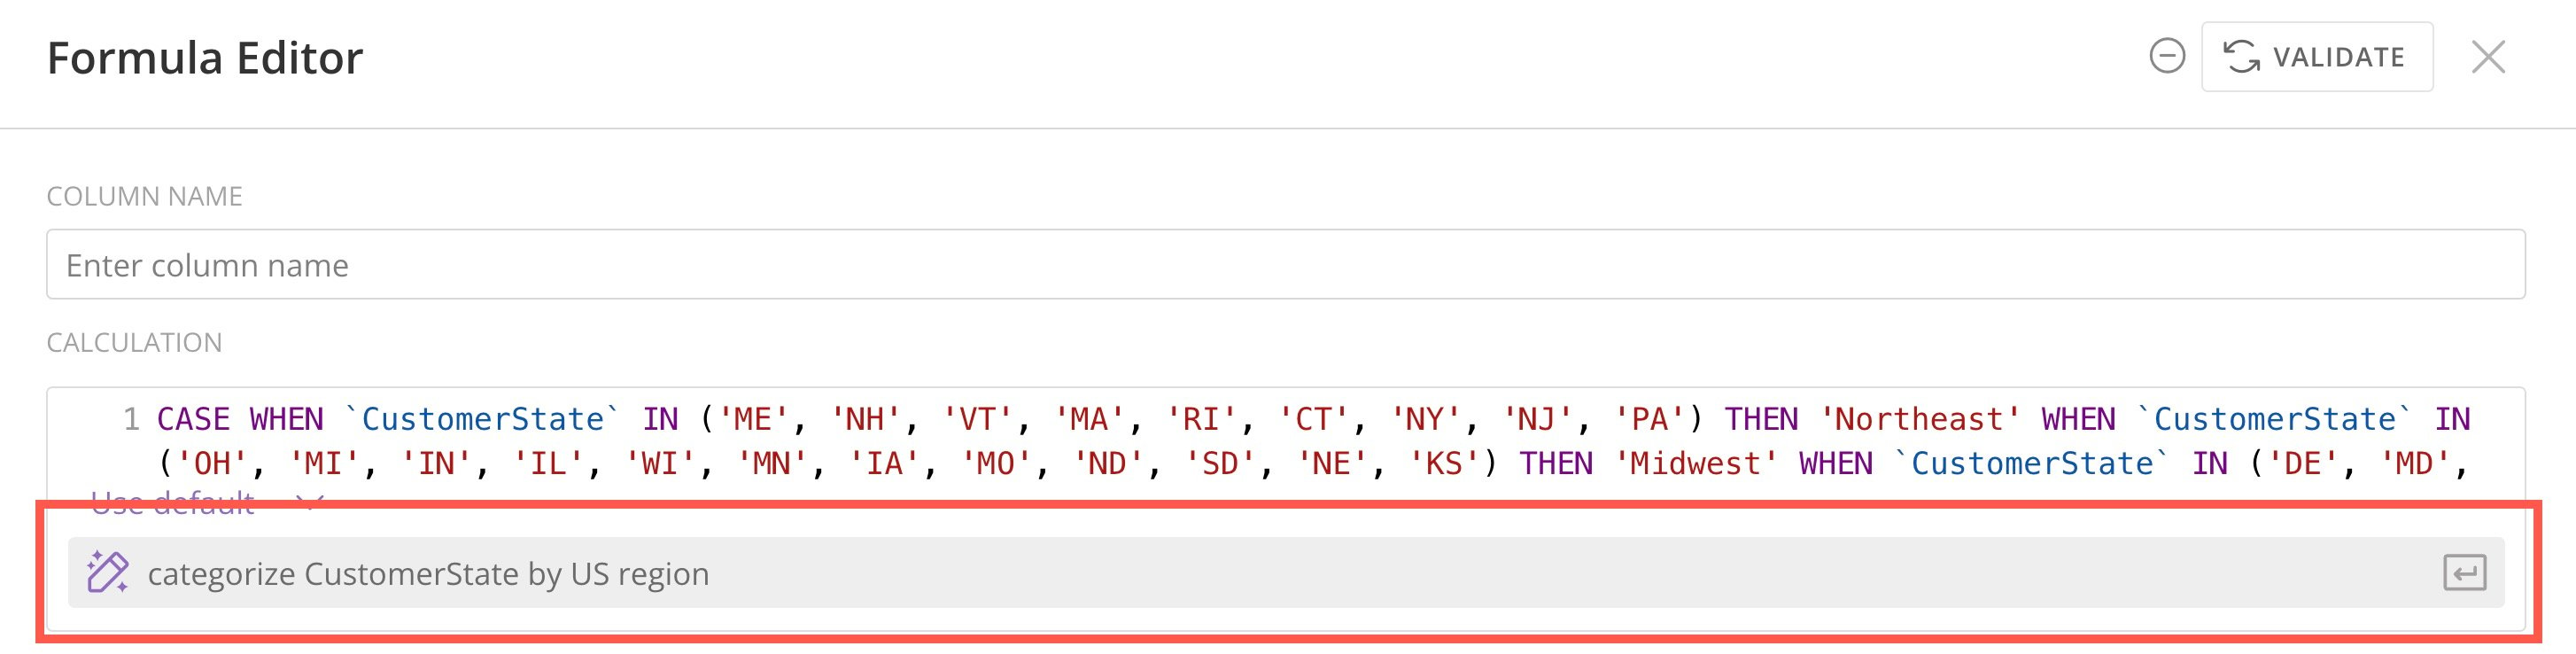
**Use the AI SQL Assistant:** The AI SQL Assistant is available in the expanded formula editor. Use the prompt field at the bottom of the **Calculation** field to enter your query in natural language. The SQL appears above in the **Calculation** field.
2. In the expanded formula editor, enter the formula you want to use in the **Calculation** field.
**Use the AI SQL Assistant:** The AI SQL Assistant is available in the expanded formula editor. Use the prompt field at the bottom of the **Calculation** field to enter your query in natural language. The SQL appears above in the **Calculation** field.
 3. Use the **Validate** option to check the formula.
4. Save and close to return to the canvas.
4. To add another rule, choose either **Add Filter Rule** or **Add Formula Rule**.
**Note:** For more information on creating a successful filter using the Formula Rule, see [Writing a Filter Formula in Magic ETL](/s/article/360044296573 "How to Write a Filter Formula in Magic ETL v2 (Beta)").
5. Select whether to include rows that meet all or any of the rules you define.
**Tip:** You can preview the data transformed by a tile by running a preview, clicking the tile in the canvas, then clicking the **Preview** tab.
### Split Filter Tile (Limited Release)
**Important:** The Split Filter tile is currently only available for Magic ETL on Snowflake or Databricks. It is targeted for general release by the end of 2025.
If you have a Domo integration with Snowflake or Databricks, you can access the Split Filter tile in Magic ETL. This tile allows you to have multiple output streams from a filter in your DataFlow. It is useful when you want multiple streams, one to represent each filter condition, and/or a stream to represent everything that is dropping out of the DataFlow because of the filter.
# Configure Split Filter Tile
1. Drag a Split Filter tile to the canvas from the **Filter** section of the left panel. This tile has a bigger footprint on the canvas than a standard tile, and it grows as you add more output streams.
2. Connect the tile to your DataFlow.
3. Use the **Validate** option to check the formula.
4. Save and close to return to the canvas.
4. To add another rule, choose either **Add Filter Rule** or **Add Formula Rule**.
**Note:** For more information on creating a successful filter using the Formula Rule, see [Writing a Filter Formula in Magic ETL](/s/article/360044296573 "How to Write a Filter Formula in Magic ETL v2 (Beta)").
5. Select whether to include rows that meet all or any of the rules you define.
**Tip:** You can preview the data transformed by a tile by running a preview, clicking the tile in the canvas, then clicking the **Preview** tab.
### Split Filter Tile (Limited Release)
**Important:** The Split Filter tile is currently only available for Magic ETL on Snowflake or Databricks. It is targeted for general release by the end of 2025.
If you have a Domo integration with Snowflake or Databricks, you can access the Split Filter tile in Magic ETL. This tile allows you to have multiple output streams from a filter in your DataFlow. It is useful when you want multiple streams, one to represent each filter condition, and/or a stream to represent everything that is dropping out of the DataFlow because of the filter.
# Configure Split Filter Tile
1. Drag a Split Filter tile to the canvas from the **Filter** section of the left panel. This tile has a bigger footprint on the canvas than a standard tile, and it grows as you add more output streams.
2. Connect the tile to your DataFlow.
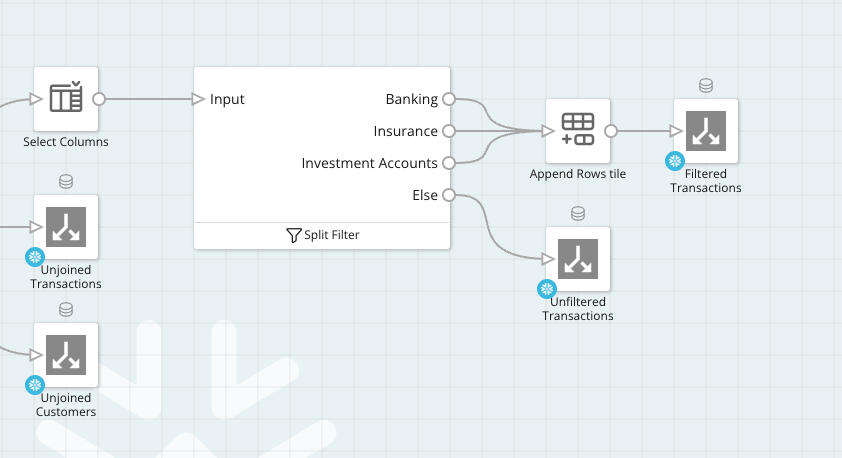 3. Configure the formula filters. Each formula represents a different stream that will be output from the tile.
**Note:** In this tile, you can only configure formula filters and not filter rules.
4. Choose whether or not to output all unfiltered rows as an "else."
5. (Optional) Name any of the filter outputs, including the "else" output.
The outputs you choose display on the canvas as multiple nodes.
3. Configure the formula filters. Each formula represents a different stream that will be output from the tile.
**Note:** In this tile, you can only configure formula filters and not filter rules.
4. Choose whether or not to output all unfiltered rows as an "else."
5. (Optional) Name any of the filter outputs, including the "else" output.
The outputs you choose display on the canvas as multiple nodes.
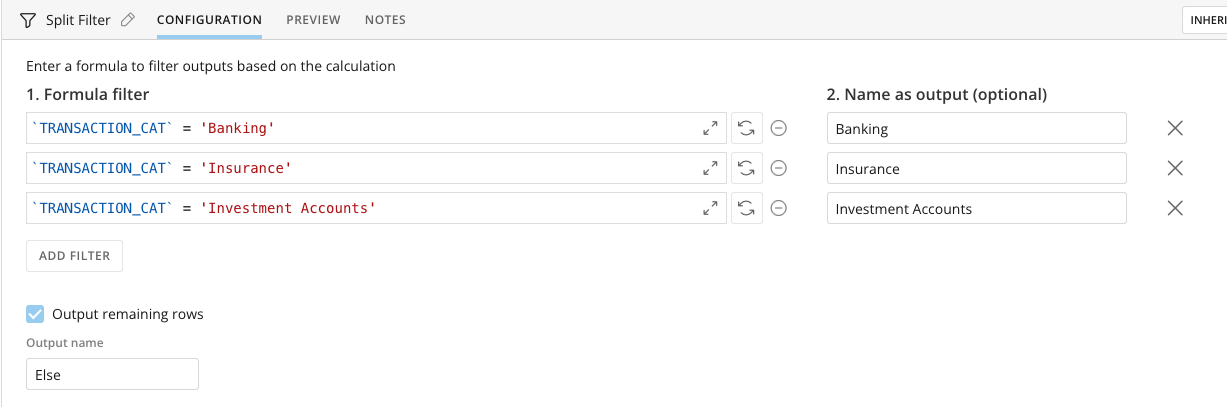 6. Build your downstream DataFlow from any of the outputs.
### Remove Duplicates Tile
6. Build your downstream DataFlow from any of the outputs.
### Remove Duplicates Tile
 The Remove Duplicates tile lets you remove duplicate rows of data based on specific columns.
Follow these steps to configure the Remove Duplicates tile when you have rows with identical data:
1. Bring your DataSet into Magic ETL as an input.
2. Drag a **Remove Duplicates** tile to the canvas from the left panel under **Filter**.
3. Connect your data to the tile.
4. Select the input DataSet tile to open the tile editor below the canvas. In step 1 of the **Configuration** tab, choose the columns to use to check for duplicates. Choosing one or more columns that correctly identify a unique row keeps you from removing vital data. For example, if there is a column of `Transaction IDs` that are unique for each sale in the data, using this column ensures that you only remove true duplicates.
A row is only removed if *all* of the columns selected in the Remove Duplicates tile are duplicates.
**Note:** By default, all columns are selected. You can remove columns one at a time or use the **Remove All Columns** option. To re-add a column, you can choose **Add Column** to add individual columns or use the **Add All Columns** option.
The Remove Duplicates tile lets you remove duplicate rows of data based on specific columns.
Follow these steps to configure the Remove Duplicates tile when you have rows with identical data:
1. Bring your DataSet into Magic ETL as an input.
2. Drag a **Remove Duplicates** tile to the canvas from the left panel under **Filter**.
3. Connect your data to the tile.
4. Select the input DataSet tile to open the tile editor below the canvas. In step 1 of the **Configuration** tab, choose the columns to use to check for duplicates. Choosing one or more columns that correctly identify a unique row keeps you from removing vital data. For example, if there is a column of `Transaction IDs` that are unique for each sale in the data, using this column ensures that you only remove true duplicates.
A row is only removed if *all* of the columns selected in the Remove Duplicates tile are duplicates.
**Note:** By default, all columns are selected. You can remove columns one at a time or use the **Remove All Columns** option. To re-add a column, you can choose **Add Column** to add individual columns or use the **Add All Columns** option.
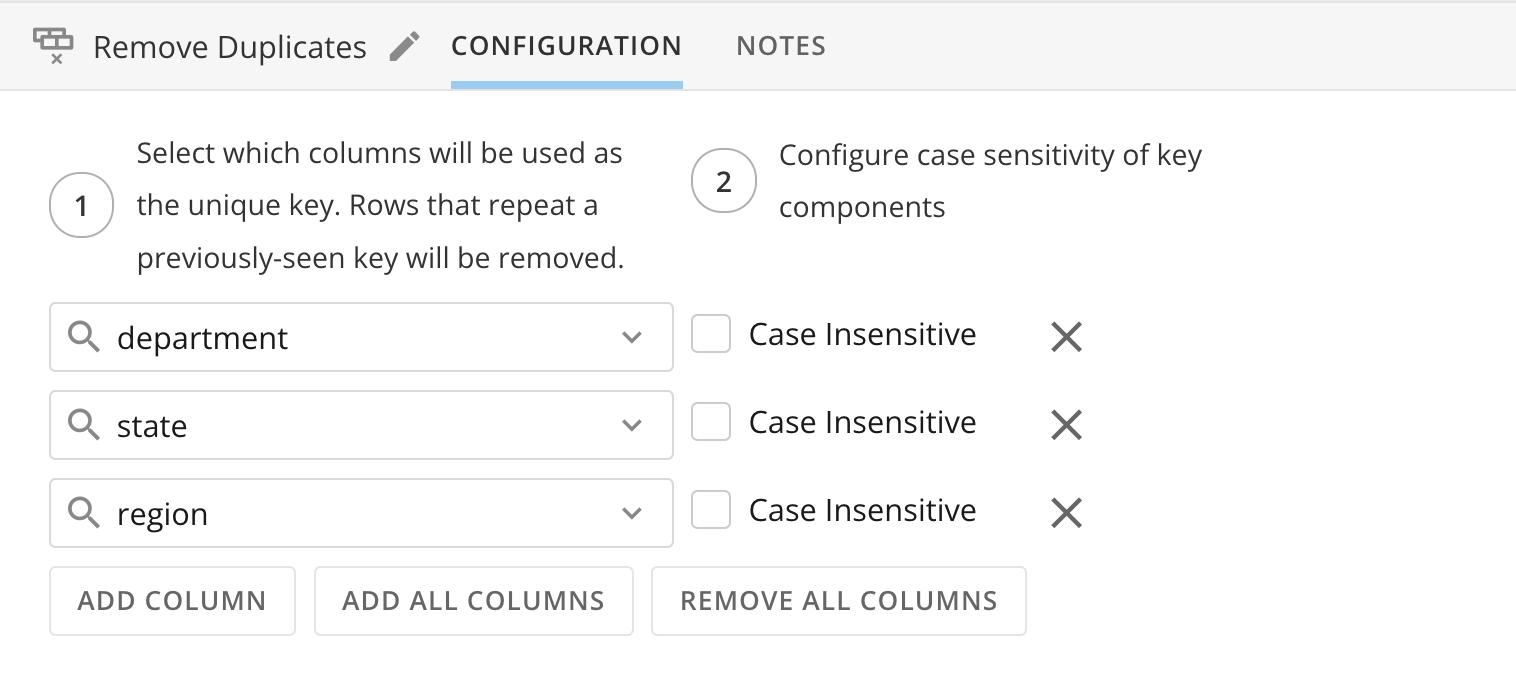 5. (Optional) By default, key columns are case-sensitive. Using the checkboxes, you can individually make columns case-insensitive.
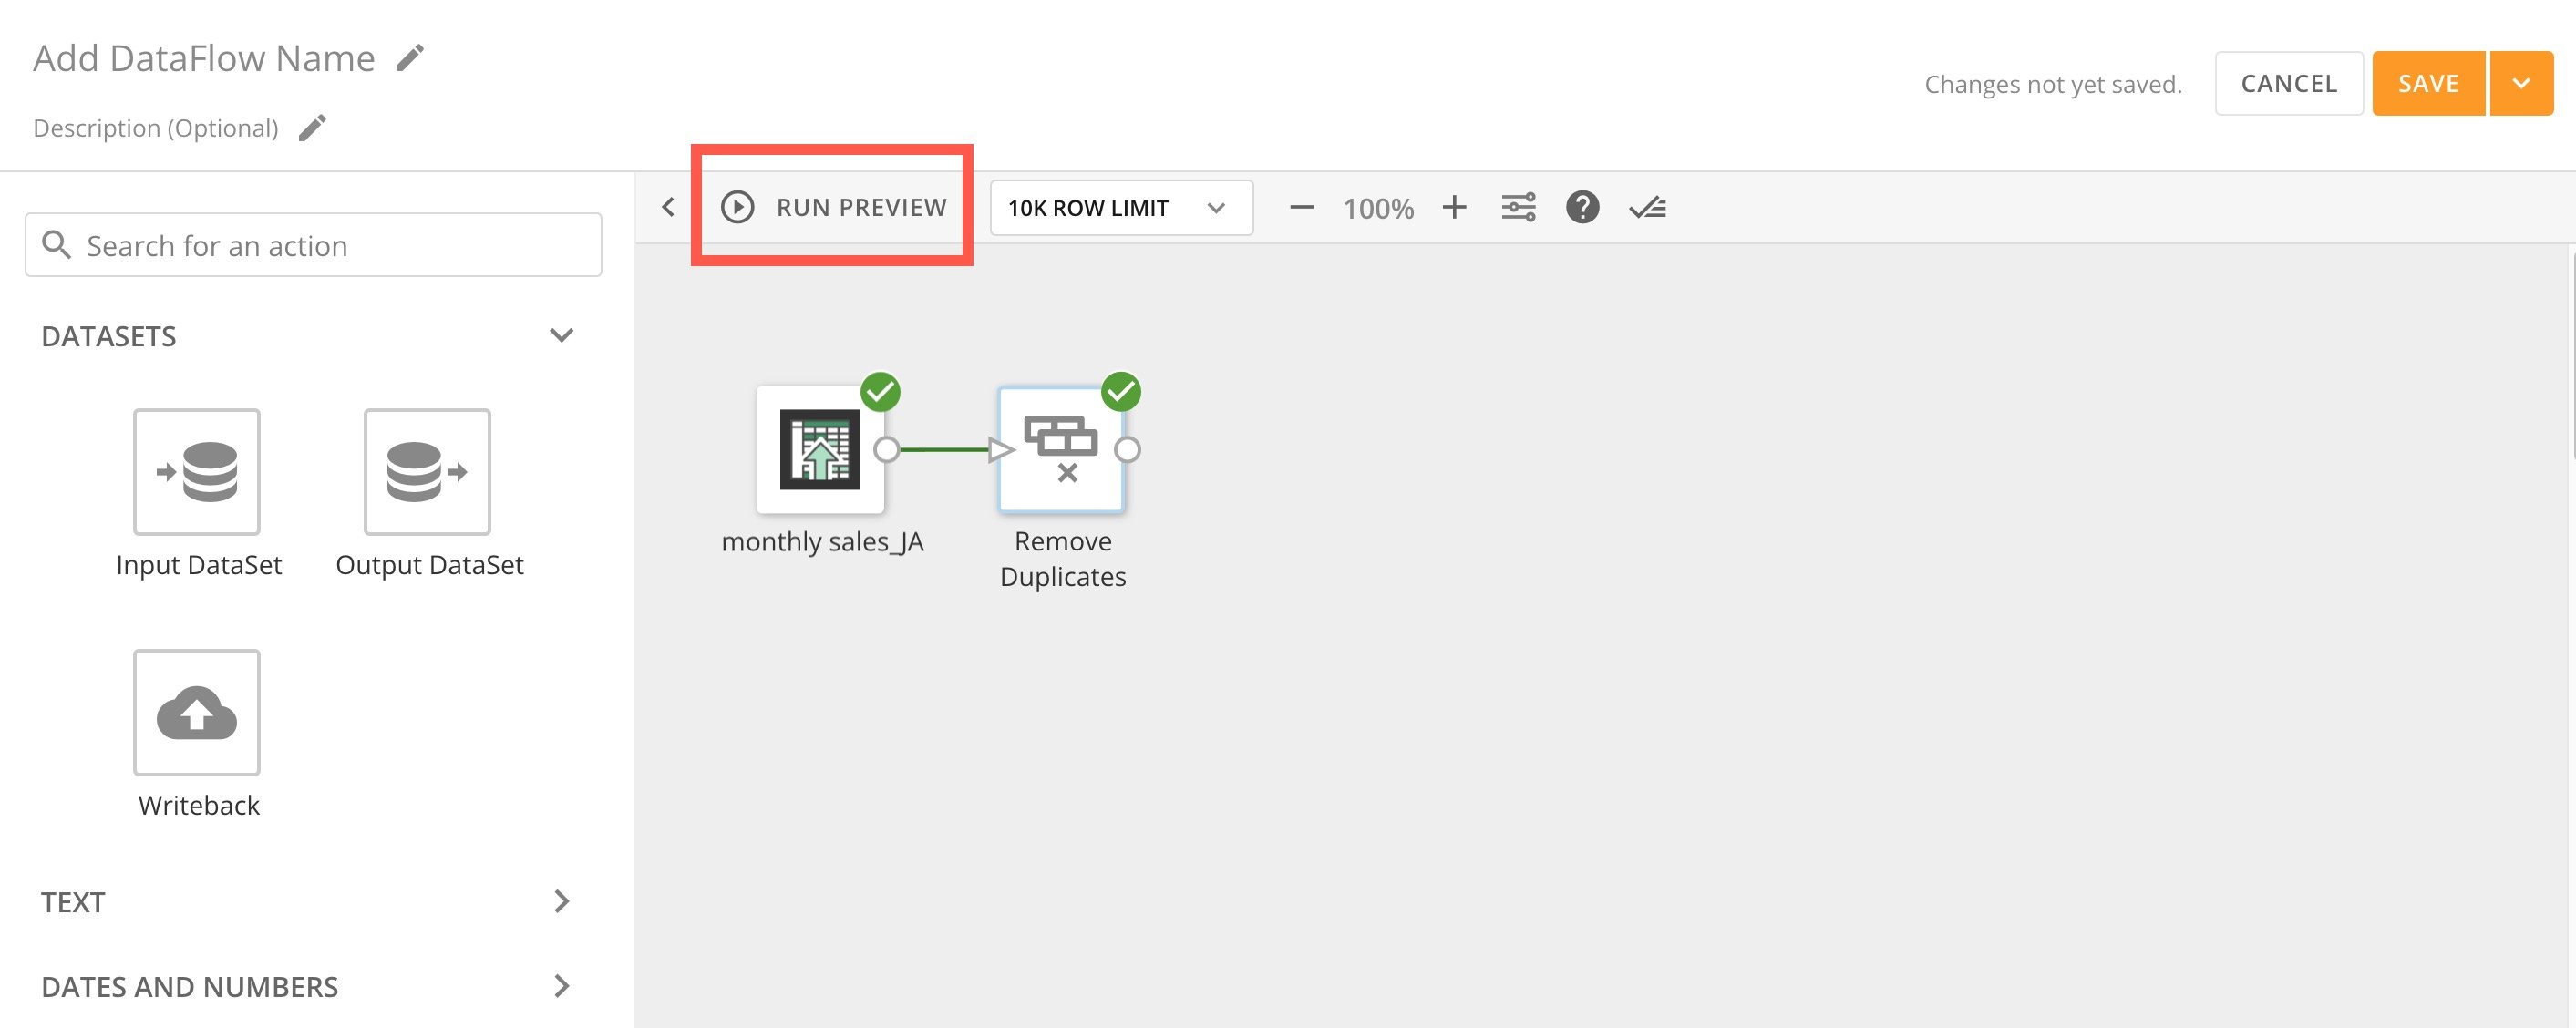
6. (Optional) Select **Run Preview** to preview your completed data transformation.
5. (Optional) By default, key columns are case-sensitive. Using the checkboxes, you can individually make columns case-insensitive.
6. (Optional) Select **Run Preview** to preview your completed data transformation.