> ## Documentation Index
> Fetch the complete documentation index at: https://domoinc-openapi-sync-dataflows.mintlify.site/llms.txt
> Use this file to discover all available pages before exploring further.
# Sample Beast Mode Calculations: Card Element Transforms
### Intro
Beast Mode calculations allow you to apply unique formatting to various elements within Domo, such as cards, tables, and Summary Numbers.
**Note:** When adding graphics, links, and images to Table Cards using Beast Mode, remember the following:
* Mega Tables do not support HTML tags or style attributes in HTML; they support only images and links.
* HTML Tables support HTML tags and style attributes, such as style="background-color".
* HTML Tables do not support filtering when content is added to cells using a Beast Mode calculation. For more information, see our article about
[Applying Page-Level Filters with Filter Views](https://domo-support.domo.com/s/article/360042923914).
 This article describes Beast Mode calculations for card transformations in the following categories:
* [Stylizing a value in a table](#StylizingaValueinaTable)
* [Including a URL in a Table Card](#IncludingaURLinaTableCard)
* [Formatting a Summary Number](#FormattingaSummaryNumber)
* [Showing different pictures in a table based on changing values](#ShowingDifferentPicturesinaTableBasedonChangingValues)
***
### Stylize a Value in a Table
You can use a Beast Mode calculation to stylize a cell value in a table. For example, to stylize a cell in the `Salesperson` column when the cell value equals `Bob`, create a calculation named `Salesperson`, and then use the following code:
```
CASE `salesperson`
when 'Bob' then CONCAT('',`salesperson`,'')
else `salesperson`
end
```
### Include a URL in a Table Card
Use the following Beast Mode calculation to insert a URL into a Table Card:
```
CONCAT(`TopicName`, ': ', '', `Link`, '')
```
"TopicName" refers to the field in the DataSet with your topic names, and "Link" refers to the field with the URLs.
**Important:** URLs must begin with `https://`.
### Format a Summary Number
You can use a Beast Mode calculation to change the font size for a Summary Number, customize other aspects of a Summary Number's appearance, and even include multiple Summary Numbers in the same card.
**Important:** The changes discussed in this section are not supported on Domo Mobile or when exporting to PowerPoint. In these cases, HTML is displayed instead of the Summary Numbers.
# Change the Font Size of a Summary Number
To change the font size of a Summary Number, wrap your Beast Mode calculation in a concat() function that specifies the font size using div tags, as shown below.
```
CONCAT('
This article describes Beast Mode calculations for card transformations in the following categories:
* [Stylizing a value in a table](#StylizingaValueinaTable)
* [Including a URL in a Table Card](#IncludingaURLinaTableCard)
* [Formatting a Summary Number](#FormattingaSummaryNumber)
* [Showing different pictures in a table based on changing values](#ShowingDifferentPicturesinaTableBasedonChangingValues)
***
### Stylize a Value in a Table
You can use a Beast Mode calculation to stylize a cell value in a table. For example, to stylize a cell in the `Salesperson` column when the cell value equals `Bob`, create a calculation named `Salesperson`, and then use the following code:
```
CASE `salesperson`
when 'Bob' then CONCAT('',`salesperson`,'')
else `salesperson`
end
```
### Include a URL in a Table Card
Use the following Beast Mode calculation to insert a URL into a Table Card:
```
CONCAT(`TopicName`, ': ', '', `Link`, '')
```
"TopicName" refers to the field in the DataSet with your topic names, and "Link" refers to the field with the URLs.
**Important:** URLs must begin with `https://`.
### Format a Summary Number
You can use a Beast Mode calculation to change the font size for a Summary Number, customize other aspects of a Summary Number's appearance, and even include multiple Summary Numbers in the same card.
**Important:** The changes discussed in this section are not supported on Domo Mobile or when exporting to PowerPoint. In these cases, HTML is displayed instead of the Summary Numbers.
# Change the Font Size of a Summary Number
To change the font size of a Summary Number, wrap your Beast Mode calculation in a concat() function that specifies the font size using div tags, as shown below.
```
CONCAT(''
,CONCAT('2017',' ','Booked',' ','Rev',' ','$',round(sum(`Grouped booked Rev`)/1000000,2),'M',' ','v.',' ',' ','Budget',' ','Rev',' ','$',round(sum(`2017 Budget Revenue`)/1000000,2),'M')
,'
'
)
```
# Create a Custom Summary Number
Custom Summary Numbers provide quick insight into what is most important in a card. By adding multiple dimensions, colors, or even symbols, you can build a custom Summary Number that highlights what you want users to see first.
To do this, create a Beast Mode calculation using the concat() function, which allows you to combine multiple strings into one.
**Note:** This bypasses formatting options, such as thousand separators, so you must include the strings in the concat() statement.
Take a look at the following sample calculations and their corresponding outputs:
#### Example 1
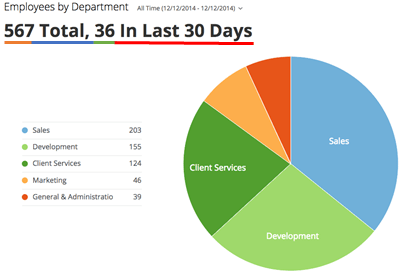
Use the Beast Mode calculation below to display a Summary Number as shown in the chart.
```
CONCAT(Sum(CASE when `Status` <> 'New' then 1 END),' Total, ',sum(case when `Date` >= date_sub(curdate(),INTERVAL 1 MONTH) then 1 else 0 end),' In Last 30 Days')
```
 #### Example 2
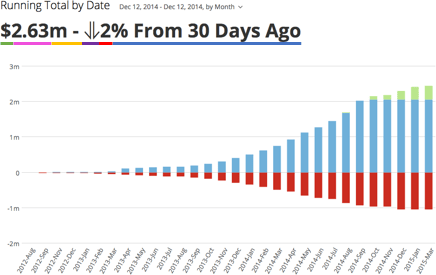
Use the Beast Mode calculation below to display a Summary Number as shown in the chart.
```
CONCAT('$',round(SUM(Case when (`Date`<= curdate() and `Status` = 'Accepted' and `Account Status` = 'Active') then `Amount` END)/1000000,2),’m – ‘,(case when `Value` > 0 then 'm -? ' else 'm -? ' end),round(round(SUM(Case when (`Date`<= curdate() and `Status` = 'Accepted' and `Account Status` = 'Active') then `Amount` END)/SUM(Case when (`Date`<= date_sub(curdate(), INTERVAL 1 MONTH) and `Status` = 'Accepted' and `Account Status` = 'Active') then `Amount` END)-1,2)*100,0),'% From 30 Days Ago')
```
#### Example 2
Use the Beast Mode calculation below to display a Summary Number as shown in the chart.
```
CONCAT('$',round(SUM(Case when (`Date`<= curdate() and `Status` = 'Accepted' and `Account Status` = 'Active') then `Amount` END)/1000000,2),’m – ‘,(case when `Value` > 0 then 'm -? ' else 'm -? ' end),round(round(SUM(Case when (`Date`<= curdate() and `Status` = 'Accepted' and `Account Status` = 'Active') then `Amount` END)/SUM(Case when (`Date`<= date_sub(curdate(), INTERVAL 1 MONTH) and `Status` = 'Accepted' and `Account Status` = 'Active') then `Amount` END)-1,2)*100,0),'% From 30 Days Ago')
```
 #### Example 3
You can even add HTML to your `concat()` function to include images, color-coding, and other styling. For a complete list of supported HTML, see our article on [HTML Table Restrictions](https://domo-support.domo.com/s/article/360043430033?language=en_US).
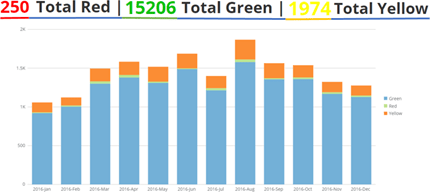
Use the Beast Mode calculation below to display a Summary Number as shown in the chart.
```
CONCAT('',SUM(CASE WHEN `Color` = 'Red' THEN `Value` END),'',' Total Red | ','',SUM(CASE WHEN `Color` = 'Green' THEN `Value` END),'',' Total Green | ','',SUM(CASE WHEN `Color` = 'Yellow' THEN `Value` END),'',' Total Yellow')
```
#### Example 3
You can even add HTML to your `concat()` function to include images, color-coding, and other styling. For a complete list of supported HTML, see our article on [HTML Table Restrictions](https://domo-support.domo.com/s/article/360043430033?language=en_US).
Use the Beast Mode calculation below to display a Summary Number as shown in the chart.
```
CONCAT('',SUM(CASE WHEN `Color` = 'Red' THEN `Value` END),'',' Total Red | ','',SUM(CASE WHEN `Color` = 'Green' THEN `Value` END),'',' Total Green | ','',SUM(CASE WHEN `Color` = 'Yellow' THEN `Value` END),'',' Total Yellow')
```
 **Note:**
* You cannot see the effects of the HTML coding while in the
**Edit** view of a card. To see the formatting, you must save the card and view it in the **Details** or **Dashboard** view.
* If you use the PowerPoint plugin or export a card that contains HTML, it displays as the underlying Beast Mode calculation rather than the output it creates.
For more information about Summary Numbers, see our article about [Configuring Your Chart Summary Number](https://domo-support.domo.com/s/article/360043428753?language=en_US).
### Create Multiple Summary Numbers
You can use Beast Mode to display multiple summary statistics for a card. This gives viewers a better sense of the story the card is trying to convey.
The essential function to use in your Beast Mode calculation is `concat()`. You can add in text and any combination of metrics within the `concat()` statement.
**Note:** Creating a Summary Number this way bypasses standard formatting options, so you *must* include the formatting within the concat() statement. For example:
```
CONCAT(calculation, ‘Text’, [etc])
```
#### Example
The following Beast Mode calculation uses the concat() function to create a Summary Number that shows the number of records in which the **STATUS** field equals “COMPLETE” compared to the total number of records:
```
CONCAT(SUM(CASE WHEN STATUS = 'COMPLETE' THEN `Amount` ELSE 0 END), ' out of ', 'SUM(`Amount`))
```
So, if there are 65 completed records and 80 total records, the result of the above function is "65 of 80".
### Show Different Pictures in a Table Based on Changing Values
You can use HTML code in Table Cards and then use a case statement to display an image based on data values.
For example, the following Beast Mode calculation displays a different image in a table depending on whether "Profit" is positive or negative:
```
CASE WHEN `Profit` < 0 THEN
CONCAT('
**Note:**
* You cannot see the effects of the HTML coding while in the
**Edit** view of a card. To see the formatting, you must save the card and view it in the **Details** or **Dashboard** view.
* If you use the PowerPoint plugin or export a card that contains HTML, it displays as the underlying Beast Mode calculation rather than the output it creates.
For more information about Summary Numbers, see our article about [Configuring Your Chart Summary Number](https://domo-support.domo.com/s/article/360043428753?language=en_US).
### Create Multiple Summary Numbers
You can use Beast Mode to display multiple summary statistics for a card. This gives viewers a better sense of the story the card is trying to convey.
The essential function to use in your Beast Mode calculation is `concat()`. You can add in text and any combination of metrics within the `concat()` statement.
**Note:** Creating a Summary Number this way bypasses standard formatting options, so you *must* include the formatting within the concat() statement. For example:
```
CONCAT(calculation, ‘Text’, [etc])
```
#### Example
The following Beast Mode calculation uses the concat() function to create a Summary Number that shows the number of records in which the **STATUS** field equals “COMPLETE” compared to the total number of records:
```
CONCAT(SUM(CASE WHEN STATUS = 'COMPLETE' THEN `Amount` ELSE 0 END), ' out of ', 'SUM(`Amount`))
```
So, if there are 65 completed records and 80 total records, the result of the above function is "65 of 80".
### Show Different Pictures in a Table Based on Changing Values
You can use HTML code in Table Cards and then use a case statement to display an image based on data values.
For example, the following Beast Mode calculation displays a different image in a table depending on whether "Profit" is positive or negative:
```
CASE WHEN `Profit` < 0 THEN
CONCAT('
','

','