> ## Documentation Index
> Fetch the complete documentation index at: https://domoinc-openapi-sync-dataflows.mintlify.site/llms.txt
> Use this file to discover all available pages before exploring further.
# Powering a Visualization Card with Data
export const InlineImage = ({src, alt = '', height = '1.6em'}) => {
return  ;
};
## Intro
Before you can begin specifying the visual characteristics of your Visualization Card in the Analyzer, you must determine *how* to power it and *which* data you want to power it with. You can power a Card by doing any of the following:
* Creating a Visualization Card and then connecting a DataSet.
* Choosing your DataSet and then adding a Visualization Card to it.
* Uploading a *webform*, a Domo-powered spreadsheet you have filled with your own data. This is discussed in detail in Webforms Connector.
**Video - Building a Card from an Excel Spreadsheet**
## The Card -> DataSet method
With this method, you first locate the Page in Domo where you want your new Card to appear. You then specify the DataSet used to power the Card. After you power it with data, you can then determine the chart's visual characteristics as discussed in [Analyzer Overview](/s/article/360043428673).
**To build a Card using the Card -> DataSet method,**
1. On the Page where you want to create a Card, click the
icon in the upper right corner of the screen.
2. Click **Create new Card**.
A dialog appears with a number of upload options you can choose from.
**Tip:** You can also open this dialog from anywhere in Domo by selecting in the app toolbar and selecting **Card**.
3. Click **Visualization**.
4. (Conditional) Do one of the following:
* Use a DataSet that has already been uploaded to Domo by doing the following:
1. Click **Existing Data**.
A dialog appears in which you can choose a DataSet.
;
};
## Intro
Before you can begin specifying the visual characteristics of your Visualization Card in the Analyzer, you must determine *how* to power it and *which* data you want to power it with. You can power a Card by doing any of the following:
* Creating a Visualization Card and then connecting a DataSet.
* Choosing your DataSet and then adding a Visualization Card to it.
* Uploading a *webform*, a Domo-powered spreadsheet you have filled with your own data. This is discussed in detail in Webforms Connector.
**Video - Building a Card from an Excel Spreadsheet**
## The Card -> DataSet method
With this method, you first locate the Page in Domo where you want your new Card to appear. You then specify the DataSet used to power the Card. After you power it with data, you can then determine the chart's visual characteristics as discussed in [Analyzer Overview](/s/article/360043428673).
**To build a Card using the Card -> DataSet method,**
1. On the Page where you want to create a Card, click the
icon in the upper right corner of the screen.
2. Click **Create new Card**.
A dialog appears with a number of upload options you can choose from.
**Tip:** You can also open this dialog from anywhere in Domo by selecting in the app toolbar and selecting **Card**.
3. Click **Visualization**.
4. (Conditional) Do one of the following:
* Use a DataSet that has already been uploaded to Domo by doing the following:
1. Click **Existing Data**.
A dialog appears in which you can choose a DataSet.
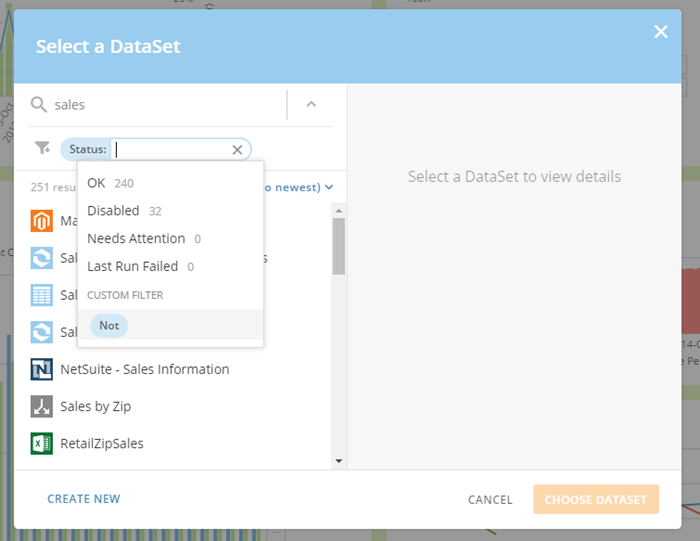 This dialog includes many options for locating your desired DataSet. In addition to being able to search by name, you can also apply various filters to your search. If you click the icon, a dialog appears with a number of selectable filters such as **Owned by**, **Created Date**, **Tag**, and so on. You can choose any of these filters then specify the criteria for the filter. For example, if you chose **Tag**, you would then be prompted to select the tag associated with your desired DataSet. You can also customize filters by applying operators. These differ between filters. Most filters include the **Not** operator so you can indicate that specified criteria are excluded from your filter. For example, you might build a filter in which the status is *not* disabled. Date-based filters include the **On**, **Not On**, **Before**, and **After** operators so you can narrow down when when a DataSet was created or last run. Number-based filters include **Equal To**, **Not Equal To**, **Less Than**, and **Greater Than** operators.
In the filter dialog, you can also choose from several quick filters by clicking **Favorite Filters**. These include **Recently run** (which defaults to 7 days), **Owned by you**, and **Needs attention**.
This dialog includes many options for locating your desired DataSet. In addition to being able to search by name, you can also apply various filters to your search. If you click the icon, a dialog appears with a number of selectable filters such as **Owned by**, **Created Date**, **Tag**, and so on. You can choose any of these filters then specify the criteria for the filter. For example, if you chose **Tag**, you would then be prompted to select the tag associated with your desired DataSet. You can also customize filters by applying operators. These differ between filters. Most filters include the **Not** operator so you can indicate that specified criteria are excluded from your filter. For example, you might build a filter in which the status is *not* disabled. Date-based filters include the **On**, **Not On**, **Before**, and **After** operators so you can narrow down when when a DataSet was created or last run. Number-based filters include **Equal To**, **Not Equal To**, **Less Than**, and **Greater Than** operators.
In the filter dialog, you can also choose from several quick filters by clicking **Favorite Filters**. These include **Recently run** (which defaults to 7 days), **Owned by you**, and **Needs attention**.
You can apply multiple filters to narrow down your results; for example, you might apply an **Owned by** filter specifying user "Kate Nickelby," a **Type** filter specifying "Adobe Analytics," and a **Status** filter specifying "Disabled."
Once you have your results set, you can change the sort by clicking **Created Date (oldest to newest** **)** and then choosing the desired sort method and direction.
You can add or manage DataSets in the Data Center. For more information, see [Adding a DataSet Using a Connector](/s/article/360042926274) and [Data Center Layout](https://domo-support.domo.com/s/article/360047553253?language=en_US).
2. Select the desired DataSet.
You can search for a DataSet by name or filter the DataSets in the list by type or user.
* Use a Microsoft Excel spreadsheet or CSV file as your DataSet by doing the following:
1. Click **Spreadsheet upload**.
2. Specify the details of your Microsoft Excel spreadsheet or CSV file upload by following the instructions in
[File Upload Connector](/s/article/360043436573 "File Upload Connector").
* Connect to live data not yet in Domo by doing the following:
1. Click **Connect live data**.
2. Select the appropriate Connector and follow the steps to
[Add a DataSet Using a Data Connector](/s/article/360042926274).
5. Specify the details of your chart as desired in the Analyzer.
6. Click **Save & Finish**.
Your new Card is created and added to the Page.
## The DataSet -> Card method
With this method, you go into the Data Center and locate the DataSet you want to build a Card from. After you select a DataSet, you can then determine the chart's visual characteristics as discussed in [Analyzer Overview](/s/article/360043428673 "KPI Card Building Part 2: The Card Builder"). When you add a Card in this way, it appears on your Overview Page by default until you move it to another Page.
**To build a Card using the DataSet -> Card method,**
1. Select **Data** in the toolbar at the top of the screen.
2. Click
in the left-hand navigation pane to access existing DataSets.
3. Locate and click the DataSet you want to add the Card to.
For more information about the filtering and navigation options in the Data Center, see [Data Center Layout](https://domo-support.domo.com/s/article/360047553253?language=en_US).
4. Click the **Cards** tab.
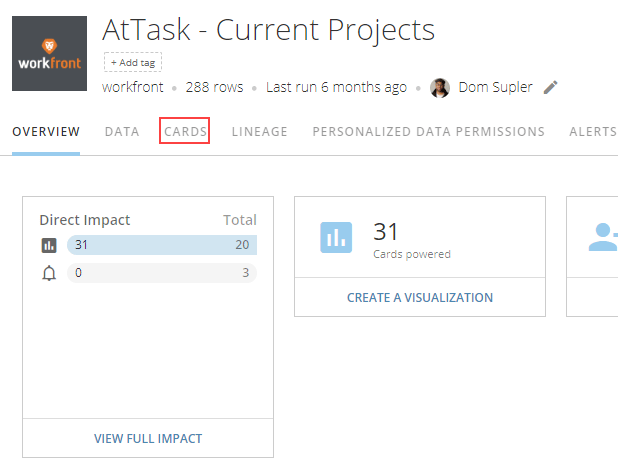 5. Click **Add Card**.
6. Specify the details of your chart.
When you save the Card, it is added to the Overview Page. You can then move it to another Page if you want. For more information, see [Adding a DataSet Using a Connector](/s/article/360042926274).
**Note:** If you upload a Card with a large amount of data, a message may display reading "WARNING! Not all of the data is shown." This indicates that all of the data *is* present, but for visualization purposes, the visualization has been truncated.
5. Click **Add Card**.
6. Specify the details of your chart.
When you save the Card, it is added to the Overview Page. You can then move it to another Page if you want. For more information, see [Adding a DataSet Using a Connector](/s/article/360042926274).
**Note:** If you upload a Card with a large amount of data, a message may display reading "WARNING! Not all of the data is shown." This indicates that all of the data *is* present, but for visualization purposes, the visualization has been truncated.