> ## Documentation Index
> Fetch the complete documentation index at: https://domoinc-openapi-sync-dataflows.mintlify.site/llms.txt
> Use this file to discover all available pages before exploring further.

# Properties for Maps

## Intro

Refer to this topic to find information about chart properties available for Maps and Heat Maps, such as those for configuring color themes, ranges, symbol settings, legends, and so on.

**Video - Map Charts**

<iframe allowfullscreen="" frameborder="0" height="315" src="//www.youtube-nocookie.com/embed/ahzrs6FI3uk" width="560" />

## "General" Properties

The properties in the following table are found in the **General** category in Chart Properties.

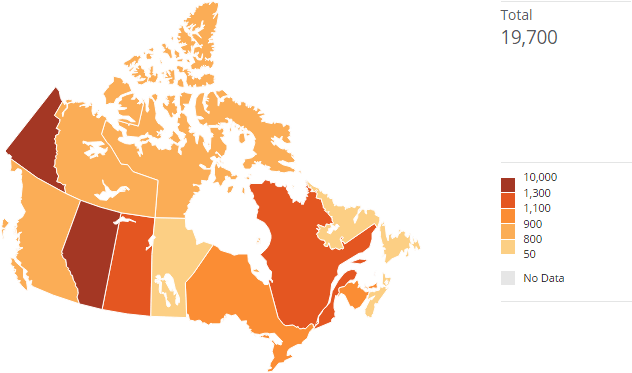
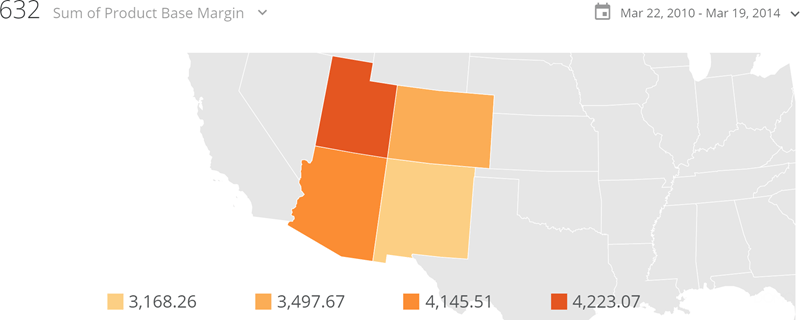
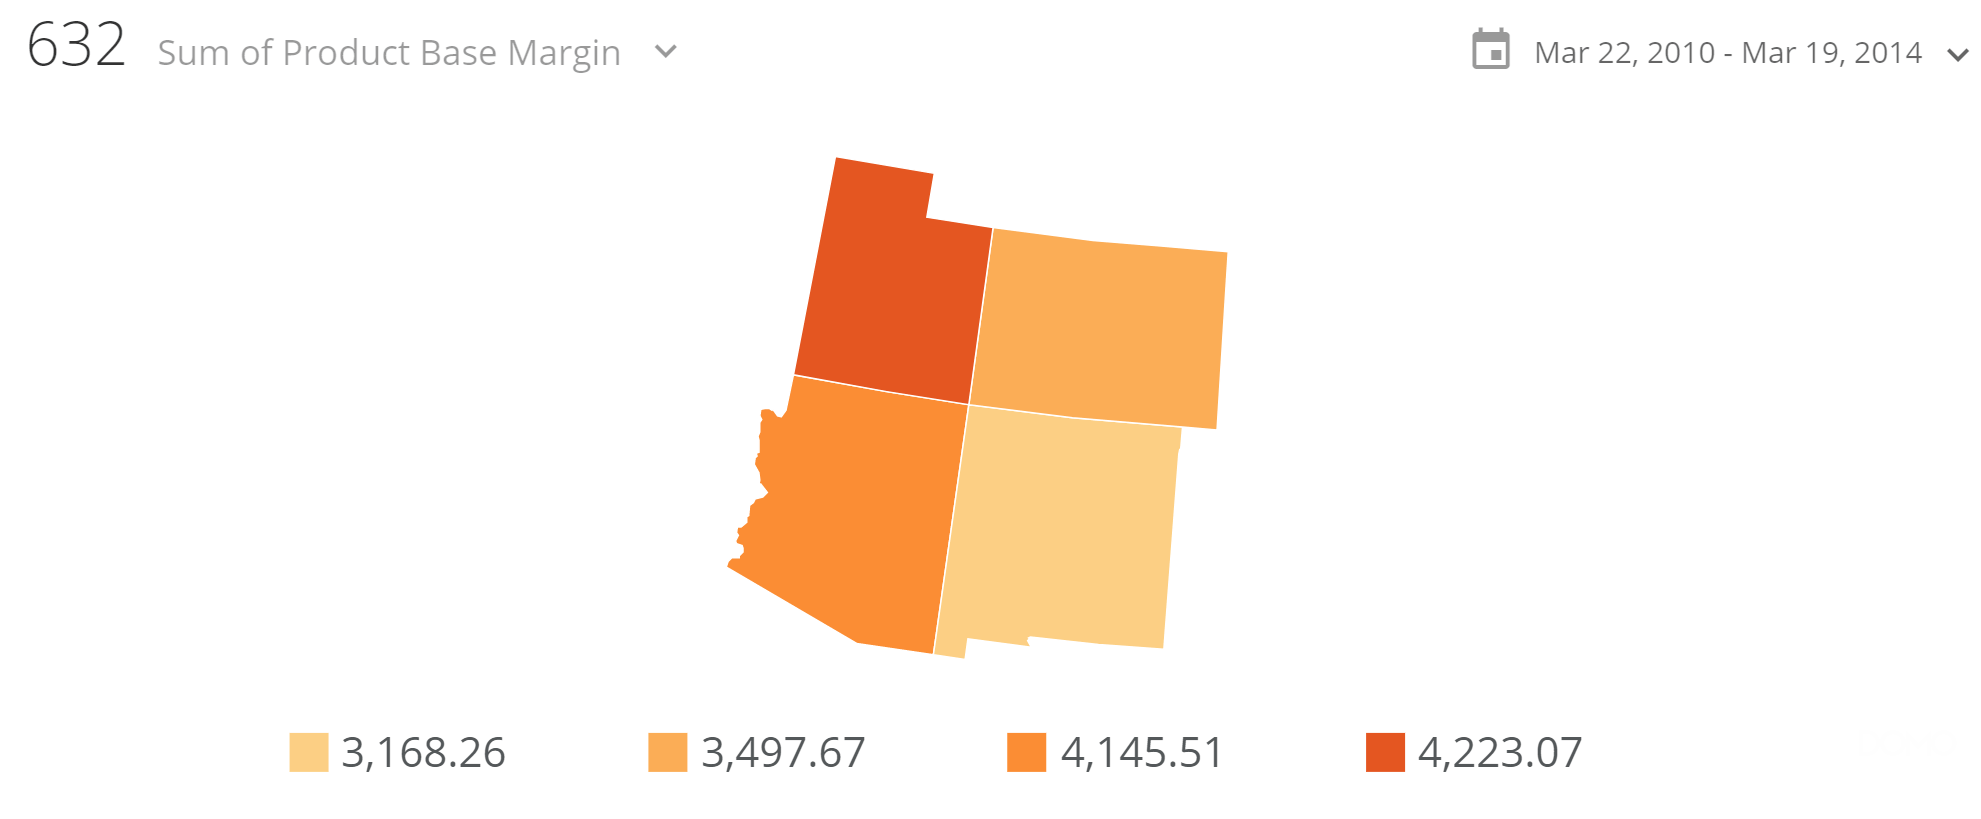
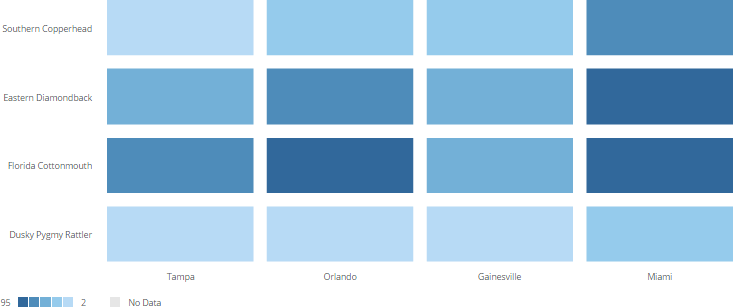
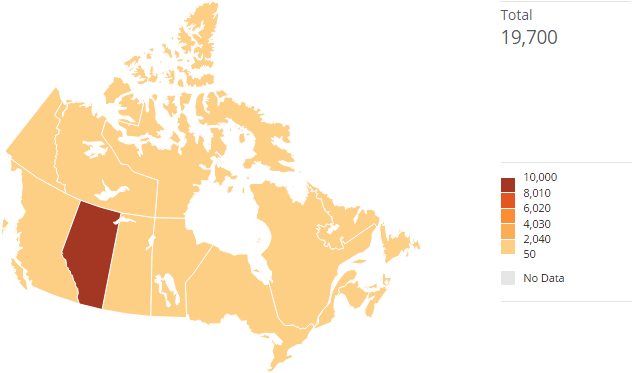
<table class="mt-responsive-table" data-aura-rendered-by="33:209;a"><thead><tr><th colspan="1" rowspan="1"><p> Option </p></th><th colspan="1" rowspan="1"><p> Description </p></th><th colspan="1" rowspan="1"><p> Examples </p></th></tr></thead><tbody><tr><td colspan="1" rowspan="1"><p> Balanced Distribution </p></td><td colspan="1" rowspan="1"><p> Adjusts maps and Heat Maps to include a balanced number of items within each range. This is helpful in spreading values across all ranges when your data contains extreme outliers. In the pair of maps shown in the screenshots at right, the values of most of the Canadian provinces are in the range of 100 to 1500. The outlier, Alberta, has a value of 10,000. <b> Balanced Distribution </b> has not been turned on in the top map, so a skewed version of the data is shown—Alberta appears dark and all of the other provinces appear light. In the bottom map, the user has turned on <b> Balanced Distribution </b>, so Alberta is grouped into the same range as the province with the next highest value. </p></td><td colspan="1" rowspan="1"><p><img alt="balanced_distribution_off.png" src="https://mintcdn.com/domoinc-openapi-sync-dataflows/D4XP-ZUu0hZKYNDT/images/kb/ka05w00000123lV-00N5w00000Ri7BU-0EM5w000005vP1n.png?fit=max&auto=format&n=D4XP-ZUu0hZKYNDT&q=85&s=df099a8007a5e27fe8537a20ea390b95" width="632" height="373" data-path="images/kb/ka05w00000123lV-00N5w00000Ri7BU-0EM5w000005vP1n.png" /></p><p><img alt="balanced_distribution_on.png" src="https://mintcdn.com/domoinc-openapi-sync-dataflows/D4XP-ZUu0hZKYNDT/images/kb/ka05w00000123lV-00N5w00000Ri7BU-0EM5w000005vP1u.png?fit=max&auto=format&n=D4XP-ZUu0hZKYNDT&q=85&s=e0bc28e083250335bb1c5b2c830f9513" width="632" height="373" data-path="images/kb/ka05w00000123lV-00N5w00000Ri7BU-0EM5w000005vP1u.png" /></p></td></tr><tr><td colspan="1" rowspan="1"> Auto Zoom to Data </td><td colspan="1" rowspan="1"> Zooms in on the region of your map with data. In the example at right, the only states with data are Utah, Arizona, Colorado, and New Mexico, so the map zooms on them automatically. This option will not work if all of the regions in your map with data are not adjacent. For example, if the map at right showed Oregon as having data, the auto-zoom would not work because Oregon is not adjacent to any of the other states with data. </td><td colspan="1" rowspan="1"><img alt="map_auto_zoom_to_data.png" src="https://mintcdn.com/domoinc-openapi-sync-dataflows/D4XP-ZUu0hZKYNDT/images/kb/ka05w00000123lV-00N5w00000Ri7BU-0EM5w000005vP28.png?fit=max&auto=format&n=D4XP-ZUu0hZKYNDT&q=85&s=7999e8b835b7c9ffa8f769f7551a889e" width="800" height="320" data-path="images/kb/ka05w00000123lV-00N5w00000Ri7BU-0EM5w000005vP28.png" /></td></tr><tr><td colspan="1" rowspan="1"> Hide No Data Items </td><td colspan="1" rowspan="1"> Hides all items in your map without data. In the example at right, the only states with data are Utah, Arizona, Colorado, and New Mexico, so the map hides all other states. Unlike the "Auto Zoom to Data" property, this will work even if there are regions not adjacent to other regions. </td><td colspan="1" rowspan="1"><img alt="map_hide_no_data_items.png" src="https://mintcdn.com/domoinc-openapi-sync-dataflows/D4XP-ZUu0hZKYNDT/images/kb/ka05w00000123lV-00N5w00000Ri7BU-0EM5w000005vP1s.png?fit=max&auto=format&n=D4XP-ZUu0hZKYNDT&q=85&s=e6fbf0d9c9ec0dbf704eb1551bf00535" width="1981" height="819" data-path="images/kb/ka05w00000123lV-00N5w00000Ri7BU-0EM5w000005vP1s.png" /></td></tr><tr><td colspan="1" rowspan="1"> Hide Abbreviated Legend </td><td colspan="1" rowspan="1"> Hides the legend shown at the bottom of maps in some views. </td><td class="mt-align-center" colspan="1" rowspan="1"> — </td></tr><tr><td colspan="1" rowspan="1"><p> Inner Margin </p></td><td colspan="1" rowspan="1"><p> Determines the amount of space, in pixels, that separates the cells in a Heat Map. The example shows a heat map with margins set to <code> 8 </code>. </p></td><td colspan="1" rowspan="1"><p><img alt="heatmap_margins.png" src="https://mintcdn.com/domoinc-openapi-sync-dataflows/D4XP-ZUu0hZKYNDT/images/kb/ka05w00000123lV-00N5w00000Ri7BU-0EM5w000005vP20.png?fit=max&auto=format&n=D4XP-ZUu0hZKYNDT&q=85&s=a160e8f76f3e82e3670c45cbca9b9501" width="733" height="307" data-path="images/kb/ka05w00000123lV-00N5w00000Ri7BU-0EM5w000005vP20.png" /></p></td></tr><tr><td colspan="1" rowspan="1"><p> Override Maximum Value </p></td><td colspan="1" rowspan="1"><p> Lets you specify the maximum value for a map or Heat Map. </p><p> By default, Domo uses the highest value in the DataSet as the maximum value. However, by setting this property you can override this value. </p></td><td colspan="1" rowspan="1"><p class="mt-align-center"> — </p></td></tr></tbody></table>
## "Diverging" Properties

The properties in the following table are found in the **Diverging** category in Chart Properties.

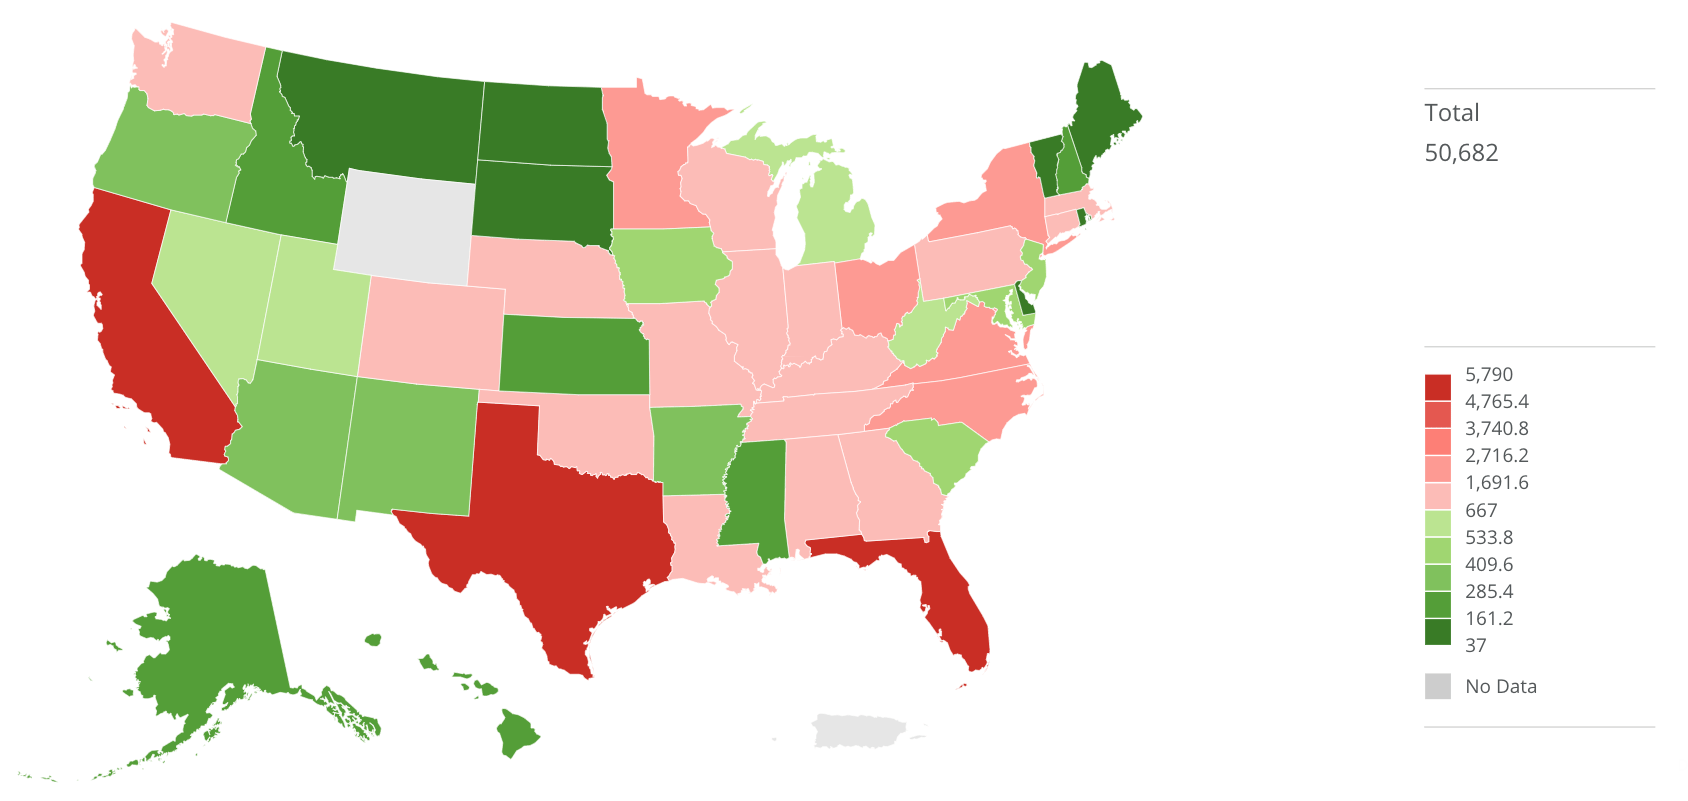
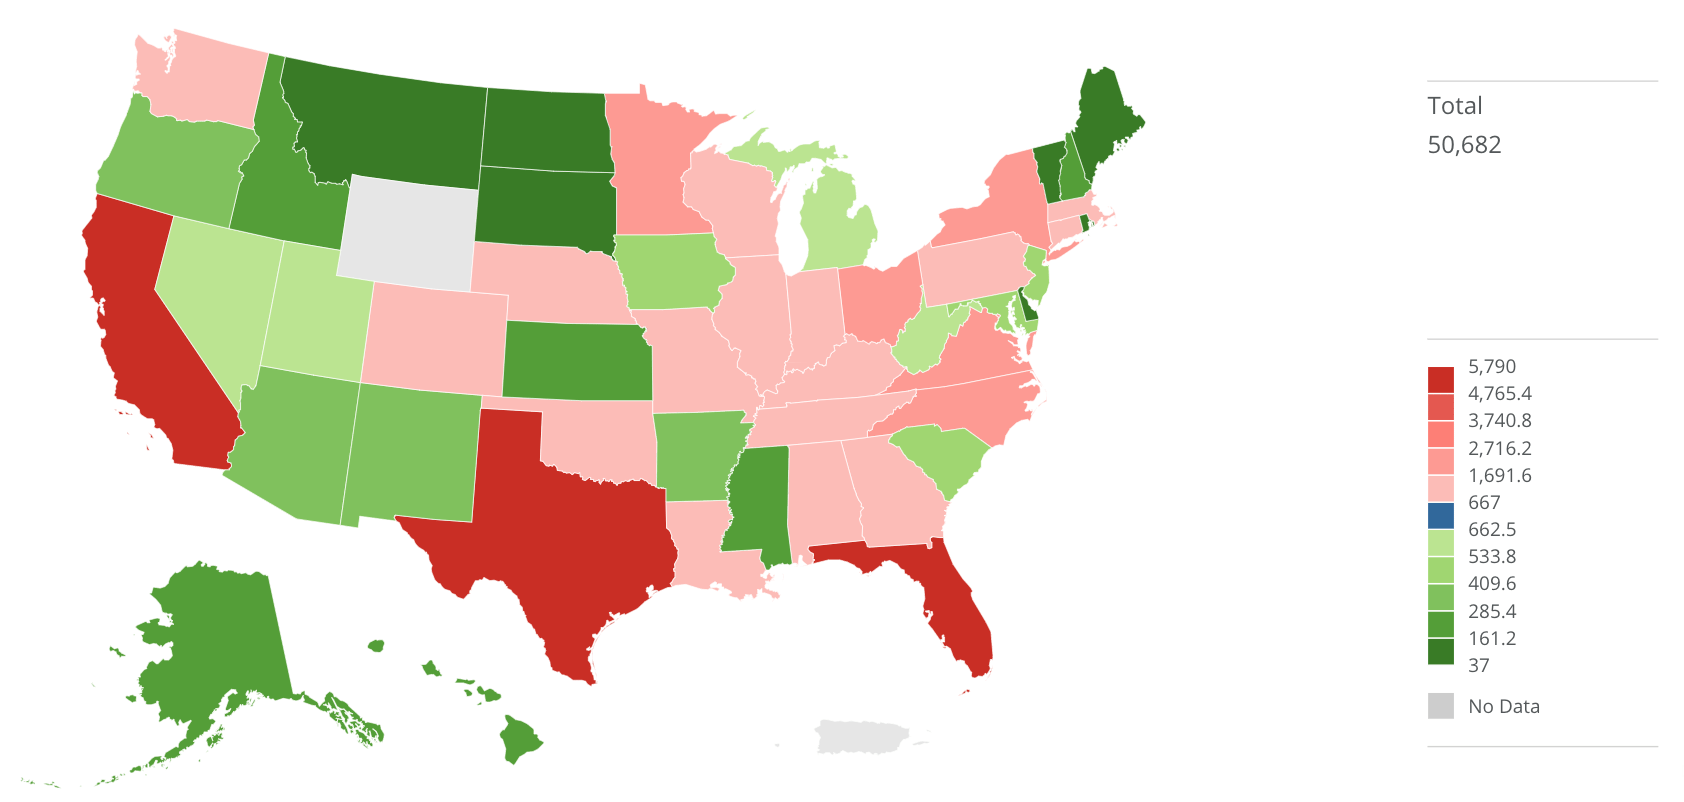
<table class="mt-responsive-table" data-aura-rendered-by="33:209;a"><thead><tr><th colspan="1" rowspan="1"> Option </th><th colspan="1" rowspan="1"> Description </th><th colspan="1" rowspan="1"> Examples </th></tr></thead><tbody><tr><td colspan="1" rowspan="1"> Show </td><td colspan="1" rowspan="1"> When selected, the map will be shown as a diverging map with 2 sets of color ranges, one above and one below the midpoint. </td><td class="mt-align-center" colspan="1" rowspan="1"><img alt="No_Midpoint.png" src="https://mintcdn.com/domoinc-openapi-sync-dataflows/D4XP-ZUu0hZKYNDT/images/kb/ka05w00000123lV-00N5w00000Ri7BU-0EM5w000005vP1v.png?fit=max&auto=format&n=D4XP-ZUu0hZKYNDT&q=85&s=408cf768b7e4bb8290c86ddbd584227f" width="1688" height="801" data-path="images/kb/ka05w00000123lV-00N5w00000Ri7BU-0EM5w000005vP1v.png" /></td></tr><tr><td colspan="1" rowspan="1"> Number of Ranges </td><td colspan="1" rowspan="1"> The number of ranges to be displayed either above or below the midpoint. (Maximum is 5) </td><td class="mt-align-center wysiwyg-text-align-center" colspan="1" rowspan="1"> — </td></tr><tr><td colspan="1" rowspan="1"> Midpoint Value Type </td><td colspan="1" rowspan="1"> The type or value to be used as the midpoint. The default value is the median value. </td><td class="mt-align-center wysiwyg-text-align-center" colspan="1" rowspan="1"> — </td></tr><tr><td colspan="1" rowspan="1"> Midpoint Value </td><td colspan="1" rowspan="1"> The value used as the midpoint when the value type is set to "Manual". </td><td class="mt-align-center wysiwyg-text-align-center" colspan="1" rowspan="1"> — </td></tr><tr><td colspan="1" rowspan="1"> Show Midpoint Range </td><td colspan="1" rowspan="1"> When set, a range will be displayed for the midpoint value in the legend and chart. </td><td class="mt-align-center wysiwyg-text-align-center" colspan="1" rowspan="1"><img alt="Midpoint_Range_Map.png" src="https://mintcdn.com/domoinc-openapi-sync-dataflows/D4XP-ZUu0hZKYNDT/images/kb/ka05w00000123lV-00N5w00000Ri7BU-0EM5w000005vP1z.png?fit=max&auto=format&n=D4XP-ZUu0hZKYNDT&q=85&s=f434774a39128fcca88097bd6df7edd7" width="1684" height="802" data-path="images/kb/ka05w00000123lV-00N5w00000Ri7BU-0EM5w000005vP1z.png" /></td></tr><tr><td colspan="1" rowspan="1"> Midpoint Range Color </td><td colspan="1" rowspan="1"> The color to be used for the range representing the midpoint. </td><td class="mt-align-center wysiwyg-text-align-center" colspan="1" rowspan="1"> — </td></tr><tr><td colspan="1" rowspan="1"> Upper Color Theme </td><td colspan="1" rowspan="1"> The colors used for ranges above the midpoint. </td><td class="mt-align-center wysiwyg-text-align-center" colspan="1" rowspan="1"> — </td></tr><tr><td colspan="1" rowspan="1"> Lower Color Theme </td><td colspan="1" rowspan="1"> The color theme used for the colors below the midpoint. </td><td class="mt-align-center wysiwyg-text-align-center" colspan="1" rowspan="1"> — </td></tr></tbody></table>

## "Hover Legend" Properties

The properties in the following table are found in the **Hover Legend** category in Chart Properties.

<table class="mt-responsive-table" data-aura-rendered-by="33:209;a"><thead><tr><th class="mt-column-width-15" colspan="1" rowspan="1"><p> Option </p></th><th class="mt-column-width-35" colspan="1" rowspan="1"><p> Description </p></th><th class="mt-column-width-20" colspan="1" rowspan="1"><p> Examples </p></th></tr></thead><tbody><tr><td class="mt-column-width-15" colspan="1" rowspan="1"><p> Hide Legend </p></td><td class="mt-column-width-35" colspan="1" rowspan="1"><p> Hides the legend that normally appears on the right side of a map in the Details view. </p></td><td class="mt-column-width-20" colspan="1" rowspan="1"><p> — </p></td></tr><tr><td class="mt-column-width-15" colspan="1" rowspan="1"> Hide Total </td><td class="mt-column-width-35" colspan="1" rowspan="1"> Hides the "Total" section of the legend that appears on the right side of a map in the Details view. The example shows a map in which this has been done. </td><td class="mt-column-width-20" colspan="1" rowspan="1"><img alt="map_data_labels_hide_total.png" src="https://mintcdn.com/domoinc-openapi-sync-dataflows/D4XP-ZUu0hZKYNDT/images/kb/ka05w00000123lV-00N5w00000Ri7BU-0EM5w000005vP24.png?fit=max&auto=format&n=D4XP-ZUu0hZKYNDT&q=85&s=41749557f65727262304bc844950c7d1" width="800" height="494" data-path="images/kb/ka05w00000123lV-00N5w00000Ri7BU-0EM5w000005vP24.png" /></td></tr><tr><td class="mt-column-width-15" colspan="1" rowspan="1"> Hide Values </td><td class="mt-column-width-35" colspan="1" rowspan="1"> Hides the value and percent of total value in the legend that appears on the right side of a map in the Details view. The example shows a map in which this has been done. </td><td class="mt-column-width-20" colspan="1" rowspan="1"><img alt="map_data_labels_hide_values.png" src="https://mintcdn.com/domoinc-openapi-sync-dataflows/D4XP-ZUu0hZKYNDT/images/kb/ka05w00000123lV-00N5w00000Ri7BU-0EM5w000005vP1x.png?fit=max&auto=format&n=D4XP-ZUu0hZKYNDT&q=85&s=78805cdf16870e8f7b49ca1e90e966ac" width="800" height="504" data-path="images/kb/ka05w00000123lV-00N5w00000Ri7BU-0EM5w000005vP1x.png" /></td></tr></tbody></table>

## "Data Label Settings" Properties

The properties in the following table are found in the **Data Label Settings** category in Chart Properties.

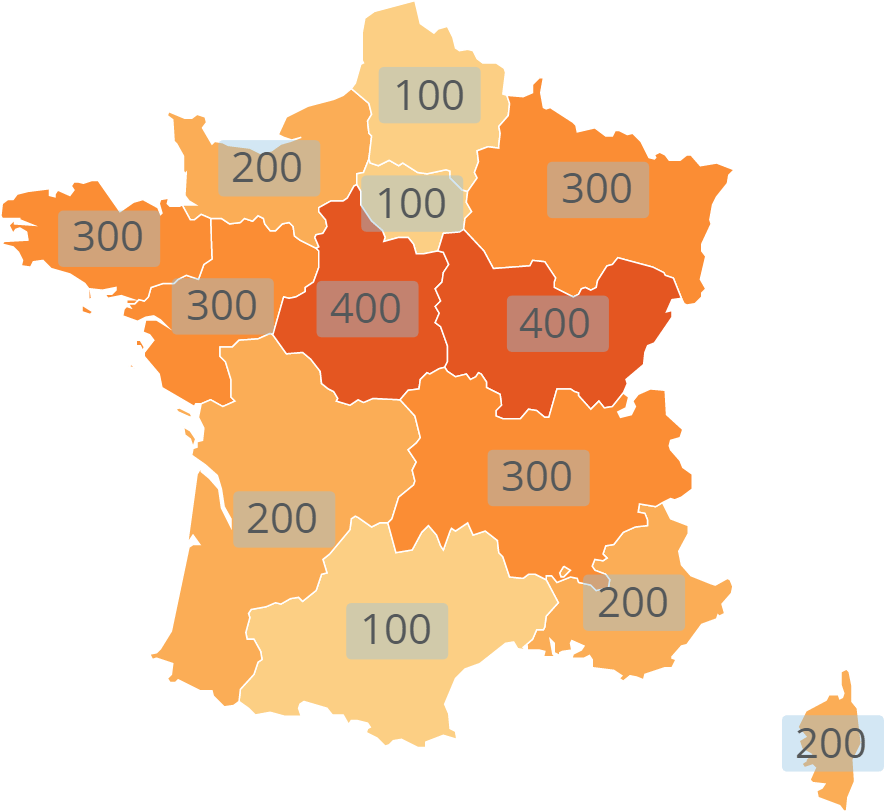
<table class="mt-responsive-table" data-aura-rendered-by="33:209;a"><thead><tr><th class="mt-column-width-15" colspan="1" rowspan="1"><p> Option </p></th><th class="mt-column-width-35" colspan="1" rowspan="1"><p> Description </p></th><th class="mt-column-width-20" colspan="1" rowspan="1"><p> Examples </p></th></tr><tr><td class="mt-column-width-15" colspan="1" rowspan="1"><p> Text </p></td><td class="mt-column-width-35" colspan="1" rowspan="1"><p> Specifies text for the data labels. This property is the "on switch" for data labels—you must specify text for them to appear. </p></td><td class="mt-column-width-20" colspan="1" rowspan="1"><p> — </p></td></tr><tr><td class="mt-column-width-15" colspan="1" rowspan="1"> Font Size </td><td class="mt-column-width-35" colspan="1" rowspan="1"><p> Allows you to increase or decrease the data label font size. The "Default" font size falls between the largest and second-smallest font sizes. For more information, see <a href="/s/article/360042925214" target="_self" title="Changing the Font Size in Your Chart"> Changing the Font Size in Your Chart </a>. </p></td><td class="mt-column-width-20" colspan="1" rowspan="1"> — </td></tr><tr><td class="mt-column-width-15" colspan="1" rowspan="1"> Text Color </td><td class="mt-column-width-35" colspan="1" rowspan="1"> Lets you determine the text color for your map data labels. If you select "Default," the color will be automatically determined based on the background color. This is shown in the example at right, in which the data labels on darker areas appear white and those on lighter areas appear dark red. </td><td class="mt-column-width-20" colspan="1" rowspan="1"><img alt="map_data_labels_text_color.png" src="https://mintcdn.com/domoinc-openapi-sync-dataflows/D4XP-ZUu0hZKYNDT/images/kb/ka05w00000123lV-00N5w00000Ri7BU-0EM5w000005vP1o.png?fit=max&auto=format&n=D4XP-ZUu0hZKYNDT&q=85&s=1e13fd5cf9f2969e3b102ec76f87a4ae" width="800" height="749" data-path="images/kb/ka05w00000123lV-00N5w00000Ri7BU-0EM5w000005vP1o.png" /></td></tr><tr><td class="mt-column-width-15" colspan="1" rowspan="1"> Value Abbreviation </td><td class="mt-column-width-35" colspan="1" rowspan="1"> Determines whether data label values are abbreviated (the default being 3 significant digits) or not. </td><td class="mt-column-width-20" colspan="1" rowspan="1"> — </td></tr><tr><td class="mt-column-width-15" colspan="1" rowspan="1"><p> Fill </p></td><td class="mt-column-width-35" colspan="1" rowspan="1"><p> Lets you add a colored fill to your map data labels. The example at right shows a chart in which a pale blue fill color with 60% transparency has been added. </p></td><td class="mt-column-width-20" colspan="1" rowspan="1"><p><img alt="map_data_labels_fill.png" src="https://mintcdn.com/domoinc-openapi-sync-dataflows/U1MglXZKeJZebGlP/images/kb/ka05w00000123lV-00N5w00000Ri7BU-0EM5w000005vP1l.png?fit=max&auto=format&n=U1MglXZKeJZebGlP&q=85&s=37d6316fb84225768a7b15c136c49387" width="884" height="811" data-path="images/kb/ka05w00000123lV-00N5w00000Ri7BU-0EM5w000005vP1l.png" /></p></td></tr><tr><td class="mt-column-width-15" colspan="1" rowspan="1"><p> Fill Color </p></td><td class="mt-column-width-35" colspan="1" rowspan="1"><p> Lets you specify the color for the fill in your map data labels. This property is only available when you check the <b> Fill </b> box. </p></td><td class="mt-column-width-20" colspan="1" rowspan="1"><p> — </p></td></tr><tr><td class="mt-column-width-15" colspan="1" rowspan="1"><p> Fill Transparency Percent </p></td><td class="mt-column-width-35" colspan="1" rowspan="1"><p> Lets you specify the fill transparency for map data labels. You can specify any number between 0 and 100, in which 0 is completely opaque and 100 is completely transparent. This property is only available when you check the <b> Fill </b> box. </p></td><td class="mt-column-width-20" colspan="1" rowspan="1"><p> — </p></td></tr></thead></table>

## "Hover Text" Properties

The properties in the following table are found in the **Hover Text** category in Chart Properties.

<table class="mt-responsive-table" data-aura-rendered-by="33:209;a"><thead><tr><th class="mt-column-width-15" colspan="1" rowspan="1"><p> Option </p></th><th class="mt-column-width-35" colspan="1" rowspan="1"><p> Description </p></th><th class="mt-column-width-20" colspan="1" rowspan="1"><p> Examples </p></th></tr></thead><tbody><tr><td class="mt-column-width-15" colspan="1" rowspan="1"><p> Hover Text </p></td><td class="mt-column-width-35" colspan="1" rowspan="1"><p> Lets you set the text that appears in map hovers. A variety of macros for showing map values in your hovers is available. For more information and a list of available macros, see <a href="/s/article/360043429693" target="_self" title="Formatting Data Label and Hover Text in Your Chart"> Formatting Data Label and Hover Text in Your Chart </a>. </p></td><td class="mt-column-width-20" colspan="1" rowspan="1"><p> — </p></td></tr><tr><td class="mt-column-width-15" colspan="1" rowspan="1"> Always Show Over Map </td><td class="mt-column-width-35" colspan="1" rowspan="1"> Specifies whether hover text specified using the <b> Hover Text </b> option is turned on for your chart. </td><td class="mt-column-width-20" colspan="1" rowspan="1"> — </td></tr></tbody></table>

## "Values" Properties

The properties in the following table are found in the **Values** category in Chart Properties.

<table class="mt-responsive-table" data-aura-rendered-by="33:209;a"><thead><tr><th class="mt-column-width-15" colspan="1" rowspan="1"><p> Option </p></th><th class="mt-column-width-35" colspan="1" rowspan="1"><p> Description </p></th><th class="mt-column-width-20" colspan="1" rowspan="1"><p> Examples </p></th></tr></thead><tbody><tr><td class="mt-column-width-15" colspan="1" rowspan="1"><p> Label Format </p></td><td class="mt-column-width-35" colspan="1" rowspan="1"><p> Determines the general number format for hover text and legend items in most maps. <b> Number </b> is the default format; when you select this, numbers appear without currency or percentage symbols. Selecting <b> Currency </b> or <b> Percentage </b> affixes a "\$" or "%," respectively, to numbers in your hover text and legend items. For currency numbers, you can change the default symbol by specifying the desired symbol in the <b> Currency Symbol </b> field (which is found under <b> Number Format </b> ). You can also specify whether currency symbols appear before or after numbers in the <b> Currency Symbol Position </b> menu (they appear before numbers by default). </p></td><td class="mt-column-width-20" colspan="1" rowspan="1"><p> — </p></td></tr><tr><td class="mt-column-width-15" colspan="1" rowspan="1"><p> Decimal Places </p></td><td class="mt-column-width-35" colspan="1" rowspan="1"><p> Determines the number of decimal places used in decimal values in hover text and legend items in most maps. You can choose from <b> Default </b>, <b> None </b>, and options for numbers of decimal places (from ".0" to ".00000"). By default, Domo automatically determines the optimal number of decimal places for each number in the chart. When you select <b> None </b>, all values are rounded to the nearest whole number. </p></td><td class="mt-column-width-20" colspan="1" rowspan="1"><p> — </p></td></tr><tr><td class="mt-column-width-15" colspan="1" rowspan="1"><p> Negative Numbers </p></td><td class="mt-column-width-35" colspan="1" rowspan="1"><p> Determines the format for negative numbers in hover text and legend items in most maps. If you select <b> -100 </b>, all negative numbers have a minus symbol affixed. If you select <b> (100) </b>, all negative numbers are enclosed in parentheses. </p></td><td class="mt-column-width-20" colspan="1" rowspan="1"><p> — </p></td></tr></tbody></table>

## "Theme" Properties

The properties in the following table are found in the **Theme** category in Chart Properties.

<table class="mt-responsive-table" data-aura-rendered-by="33:209;a"><thead><tr><th class="mt-column-width-15" colspan="1" rowspan="1"><p> Option </p></th><th class="mt-column-width-35" colspan="1" rowspan="1"><p> Description </p></th><th class="mt-column-width-15" colspan="1" rowspan="1"><p> Examples </p></th></tr></thead><tbody><tr><td class="mt-column-width-15" colspan="1" rowspan="1"><p> Theme </p></td><td class="mt-column-width-35" colspan="1" rowspan="1"><p> Allows you to change the color theme for most maps as well as Heat Maps and calendars. For more information about setting colors, see <a href="/s/article/360043429653" target="_self" title="Changing the Default Colors in Your Chart"> Changing the Default Colors in Your Chart </a>. </p></td><td class="mt-column-width-15" colspan="1" rowspan="1"><p> — </p></td></tr></tbody></table>

## "Symbols" Properties

The properties in the following table are found in the **Symbols** category in Chart Properties.

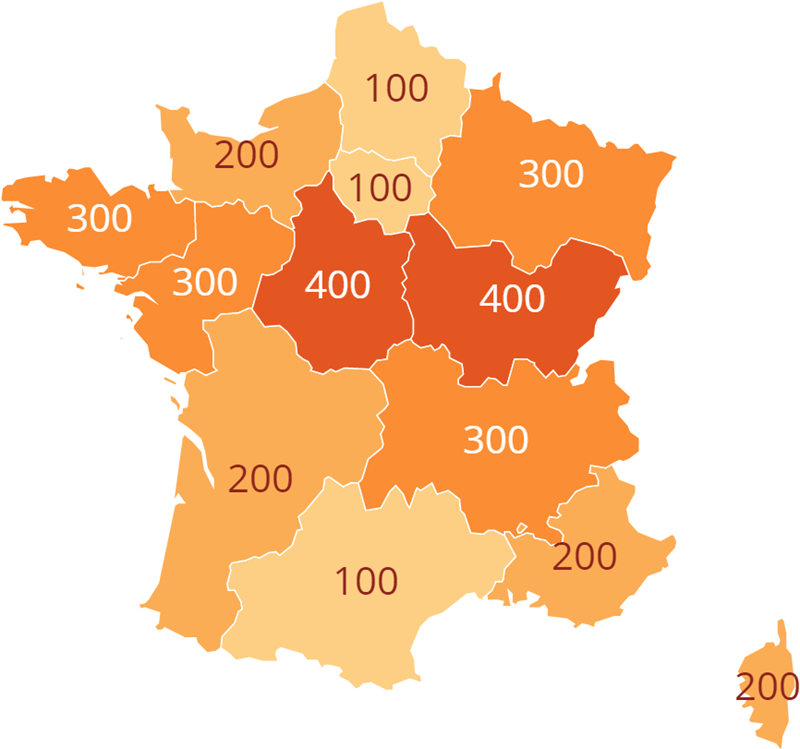
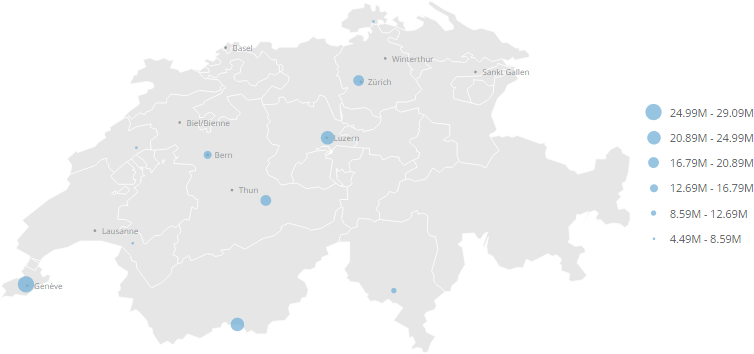
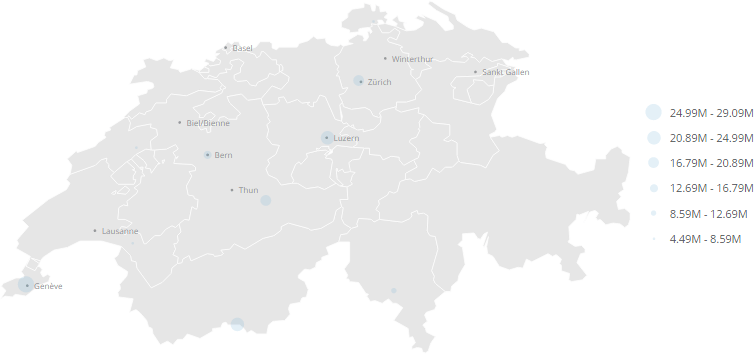
<table class="mt-responsive-table" data-aura-rendered-by="33:209;a"><thead><tr><th class="mt-column-width-15" colspan="1" rowspan="1"><p> Option </p></th><th class="mt-column-width-35" colspan="1" rowspan="1"><p> Description </p></th><th class="mt-column-width-15" colspan="1" rowspan="1"><p> Examples </p></th></tr></thead><tbody><tr><td class="mt-column-width-15" colspan="1" rowspan="1"><p> Symbol Color </p></td><td class="mt-column-width-35" colspan="1" rowspan="1"><p> Allows you to set the color for points in a latitude-longitude map. The default is orange. If your map contains a series column, colors are determined automatically—setting this property in this case has no effect. </p></td><td class="mt-column-width-15" colspan="1" rowspan="1"><p> — </p></td></tr><tr><td class="mt-column-width-15" colspan="1" rowspan="1"><p> Symbol Sizes </p></td><td class="mt-column-width-35" colspan="1" rowspan="1"><p> Determines the relative size for points in a latitude-longitude map. The default is medium. </p></td><td class="mt-column-width-15" colspan="1" rowspan="1"><p> — </p></td></tr><tr><td class="mt-column-width-15" colspan="1" rowspan="1"><p> Symbol Transparency </p></td><td class="mt-column-width-35" colspan="1" rowspan="1"><p> Determines the transparency for points in a latitude-longitude map. You can select any value from "none" (totally opaque) to 80% (almost transparent). The default is "none." In the first example at right, the transparency has been set to "none"; in the second example, it has been set to 80%. </p></td><td class="mt-column-width-15" colspan="1" rowspan="1"><p /><p><img alt="latlong_transparency_0.png" src="https://mintcdn.com/domoinc-openapi-sync-dataflows/D4XP-ZUu0hZKYNDT/images/kb/ka05w00000123lV-00N5w00000Ri7BU-0EM5w000005vP21.png?fit=max&auto=format&n=D4XP-ZUu0hZKYNDT&q=85&s=e7df35b6e5230158d8c4541b0716303b" width="754" height="354" data-path="images/kb/ka05w00000123lV-00N5w00000Ri7BU-0EM5w000005vP21.png" /></p><p><img alt="latlong_transparency_80.png" src="https://mintcdn.com/domoinc-openapi-sync-dataflows/D4XP-ZUu0hZKYNDT/images/kb/ka05w00000123lV-00N5w00000Ri7BU-0EM5w000005vP1y.png?fit=max&auto=format&n=D4XP-ZUu0hZKYNDT&q=85&s=50cd980be4cb183bed57049c665f2b33" width="754" height="354" data-path="images/kb/ka05w00000123lV-00N5w00000Ri7BU-0EM5w000005vP1y.png" /></p></td></tr></tbody></table>

## "Routes" Properties

The properties in the following table are found in the **Routes** category in Chart Properties.

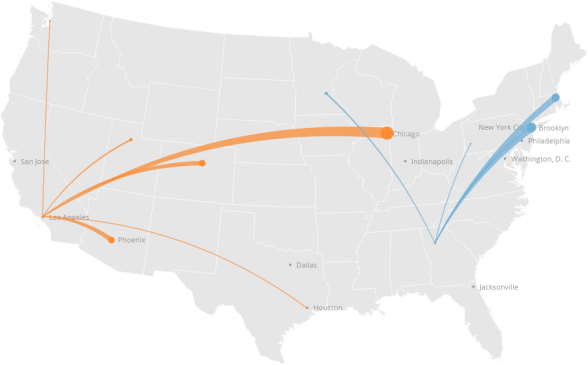
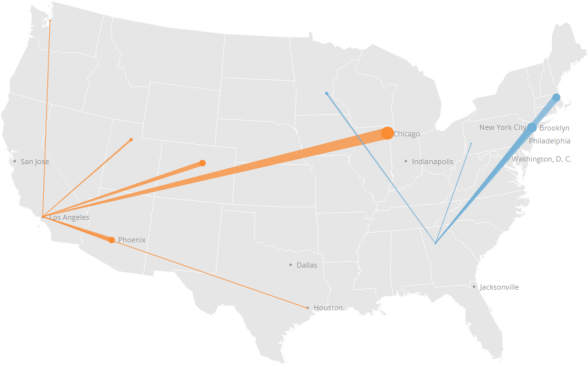
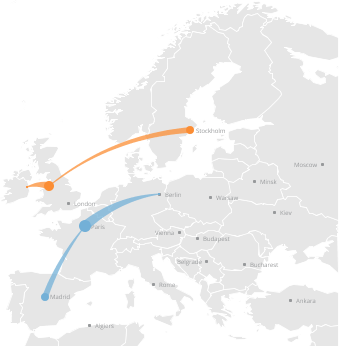
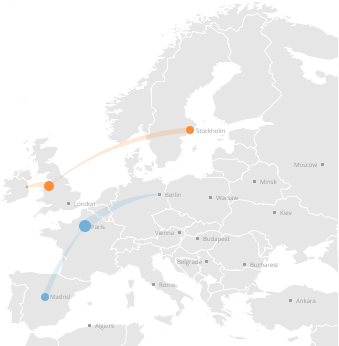
<table class="mt-responsive-table" data-aura-rendered-by="33:209;a"><thead><tr><th class="mt-column-width-15" colspan="1" rowspan="1"><p> Option </p></th><th class="mt-column-width-35" colspan="1" rowspan="1"><p> Description </p></th><th class="mt-column-width-15" colspan="1" rowspan="1"><p> Examples </p></th></tr></thead><tbody><tr><td class="mt-column-width-15" colspan="1" rowspan="1"><p> Symbol Color </p></td><td class="mt-column-width-35" colspan="1" rowspan="1"><p> Allows you to set the color for points and connection lines in a latitude-longitude route map. The default is orange. If your map contains a series column, colors are determined automatically—setting this property in this case has no effect. </p></td><td class="mt-column-width-15" colspan="1" rowspan="1"><p> — </p></td></tr><tr><td class="mt-column-width-15" colspan="1" rowspan="1"><p> Straight Routes </p></td><td class="mt-column-width-35" colspan="1" rowspan="1"><p> When checked, route lines in a latitude-longitude route map appear straight instead of curved (which is the default). In the first example at right, route lines appear curved; in the second example they appear straight. </p></td><td class="mt-column-width-15" colspan="1" rowspan="1"><p><img alt="straight_lines_off.png" src="https://mintcdn.com/domoinc-openapi-sync-dataflows/D4XP-ZUu0hZKYNDT/images/kb/ka05w00000123lV-00N5w00000Ri7BU-0EM5w000005vP29.png?fit=max&auto=format&n=D4XP-ZUu0hZKYNDT&q=85&s=b94a745b46d83a418468f85cbf446272" width="588" height="365" data-path="images/kb/ka05w00000123lV-00N5w00000Ri7BU-0EM5w000005vP29.png" /></p><p><img alt="straight_lines_on.png" src="https://mintcdn.com/domoinc-openapi-sync-dataflows/D4XP-ZUu0hZKYNDT/images/kb/ka05w00000123lV-00N5w00000Ri7BU-0EM5w000005vP26.png?fit=max&auto=format&n=D4XP-ZUu0hZKYNDT&q=85&s=acb628ab96231cf281186de6831d4925" width="588" height="365" data-path="images/kb/ka05w00000123lV-00N5w00000Ri7BU-0EM5w000005vP26.png" /></p></td></tr><tr><td class="mt-column-width-15" colspan="1" rowspan="1"><p> Symbol Transparency </p></td><td class="mt-column-width-35" colspan="1" rowspan="1"><p> Determines the transparency for connection lines in a latitude-longitude route map. You can select any value from "none" (totally opaque) to 80% (almost transparent). The default is "none." In the first example at right, the transparency has been set to "none"; in the second example, it has been set to 80%. </p></td><td class="mt-column-width-15" colspan="1" rowspan="1"><p><img alt="latlongroute_transparency_zero.png" src="https://mintcdn.com/domoinc-openapi-sync-dataflows/D4XP-ZUu0hZKYNDT/images/kb/ka05w00000123lV-00N5w00000Ri7BU-0EM5w000005vP1q.png?fit=max&auto=format&n=D4XP-ZUu0hZKYNDT&q=85&s=2b4347b6f1567eaea270c1cbfbb4f068" width="339" height="346" data-path="images/kb/ka05w00000123lV-00N5w00000Ri7BU-0EM5w000005vP1q.png" /></p><p><img alt="latlongroute_transparency_80.png" src="https://mintcdn.com/domoinc-openapi-sync-dataflows/D4XP-ZUu0hZKYNDT/images/kb/ka05w00000123lV-00N5w00000Ri7BU-0EM5w000005vP27.png?fit=max&auto=format&n=D4XP-ZUu0hZKYNDT&q=85&s=3924afd0f3ec6f7e1e8466893d451090" width="339" height="346" data-path="images/kb/ka05w00000123lV-00N5w00000Ri7BU-0EM5w000005vP27.png" /></p></td></tr></tbody></table>

## "Scale" Properties

The properties in the following table are found in the **Scale** category in Chart Properties.

<table class="mt-responsive-table" data-aura-rendered-by="33:209;a"><thead><tr><th class="mt-column-width-15" colspan="1" rowspan="1"><p> Option </p></th><th class="mt-column-width-35" colspan="1" rowspan="1"><p> Description </p></th><th class="mt-column-width-15" colspan="1" rowspan="1"><p> Examples </p></th></tr></thead><tbody><tr><td class="mt-column-width-15" colspan="1" rowspan="1"><p> Use Log Scale </p></td><td class="mt-column-width-35" colspan="1" rowspan="1"><p> Converts the scale in a latitude-longitude map, latitude-longitude route map, or Heat Map Table into a logarithmic scale. </p></td><td class="mt-column-width-15" colspan="1" rowspan="1"><p> — </p></td></tr><tr><td class="mt-column-width-15" colspan="1" rowspan="1"> Independent Column Ranges </td><td class="mt-column-width-35" colspan="1" rowspan="1"> Causes ranges to be applied separately to each column in a Heat Map Table. </td><td class="mt-column-width-15" colspan="1" rowspan="1"> — </td></tr></tbody></table>

## "Legend" Properties

The properties in the following table are found in the **Legend** category in Chart Properties.

<table class="mt-responsive-table" data-aura-rendered-by="33:209;a"><thead><tr><th class="mt-column-width-15" colspan="1" rowspan="1"><p> Option </p></th><th class="mt-column-width-35" colspan="1" rowspan="1"><p> Description </p></th><th class="mt-column-width-15" colspan="1" rowspan="1"><p> Examples </p></th></tr></thead><tbody><tr><td class="mt-column-width-15" colspan="1" rowspan="1"><p> Show Series Total in Legend As </p></td><td class="mt-column-width-35" colspan="1" rowspan="1"><p> Lets you choose whether the series totals in a latitude-longitude map are calculated as totals or averages or do not appear at all. The default is "Total." </p></td><td class="mt-column-width-15" colspan="1" rowspan="1"><p> — </p></td></tr></tbody></table>

## "Background" Properties

The properties in the following table are found in the **Background** category in Chart Properties.

<table class="mt-responsive-table" data-aura-rendered-by="33:209;a"><thead><tr><th class="mt-column-width-15" colspan="1" rowspan="1"><p> Option </p></th><th class="mt-column-width-35" colspan="1" rowspan="1"><p> Description </p></th><th class="mt-column-width-20" colspan="1" rowspan="1"><p> Examples </p></th></tr></thead><tbody><tr><td class="mt-column-width-15" colspan="1" rowspan="1"><p> Color </p></td><td class="mt-column-width-35" colspan="1" rowspan="1"><p> Lets you choose the lightness of the background for Latitude-Longitude and Latitude-Longitude Route Maps. The default is <b> Very Light </b>. The example shows a map in which the background lightness has been set to <b> Very Dark. </b></p></td><td class="mt-column-width-20" colspan="1" rowspan="1"><p><a href="https://domohelp.domo.com/@api/deki/files/697/latlong_background.png" target="_blank" title="/@api/deki/files/697/latlong_background.png"><img alt="latlong_background.png" src="https://mintcdn.com/domoinc-openapi-sync-dataflows/U1MglXZKeJZebGlP/images/kb/ka05w00000123lV-00N5w00000Ri7BU-0EM5w000005vP1m.png?fit=max&auto=format&n=U1MglXZKeJZebGlP&q=85&s=839c945832f21f286f2e1bfc9bfe1d43" width="715" height="377" data-path="images/kb/ka05w00000123lV-00N5w00000Ri7BU-0EM5w000005vP1m.png" /></a></p></td></tr></tbody></table>

## "Ranges" Properties

The properties in the following table are found in the **Ranges** category in Chart Properties.

<table class="mt-responsive-table" data-aura-rendered-by="33:209;a"><thead><tr><th class="mt-column-width-15" colspan="1" rowspan="1"><p> Option </p></th><th class="mt-column-width-35" colspan="1" rowspan="1"><p> Description </p></th><th class="mt-column-width-15" colspan="1" rowspan="1"><p> Examples </p></th></tr></thead><tbody><tr><td class="mt-column-width-15" colspan="1" rowspan="1"><p> Show Zero like No-data </p></td><td class="mt-column-width-35" colspan="1" rowspan="1"><p> Determines whether squares in a Heat Map with a value of 0 display in the same gray color as those squares with no data. </p></td><td class="mt-column-width-15" colspan="1" rowspan="1"><p> — </p></td></tr><tr><td class="mt-column-width-15" colspan="1" rowspan="1"><p> Range 1 Minimum Value...Range 9 Maximum Value </p></td><td class="mt-column-width-35" colspan="1" rowspan="1"><p> Let you customize the ranges in a Heat Map. For each of the nine ranges in the Heat Map, you can enter both a minimum and maximum value. You cannot change the number of ranges in a Heat Map, however. </p></td><td class="mt-column-width-15" colspan="1" rowspan="1"><p> — </p></td></tr><tr><td class="mt-column-width-15" colspan="1" rowspan="1"> Range 1 Color...Range 9 Color </td><td class="mt-column-width-35" colspan="1" rowspan="1"> Lets you specify colors for each range in a Heat Map. </td><td class="mt-column-width-15" colspan="1" rowspan="1"><a href="https://domohelp.domo.com/@api/deki/files/2730/heatmap_ranges_after.png" target="_blank" title="/@api/deki/files/2730/heatmap_ranges_after.png"><img alt="heatmap_ranges_after.png" src="https://mintcdn.com/domoinc-openapi-sync-dataflows/D4XP-ZUu0hZKYNDT/images/kb/ka05w00000123lV-00N5w00000Ri7BU-0EM5w000005vP1w.png?fit=max&auto=format&n=D4XP-ZUu0hZKYNDT&q=85&s=7d32262352ec90ad1d9fafdd5b0bc170" width="740" height="308" data-path="images/kb/ka05w00000123lV-00N5w00000Ri7BU-0EM5w000005vP1w.png" /></a></td></tr></tbody></table>