> ## Documentation Index
> Fetch the complete documentation index at: https://domoinc-openapi-sync-dataflows.mintlify.site/llms.txt
> Use this file to discover all available pages before exploring further.

# Gantt Chart

## Intro

Gantt charts are used to illustrate project schedules. Each task in a project is represented as a horizontal bar with a start date and end date. Tasks are represented along the vertical axis, and dates are represented along the horizontal axis. You can break tasks down by project, in which case each project is shown in a different color and appears as a legend item. However, projects are optional in Gantt charts.

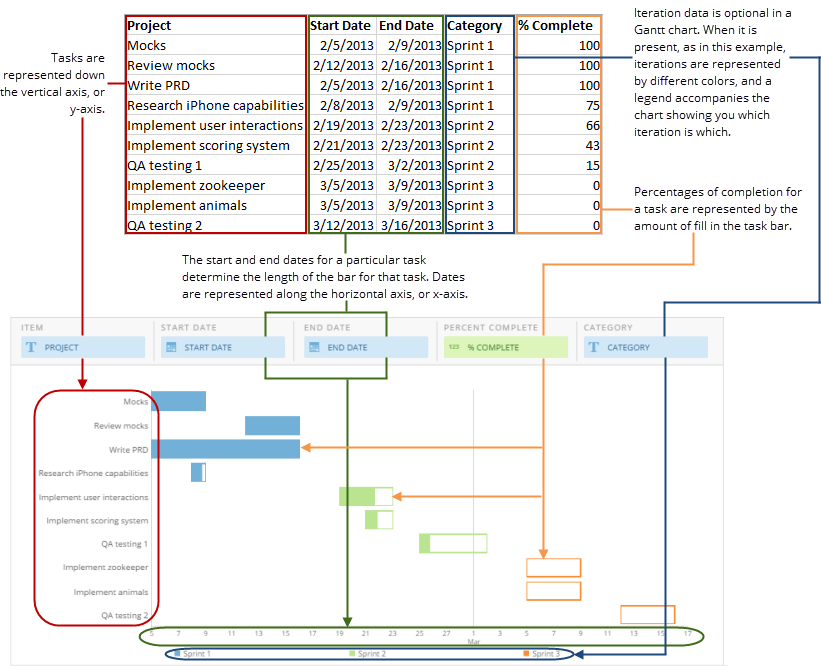
There are three types of Gantt charts in Domo—regular Gantt charts, Gantt Percent Complete charts, and Dependency Gantt charts. The difference between these is that Gantt Percent Complete charts show the completion percentage for each task bar. For any series, this percentage is represented by the amount of colored fill in the bar. The fill amount compared to the total length of the bar gives the viewer an idea of the percentage complete for that task. For example, if the fill for a series filled almost the entire bar, a viewer could deduce that the task was nearly complete. The [Dependency Gantt](/s/article/1500003419382) chart handles changes in dates for you and gives many new display options to communicate project timelines.

## Powering Gantt charts

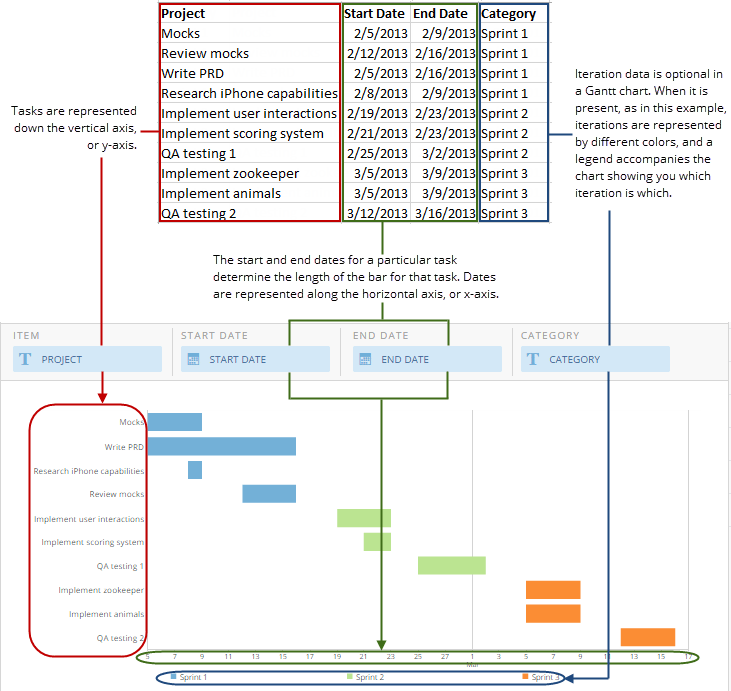
Standard Gantt charts require three columns or rows of data from your DataSet—one for tasks, one with start dates for each task, and one for end dates for each task. Percent Complete Gantt charts require all of these as well as a fourth column containing percent complete values for each task. If you want, you can also add an additional column containing project category data to a Gantt chart. Adding project category data to a Gantt chart causes the bars for each category to appear in different colors, indicating multiple projects. Also, a legend is added to the chart showing you which project category is which.

For information about value, category, and series data, see [Understanding Chart Data](/s/article/360043428693 "Understanding Chart Data").

In the Analyzer, you choose the columns containing the data for your Gantt chart. For more information about choosing data columns, see [Applying DataSet Columns to Your Chart](/s/article/360043428713 "Applying DataSet Columns to Your Chart").

For more information about formatting charts in the Analyzer, see [Visualization Card Building Part 2: The Analyzer](/s/topic/0TO5w000000ZaoUGAS "KPI Card Building Part 2: The Analyzer").

The following graphic shows how the data from a typical column-based spreadsheet is converted into a standard Gantt chart:

<Frame>
  <img alt="" src="https://mintcdn.com/domoinc-openapi-sync-dataflows/KRKoASQJgRuO8wHw/images/kb/ka05w00000123nu-00N5w00000Ri7BU-0EM5w000005vP9l.png?fit=max&auto=format&n=KRKoASQJgRuO8wHw&q=85&s=10f67c4a3678da6f927b6885deb5a7f8" style={{width: 731, height: 691}} width="731" height="691" data-path="images/kb/ka05w00000123nu-00N5w00000Ri7BU-0EM5w000005vP9l.png" />
</Frame>

The following graphic shows how the data from a typical column-based spreadsheet is converted into a Gantt Percent Complete chart:
<Frame>
  <img alt="" src="https://mintcdn.com/domoinc-openapi-sync-dataflows/KRKoASQJgRuO8wHw/images/kb/ka05w00000123nu-00N5w00000Ri7BU-0EM5w000005vP9k.png?fit=max&auto=format&n=KRKoASQJgRuO8wHw&q=85&s=07637849f99615100ac068c1dfb82817" style={{width: 821, height: 666}} width="821" height="666" data-path="images/kb/ka05w00000123nu-00N5w00000Ri7BU-0EM5w000005vP9k.png" />
</Frame>

## Customizing Gantt charts

You can customize the appearance of a Gantt chart by editing its **Chart Properties**. For information about all chart properties, see [Chart Properties](/s/topic/0TO5w000000ZaodGAC "Chart Properties").

Unique properties of Gantt charts include the following:

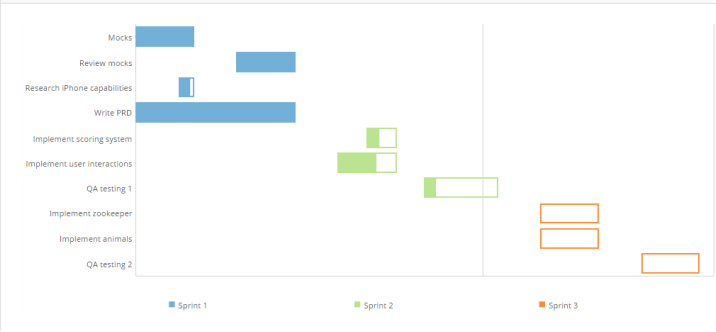
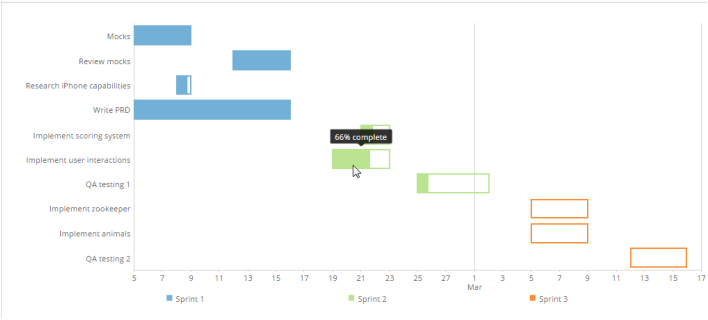
<table border="1" cellpadding="1" cellspacing="1" data-aura-rendered-by="33:205;a"><thead><tr><th colspan="1" rowspan="1"><p><font face="-apple-system, system-ui, Segoe UI, Helvetica, Arial, sans-serif"> Property </font></p></th><th colspan="1" rowspan="1"><p><font face="-apple-system, system-ui, Segoe UI, Helvetica, Arial, sans-serif"> Description </font></p></th><th colspan="1" rowspan="1"><p><font face="-apple-system, system-ui, Segoe UI, Helvetica, Arial, sans-serif"> Example (s) </font></p></th></tr></thead><tbody><tr><td colspan="1" rowspan="1"><font face="-apple-system, system-ui, Segoe UI, Helvetica, Arial, sans-serif"> Time Scale (X) > Show Label </font></td><td colspan="1" rowspan="1"><font face="-apple-system, system-ui, Segoe UI, Helvetica, Arial, sans-serif"> Hides or shows time scale labels. Labels are shown by default. </font></td><td colspan="1" rowspan="1"><a target="_blank" title="/@api/deki/files/564/gantt_no_time_scale.png"><font color="#2f3941" face="-apple-system, system-ui, Segoe UI, Helvetica, Arial, sans-serif"><img alt="" src="https://mintcdn.com/domoinc-openapi-sync-dataflows/KRKoASQJgRuO8wHw/images/kb/ka05w00000123nu-00N5w00000Ri7BU-0EM5w000005vP9c.png?fit=max&auto=format&n=KRKoASQJgRuO8wHw&q=85&s=6b364d84636bb03d21995a78e5afdfb1" width="716" height="332" data-path="images/kb/ka05w00000123nu-00N5w00000Ri7BU-0EM5w000005vP9c.png" /></font></a></td></tr><tr><td colspan="1" rowspan="1"><font face="-apple-system, system-ui, Segoe UI, Helvetica, Arial, sans-serif"> Hover Text Settings > Text </font></td><td colspan="1" rowspan="1"><p><font face="-apple-system, system-ui, Segoe UI, Helvetica, Arial, sans-serif"> Lets you replace the default hover text with your own custom text. You can insert any of a variety of macros to reference the start date, percent of completion, category, etc. For more information, see <a href="/s/article/360043429693" target="_blank" title="Formatting Data Label and Hover Text in Your Chart"> Formatting Data Label and Hover Text in Your Chart </a>. </font></p><p><font face="-apple-system, system-ui, Segoe UI, Helvetica, Arial, sans-serif"> In the example at right, the user replaced the default hover text with the following macro: <code> %\_PERCENT\_COMPLETE% complete </code>. </font></p></td><td colspan="1" rowspan="1"><a target="_blank" title="/@api/deki/files/560/gantt_custom_macro.png"><font color="#2f3941" face="-apple-system, system-ui, Segoe UI, Helvetica, Arial, sans-serif"><img alt="" src="https://mintcdn.com/domoinc-openapi-sync-dataflows/KRKoASQJgRuO8wHw/images/kb/ka05w00000123nu-00N5w00000Ri7BU-0EM5w000005vP9e.png?fit=max&auto=format&n=KRKoASQJgRuO8wHw&q=85&s=20426f1d702cceb5ce9a760d1307e570" width="708" height="320" data-path="images/kb/ka05w00000123nu-00N5w00000Ri7BU-0EM5w000005vP9e.png" /></font></a></td></tr></tbody></table>