Property
| Description | Example |
| General > Bounds Fill Color | Determines the color of the region between the lower and upper bounds of the first provided forecasting line. If either of these bounds is not set, no fill is applied. | 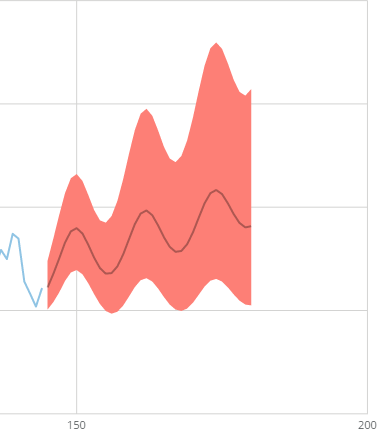 |
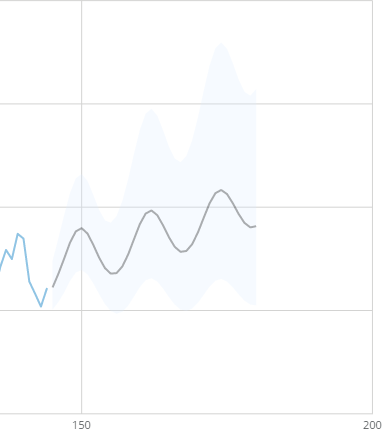
| General > Fill Transparency Percent | Determines the percent of transparency of the fill between the lower and upper bounds of the first provided forecasting line. You can select any number between 0 and 100, in which 0 is completely opaque and 100 is completely transparent. If no color is selected in Bounds Fill Color, this property is unavailable. In the example, the transparency has been set to 75.
|  |
| General > Forecast Line Color | Determines the color of the first provided forecast line. | 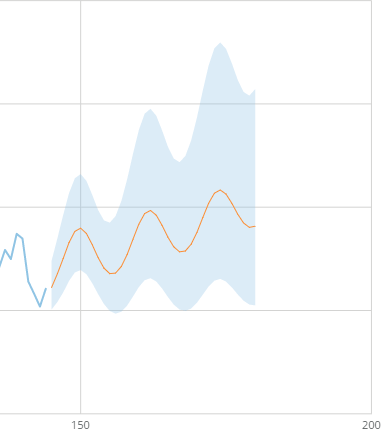 |
| General > Bounds 2 Fill Color | Determines the color of the region between the lower and upper bounds of the second provided forecasting line. If either of these bounds is not set, no fill is applied. | —
|
| General > Fill 2 Transparency Percent | Determines the percent of transparency of the fill between the lower and upper bounds of the second provided forecasting line. You can select any number between 0 and 100, in which 0 is completely opaque and 100 is completely transparent. If no color is selected in Bounds 2 Fill Color, this property is unavailable. | —
|
| General > Forecast 2 Line Color | Determines the color of the second provided forecast line. | —
|
 Be aware that this chart type does *not* currently include algorithms to create forecast line(s) and upper and lower bounds. This data must already be present in the DataSet you are using to power the chart. However, you can use tools such as R and Python to create these columns in your data source before bringing them into Domo.
## Powering forecasting charts
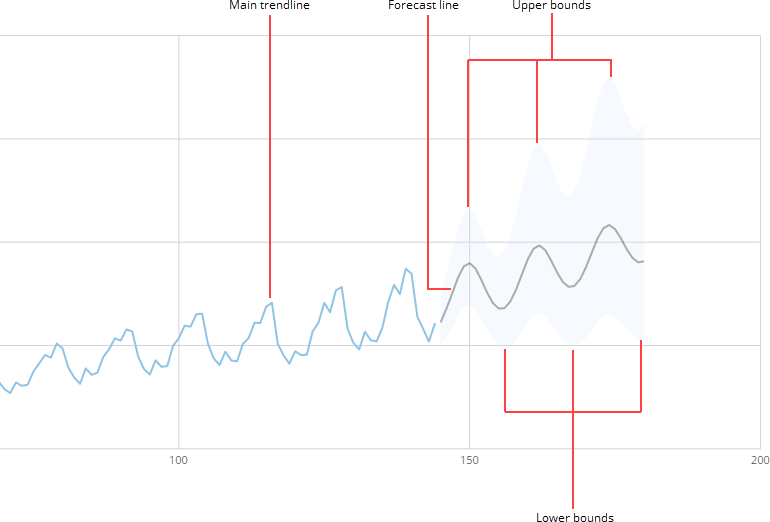
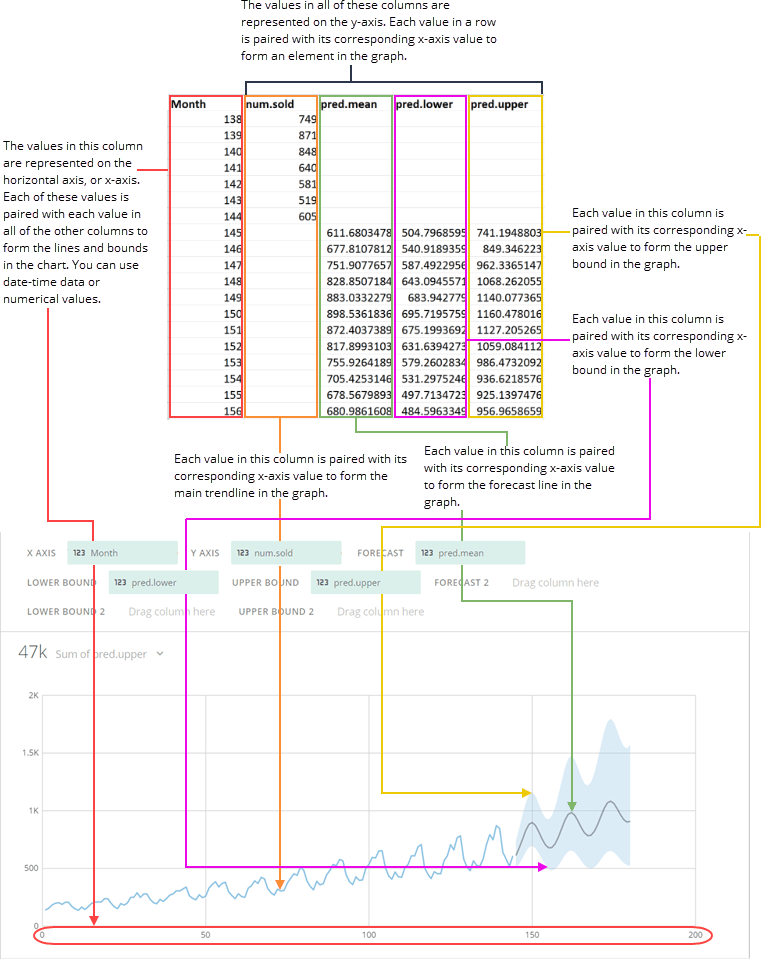
Forecasting charts require three columns or rows of data from your DataSet, or five if you plan to show upper and lower bounds. One column contains the X coordinates for the chart. All remaining columns contain Y coordinate values to be paired with their corresponding X coordinate value to form various elements in the chart. These Y coordinate columns are as follows:
* A column with Y coordinate values for the main trendline in the chart (required).
* A column with Y coordinate values for the forecast line (required).
* A column with Y coordinate values for the upper bound (optional).
* A column with Y coordinate values for the lower bound (optional).
To see an example of how to lay out this data, see the graphic below.
You can also add data for a second forecast line, lower bound, and upper bound, if your data source includes columns for this.
For information about value, category, and series data, see [Understanding Chart Data](/s/article/360043428693 "Understanding Chart Data").
In the Analyzer, you choose the columns containing the data for your forecasting chart. For more information about choosing data columns, see [Applying DataSet Columns to Your Chart](/s/article/360043428713 "Applying DataSet Columns to Your Chart").
For more information about formatting charts in the Analyzer, see KPI Card Building Part 2: The Analyzer.
The following graphic shows you how the data from a typical column-based spreadsheet is converted into a simple (one-line) forecasting chart. Note that the spreadsheet shows only a small subset of the data used to power this chart.
Be aware that this chart type does *not* currently include algorithms to create forecast line(s) and upper and lower bounds. This data must already be present in the DataSet you are using to power the chart. However, you can use tools such as R and Python to create these columns in your data source before bringing them into Domo.
## Powering forecasting charts
Forecasting charts require three columns or rows of data from your DataSet, or five if you plan to show upper and lower bounds. One column contains the X coordinates for the chart. All remaining columns contain Y coordinate values to be paired with their corresponding X coordinate value to form various elements in the chart. These Y coordinate columns are as follows:
* A column with Y coordinate values for the main trendline in the chart (required).
* A column with Y coordinate values for the forecast line (required).
* A column with Y coordinate values for the upper bound (optional).
* A column with Y coordinate values for the lower bound (optional).
To see an example of how to lay out this data, see the graphic below.
You can also add data for a second forecast line, lower bound, and upper bound, if your data source includes columns for this.
For information about value, category, and series data, see [Understanding Chart Data](/s/article/360043428693 "Understanding Chart Data").
In the Analyzer, you choose the columns containing the data for your forecasting chart. For more information about choosing data columns, see [Applying DataSet Columns to Your Chart](/s/article/360043428713 "Applying DataSet Columns to Your Chart").
For more information about formatting charts in the Analyzer, see KPI Card Building Part 2: The Analyzer.
The following graphic shows you how the data from a typical column-based spreadsheet is converted into a simple (one-line) forecasting chart. Note that the spreadsheet shows only a small subset of the data used to power this chart.
 ## Customizing forecasting charts
You can customize the appearance of a forecasting chart by editing its **Chart Properties**. For information about all chart properties, see Chart Properties. Unique properties of forecasting charts include the following. You can click a thumbnail image to see a larger image.
## Customizing forecasting charts
You can customize the appearance of a forecasting chart by editing its **Chart Properties**. For information about all chart properties, see Chart Properties. Unique properties of forecasting charts include the following. You can click a thumbnail image to see a larger image.