> ## Documentation Index
> Fetch the complete documentation index at: https://domoinc-openapi-sync-dataflows.mintlify.site/llms.txt
> Use this file to discover all available pages before exploring further.

# > Map Charts

export const InlineImage = ({src, alt = '', height = '1.6em'}) => {
  return <img noZoom src={src} alt={alt} style={{
    display: 'inline',
    verticalAlign: 'start',
    height: height,
    margin: '0'
  }} />;
};

In Domo, maps are used to represent numerical data across two or more regions. Maps are accompanied by legends so you can determine the range for each state or country. Various color themes are available for maps; you can change the existing color theme. For more information, see [Chart Properties](/s/topic/0TO5w000000ZaodGAC "Chart Properties").

**Video - Map Charts**

<iframe allowfullscreen="" frameborder="0" height="315" src="//www.youtube-nocookie.com/embed/ahzrs6FI3uk" width="560" />

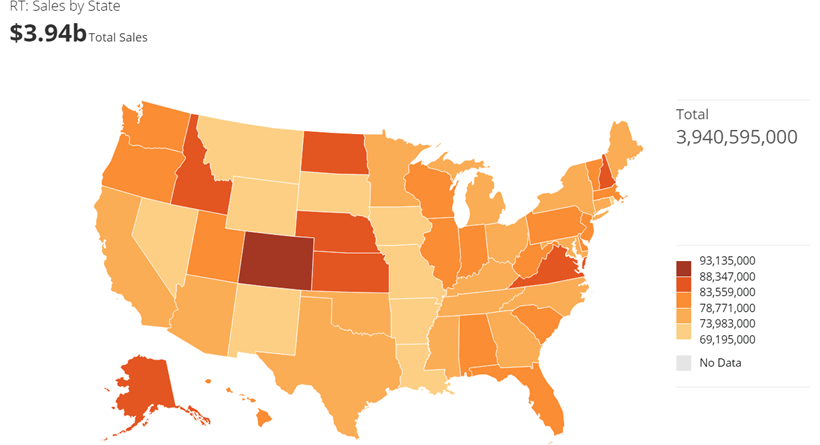
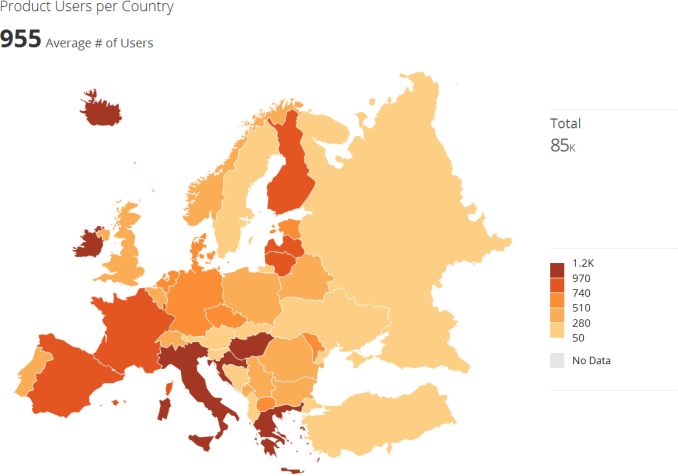
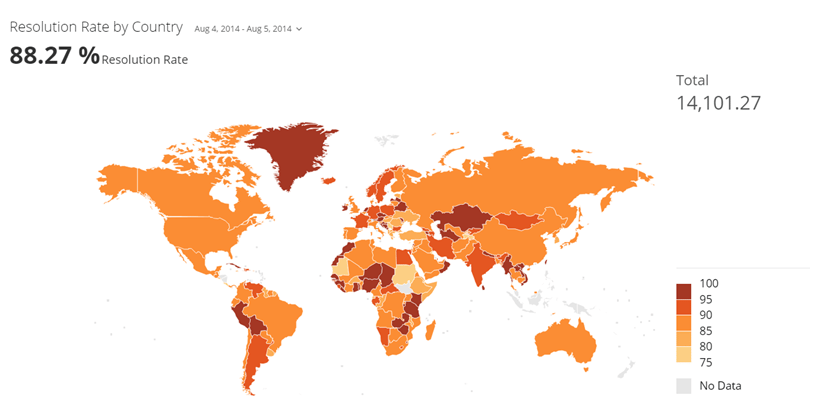
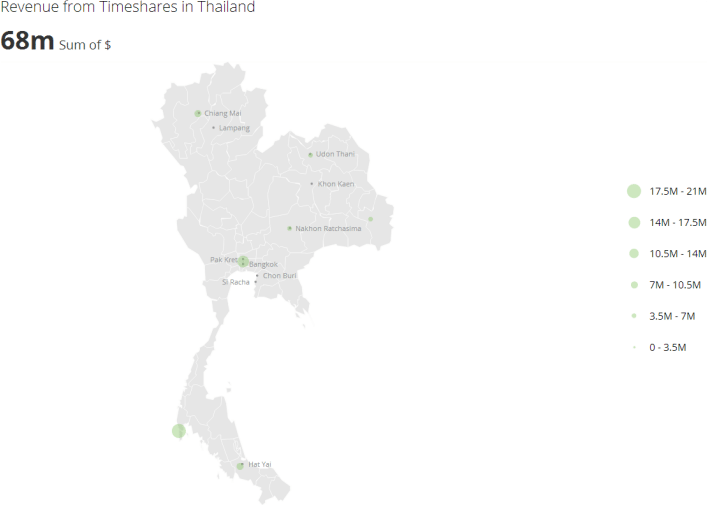
The following table lists the types of Maps available in Domo. You can click a thumbnail image to see a larger image.

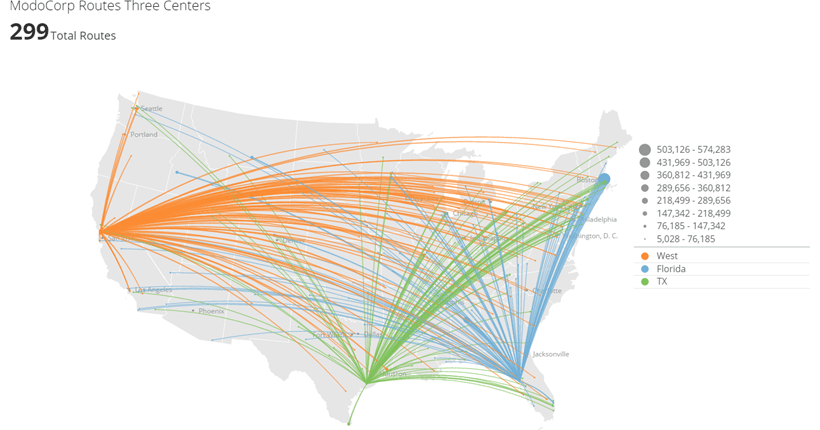
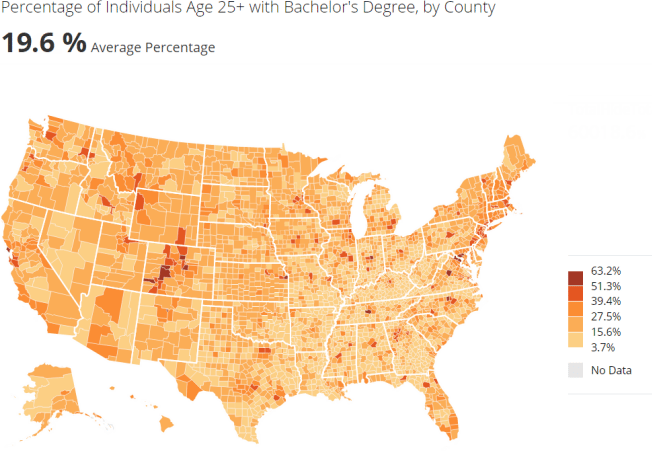
<table border="1" cellpadding="1" cellspacing="1" data-aura-rendered-by="33:209;a"><tbody><tr><th colspan="1" rowspan="1"><p> Map Type </p></th><th colspan="1" rowspan="1"><p> Description </p></th><th colspan="1" rowspan="1"><p> Example </p></th></tr><tr><td colspan="1" rowspan="1"><p> Country map </p><p /></td><td colspan="1" rowspan="1"><p> Represents data for states, provinces, subdivisions, and prefectures in any of a number of different countries. Regions in a country may be represented using two-letter abbreviations, full names, or both, depending on the country. </p><p> For more information, see <a href="/s/article/360043429033" target="_blank" title="Country Map"> Country Map </a>. </p></td><td colspan="1" rowspan="1"><p><img alt="map_kpi_example.png" src="https://mintcdn.com/domoinc-openapi-sync-dataflows/_XUBQXMuNz8Oy5Tm/images/kb/ka0Vq000000CrIH-00N5w00000Ri7BU-0EM5w000005vPCU.png?fit=max&auto=format&n=_XUBQXMuNz8Oy5Tm&q=85&s=815000e1484a3ce143753cff701dfe78" width="820" height="445" data-path="images/kb/ka0Vq000000CrIH-00N5w00000Ri7BU-0EM5w000005vPCU.png" /></p></td></tr><tr><td colspan="1" rowspan="1"><p> Continental or regional map </p></td><td colspan="1" rowspan="1"><p> Represents data for countries within a specific continent or region. Countries in a continent or region may be represented using two-letter ISO 3166-1-alpha-2 codes or full names. </p><p> For more information, see <a href="/s/article/360043429013" target="_blank" title="Continental/Regional Map"> Continental/Regional Map </a>. </p></td><td colspan="1" rowspan="1"><p><a target="_blank" title="/@api/deki/files/254/continental_map_kpi_example.png"><img alt="" src="https://mintcdn.com/domoinc-openapi-sync-dataflows/EpEQaVXeYQJOgZLs/images/kb/ka0Vq000000CrIH-00N5w00000Ri7BU-0EM5w000005vPCZ.png?fit=max&auto=format&n=EpEQaVXeYQJOgZLs&q=85&s=6e004d4e0cd15fcdd512e9b690a2145e" width="678" height="476" data-path="images/kb/ka0Vq000000CrIH-00N5w00000Ri7BU-0EM5w000005vPCZ.png" /></a></p></td></tr><tr><td colspan="1" rowspan="1"><p> World map </p><p><InlineImage src="/images/kb/ka0Vq000000CrIH-00N5w00000Ri7BU-0EM5w000005vPCa.png" /></p></td><td colspan="1" rowspan="1"><p> Represents data for world nations. Nations in your DataSet are represented using ISO 3166-1-alpha-2 codes. For a current list of countries and their corresponding codes, see <a href="https://www.iso.org/iso-3166-country-codes.html" target="_blank" title="http://www.iso.org/iso/country_codes/country_codes"> country codes </a>. </p><p> For more information, see <a href="/s/article/360042925114" target="_blank" title="World Map"> World Map </a>. </p></td><td colspan="1" rowspan="1"><p><a target="_blank" title="/@api/deki/files/1025/world_map_kpi_example.png"><img alt="" src="https://mintcdn.com/domoinc-openapi-sync-dataflows/EpEQaVXeYQJOgZLs/images/kb/ka0Vq000000CrIH-00N5w00000Ri7BU-0EM5w000005vPCW.png?fit=max&auto=format&n=EpEQaVXeYQJOgZLs&q=85&s=870cd5a5c125289d868b70eab7b9423c" width="820" height="420" data-path="images/kb/ka0Vq000000CrIH-00N5w00000Ri7BU-0EM5w000005vPCW.png" /></a></p></td></tr><tr><td colspan="1" rowspan="1"><p> Latitude-longitude map </p><p><InlineImage src="/images/kb/ka0Vq000000CrIH-00N5w00000Ri7BU-0EM5w000005vPCb.png" /></p></td><td colspan="1" rowspan="1"><p> Displays data for any region in the world using latitude and longitude coordinates. The region that displays for a DataSet is "zoomed" depending on the given coordinates. For example, if all of the cities in your DataSet were in Germany, the resulting map would show Germany; likewise, if some cities in the DataSet were in Germany and others were in France, the map would be "zoomed out" to show western Europe. Filters you apply to a latitude/longitude map also work this way. For example, if you were in the <b> Details </b> view for a map of the United States and you used Analyzer to show only cities in Washington and California, your map would be updated to show the westmost region of the United States. For more information about applying filters, see <a href="/s/article/360042924074" target="_blank" title="Adding Filters to Your Chart"> Adding Filters to Your Chart </a>. </p><p> For more information about latitude/longitude maps, see <a href="/s/article/360043429213" target="_blank" title="Latitude-Longitude Map"> Latitude-Longitude Map </a>. </p></td><td colspan="1" rowspan="1"><p><a target="_blank" title="/@api/deki/files/696/latlong_map_kpi_example.png"><img alt="" src="https://mintcdn.com/domoinc-openapi-sync-dataflows/EpEQaVXeYQJOgZLs/images/kb/ka0Vq000000CrIH-00N5w00000Ri7BU-0EM5w000005vPCV.png?fit=max&auto=format&n=EpEQaVXeYQJOgZLs&q=85&s=94e3d93472b644c0df508f3b6ea6d2ed" width="708" height="506" data-path="images/kb/ka0Vq000000CrIH-00N5w00000Ri7BU-0EM5w000005vPCV.png" /></a></p></td></tr><tr><td colspan="1" rowspan="1"><p> Latitude-longitude route map </p><p><InlineImage src="/images/kb/ka0Vq000000CrIH-00N5w00000Ri7BU-0EM5w000005vPCc.png" /></p></td><td colspan="1" rowspan="1"><p> A latitude-longitude map in which coordinate points are connected using lines. Two value columns are required; one of these is applied to the start point of a given route line and the other is applied to the end point. In the map, differences in the values of start and end points are represented by the thickness of the lines. In the example at right, all of the start points are set to 0 and the end points are set to the value of the product being shipped. In this way the viewer can see where their most valuable customers are located by looking at the thickness of the lines. <br /> In other respects, a latitude-longitude route map is the same as a latitude-longitude map. The provided coordinates and applied filters determine the "zoom" level of the map. You can also have multiple distinct routes by uploading an optional series column. For example, in the screenshot there are three distinct routes, one colored orange, one colored green, and one colored blue. </p><p> For more information about latitude-longitude route maps, see <a href="/s/article/360042924654" target="_blank" title="Latitude-Longitude Route Map"> Latitude-Longitude Route Map </a>. </p></td><td colspan="1" rowspan="1"><p><a target="_blank" title="/@api/deki/files/709/latlongroute_map_kpi_example.png"><img alt="latlongroute_map_kpi_example.png" src="https://mintcdn.com/domoinc-openapi-sync-dataflows/_XUBQXMuNz8Oy5Tm/images/kb/ka0Vq000000CrIH-00N5w00000Ri7BU-0EM5w000005vPCT.png?fit=max&auto=format&n=_XUBQXMuNz8Oy5Tm&q=85&s=cda6e6a4eebe38e22ece15d5bd63b7b0" width="820" height="430" data-path="images/kb/ka0Vq000000CrIH-00N5w00000Ri7BU-0EM5w000005vPCT.png" /></a></p></td></tr><tr><td colspan="1" rowspan="1"><p> U.S. county map </p><p><InlineImage src="/images/kb/ka0Vq000000CrIH-00N5w00000Ri7BU-0EM5w000005vPCX.png" /></p></td><td colspan="1" rowspan="1"><p> A U.S. county map shows data for U.S. counties at the country level. This type of map requires only two data columns—one with values and the other with county FIPS codes. </p><p> For more information about U.S. county maps, see <a href="/s/article/360042925074" target="_self" title="U.S. County Map"> U.S. County Map </a>. </p></td><td colspan="1" rowspan="1"><p><a target="_blank" title="/@api/deki/files/1039/us_county_map_kpi_example.png"><img alt="us_county_map_kpi_example.png" src="https://mintcdn.com/domoinc-openapi-sync-dataflows/EpEQaVXeYQJOgZLs/images/kb/ka0Vq000000CrIH-00N5w00000Ri7BU-0EM5w000005vPCY.png?fit=max&auto=format&n=EpEQaVXeYQJOgZLs&q=85&s=1f870d3a753ca2da4727b8052e26d642" width="652" height="451" data-path="images/kb/ka0Vq000000CrIH-00N5w00000Ri7BU-0EM5w000005vPCY.png" /></a></p></td></tr></tbody></table>