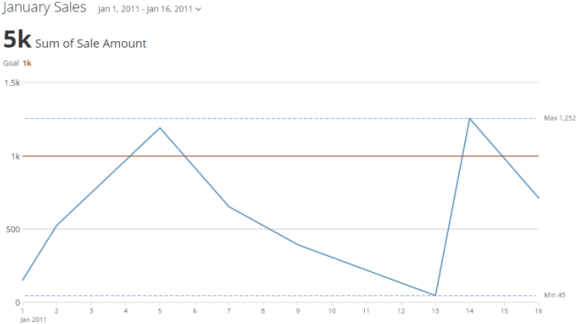
You can do this using two different methods: by entering a value into the **Goal** field above the chart, or by using Chart Properties. If you enter goals using both methods, two different goal markers are added to the chart.
## Adding a Goal Using the Goal Field
The simplest way to configure a goal marker is by entering a target value in the **Goal** field. This field is found in the dialog of additional options that appears when you click a column name in the fields region above the chart preview. This field is available only for value data.
You can do this using two different methods: by entering a value into the **Goal** field above the chart, or by using Chart Properties. If you enter goals using both methods, two different goal markers are added to the chart.
## Adding a Goal Using the Goal Field
The simplest way to configure a goal marker is by entering a target value in the **Goal** field. This field is found in the dialog of additional options that appears when you click a column name in the fields region above the chart preview. This field is available only for value data.
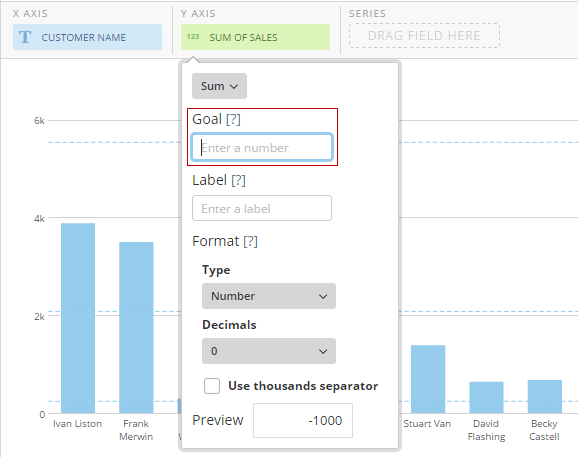 When you add a goal in this way, it appears as a simple orange line on the value you have specified. You cannot apply special formatting such as custom styles, colors, or width, and you cannot set a range of values. If you want to customize your goal line in this way, use Chart Properties.
The **Goal** option is available for most kinds of Bar and Line graphs, as well as Radar graphs, Lollipop graphs, Area graphs, stock graphs, and more.
**To add a goal in this way,**
1. In the field region above the chart preview in Analyzer, click the value column you want to add a goal to.
2. Enter your numerical goal into the **Goal** field.
## Adding a Goal Using Chart Properties
If you want to customize your goal line by changing the color, width, styling, etc., or including a range of values instead of a single line, you can use Chart Properties to add the goal. You can also change the default text that describes the goal number (which says "GOAL" by default).
**To add a goal using Chart Properties,**
1. In Chart Properties, expand the **Scale Marker** category.
2. Configure the options you want.
The following table lists and describes all of the properties available for configuring goal markers for a chart. All of these properties can be found in the **Scale Marker** category in Chart Properties. These properties are available for most kinds of Bar and Line graphs, as well as Lollipop graphs, Area graphs, stock graphs, and more.
When you add a goal in this way, it appears as a simple orange line on the value you have specified. You cannot apply special formatting such as custom styles, colors, or width, and you cannot set a range of values. If you want to customize your goal line in this way, use Chart Properties.
The **Goal** option is available for most kinds of Bar and Line graphs, as well as Radar graphs, Lollipop graphs, Area graphs, stock graphs, and more.
**To add a goal in this way,**
1. In the field region above the chart preview in Analyzer, click the value column you want to add a goal to.
2. Enter your numerical goal into the **Goal** field.
## Adding a Goal Using Chart Properties
If you want to customize your goal line by changing the color, width, styling, etc., or including a range of values instead of a single line, you can use Chart Properties to add the goal. You can also change the default text that describes the goal number (which says "GOAL" by default).
**To add a goal using Chart Properties,**
1. In Chart Properties, expand the **Scale Marker** category.
2. Configure the options you want.
The following table lists and describes all of the properties available for configuring goal markers for a chart. All of these properties can be found in the **Scale Marker** category in Chart Properties. These properties are available for most kinds of Bar and Line graphs, as well as Lollipop graphs, Area graphs, stock graphs, and more.
Option
Description
Example
Text
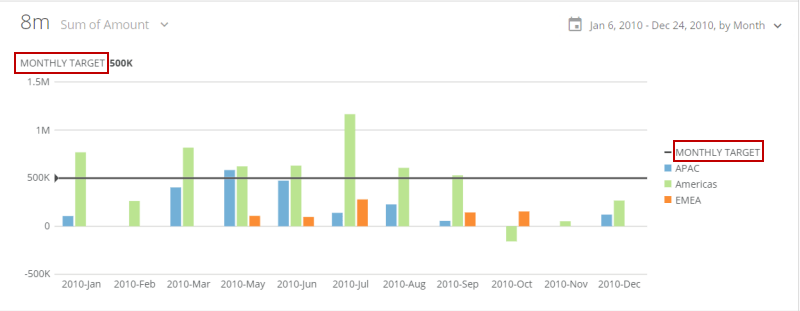
Lets you specify text to replace the default word "GOAL" that normally appears above the top left corner of the graph when a scale marker has been set. If the graph contains a legend, an item for the scale marker is added to the legend with this text (unless you hide it by checking the Scale Marker > Hide in Legend box).
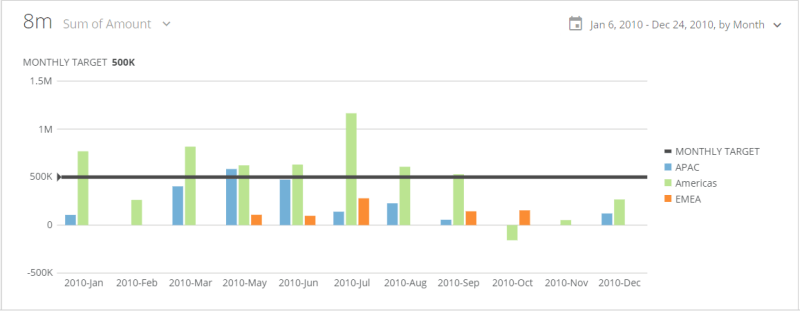
The example shows a chart in which "MONTHLY TARGET" has been entered as the custom text.
Scale
In dual-scale graphs, lets you specify whether the goal in the graph is associated with the left or right scale.
—
Type
Lets you specify whether the scale marker is a line or a range of values.
—
Value
Lets you specify the value of your scale marker line. This option is only available when you select Line in the Type menu.
—
Color
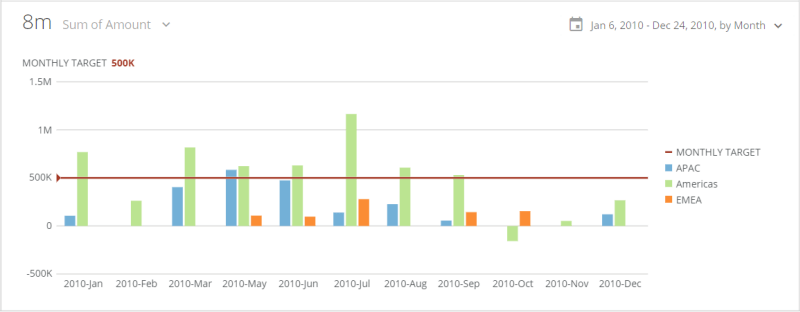
Lets you specify the color of your scale marker line, together with the color of the goal value that appears above the top left corner of the graph. This option is only available when you select Line in the Type menu.
In the example, the user has selected a red-orange color for the line and value.
Width
Lets you specify the width of your scale marker line—either Thin (the default), Medium , and Thick . This option is only available when you select Line in the Type menu.
In the example, the user has selected Thick for this option.
Style
Lets you select whether your scale marker line appears solid (default) or dashed. This option is only available when you select Line in the Type menu.
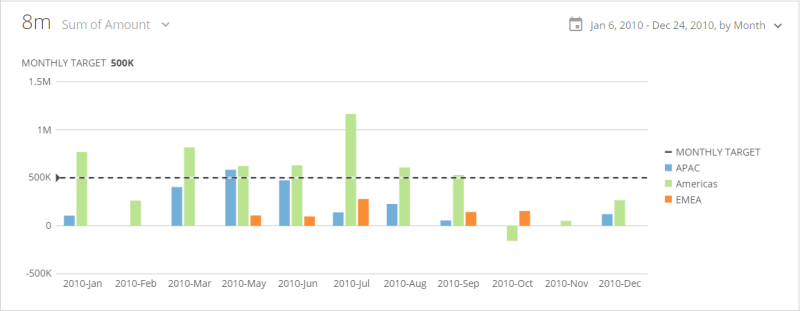
In the example, the user has selected Dashed for this option.
Upper Value
Lets you select the value for the upper line in your scale marker range. This option is only available when you select Range in the Type menu.
—
Lower Value
Lets you select the value for the lower line in your scale marker range. This option is only available when you select Range in the Type menu.
—
Fill Color
Lets you select the fill color for your scale marker range. This option is only available when you select Range in the Type menu.
—
Fill Transparency Percent
Lets you enter an transparency percentage for the fill in your scale marker range. This should be a value between 0 and 100. The higher the value, the more transparent the fill. This option is only available when you select Range in the Type menu.
—
Border Color
Lets you select the border color for your scale marker range. This option is only available when you select Range in the Type menu.
—
Border Style
Lets you select whether the borders of your scale marker range appear solid (default) or dashed. This option is only available when you select Range in the Type menu.
—
Outlier Fill Color
Lets you select the fill color between the line and scale marker range. This option is only available only for Line graphs and only when you select Range in the Type menu.
—
Outlier Fill Transparency Percent
Lets you enter an transparency percentage for the fill between the line and scale marker range. This should be a value between 0 and 100. The higher the value, the more transparent the fill. This option is only available only for Line graphs and only when you select Range in the Type menu.
—
Decimal Places
Lets you specify the number of decimal places in the goal value, both in the title as well as in the hover text.
—
Value Abbreviation
Lets you specify whether values are abbreviated based on the scale marker abbreviation (default) or 3 significant digits.
—
Hide in Legend
Lets you prevent a scale marker item from being added to the legend (if the graph contains a legend).
—
Hide Title
Hides the goal text and value that normally appear over the top left corner of the graph.
—