> ## Documentation Index
> Fetch the complete documentation index at: https://domoinc-openapi-sync-dataflows.mintlify.site/llms.txt
> Use this file to discover all available pages before exploring further.

# Adobe Analytics 1.4 Server to Server OAuth Connector

<Note>
  **Note:** The Adobe Analytics API v1.4, used by this connector, will be retired by Adobe in August 2026. As a result, this connector will be fully retired on July 8, 2026. To continue pulling data from Adobe Analytics, please use the [Adobe Analytics v2 OAuth Partition Connector - Server to Server](https://domo-support.domo.com/s/article/360043433653?language=en_US "Adobe Analytics v2 OAuth Partition Connector - Server to Server") connector instead.
</Note>

## Intro

Adobe Analytics helps you create a holistic view of your business by turning customer interactions into actionable insights. Domo's Adobe Analytics Advanced connector allows you to retrieve data through prebuilt reports or customized reports or by submitting a query to the Adobe Analytics API. You can then combine metrics with data from CRM, POS, or any other system to make faster, better-informed business decisions. To learn more about the Adobe Analytics API, visit their website ([https://adobedocs.github.io/analytics-1.4-apis/#/](https://adobedocs.github.io/analytics-1.4-apis/#/ "https://adobedocs.github.io/analytics-1.4-apis/#/") )

You connect to the Adobe Analytics API in the Data Center. This topic discusses the fields and menus that are specific to the Adobe Analytics Advanced connector user interface. General information for adding DataSets, setting update schedules, and editing DataSet information is discussed in [Adding a DataSet Using a Connector](https://domo-support.domo.com/s/article/360042926274?language=en_US "Adding a DataSet Using a Connector").

<table class="mt-responsive-table" data-aura-rendered-by="33:196;a"><tbody><tr><td class="mt-noheading" colspan="1" rowspan="1"><p><b> Primary Use Cases </b></p></td><td class="mt-noheading" colspan="1" rowspan="1"><p> Marketing and web analytics </p></td></tr><tr><td class="mt-noheading" colspan="1" rowspan="1"><p><b> Primary Metrics </b></p></td><td class="mt-noheading" colspan="1" rowspan="1"><p> Visits, page views, unique visitors, etc. </p></td></tr><tr><td class="mt-noheading" colspan="1" rowspan="1"><p><b> Primary Company Roles </b></p></td><td class="mt-noheading" colspan="1" rowspan="1"><p> Analysts and executives </p></td></tr><tr><td class="mt-noheading" colspan="1" rowspan="1"><p><b> Average Implementation Time </b></p></td><td class="mt-noheading" colspan="1" rowspan="1"><p> \~60 hours </p></td></tr><tr><td class="mt-noheading" colspan="1" rowspan="1"><p><b> Ease of Use (on a 1-to-10 scale with 1 being easiest) </b></p></td><td class="mt-noheading" colspan="1" rowspan="1"><p> 8 </p></td></tr></tbody></table>

## API Limitations

* Only 1 Report Suite can be selected for a given report.
* Adobe only allows 4 elements per request.
* Up to 30 metrics can be selected.
* Segments are mutually exclusive.
* The API returns only the top ten results for an element by default, based on the first selected metric selected.

## Prerequisites

To connect to the Adobe Analytics and create a DataSet, you must have the Client ID and Client Secret associated with your Adobe Analytics account.

Visit [Adobe Oauth Connection](https://www.adobe.io/authentication/auth-methods.html#!AdobeDocs/adobeio-auth/master/AuthenticationOverview/OAuthIntegration.md "https://www.adobe.io/authentication/auth-methods.html#!AdobeDocs/adobeio-auth/master/AuthenticationOverview/OAuthIntegration.md") documentation to learn more about obtaining your Client ID and Client Secret.

### Creating a new OAuth project in Adobe Developer Console

To create a new OAuth project in Adobe Developer Console, do the following:

1. Log into
   [https://console.adobe.io/projects](https://console.adobe.io/projects "Follow link").

2. Click
   **Create new project** button.

<Frame>
  <img alt="New_Project_button.png" src="https://mintcdn.com/domoinc-openapi-sync-dataflows/2K-MJunolF8arvf9/images/kb/ka0Vq00000012UP-00N5w00000Ri7BU-0EM5w000005vO15.png?fit=max&auto=format&n=2K-MJunolF8arvf9&q=85&s=f67e86801237c322fd0c877caccd5498" width="847" height="101" data-path="images/kb/ka0Vq00000012UP-00N5w00000Ri7BU-0EM5w000005vO15.png" />
</Frame>

3. Click on
   **Add API** to start using the Adobe services.

<Frame>
  <img alt="Add_API.png" src="https://mintcdn.com/domoinc-openapi-sync-dataflows/2K-MJunolF8arvf9/images/kb/ka0Vq00000012UP-00N5w00000Ri7BU-0EM5w000005vO16.png?fit=max&auto=format&n=2K-MJunolF8arvf9&q=85&s=d81196c6e1cb5a2dfd9ae30ec15d4bea" width="889" height="301" data-path="images/kb/ka0Vq00000012UP-00N5w00000Ri7BU-0EM5w000005vO16.png" />
</Frame>

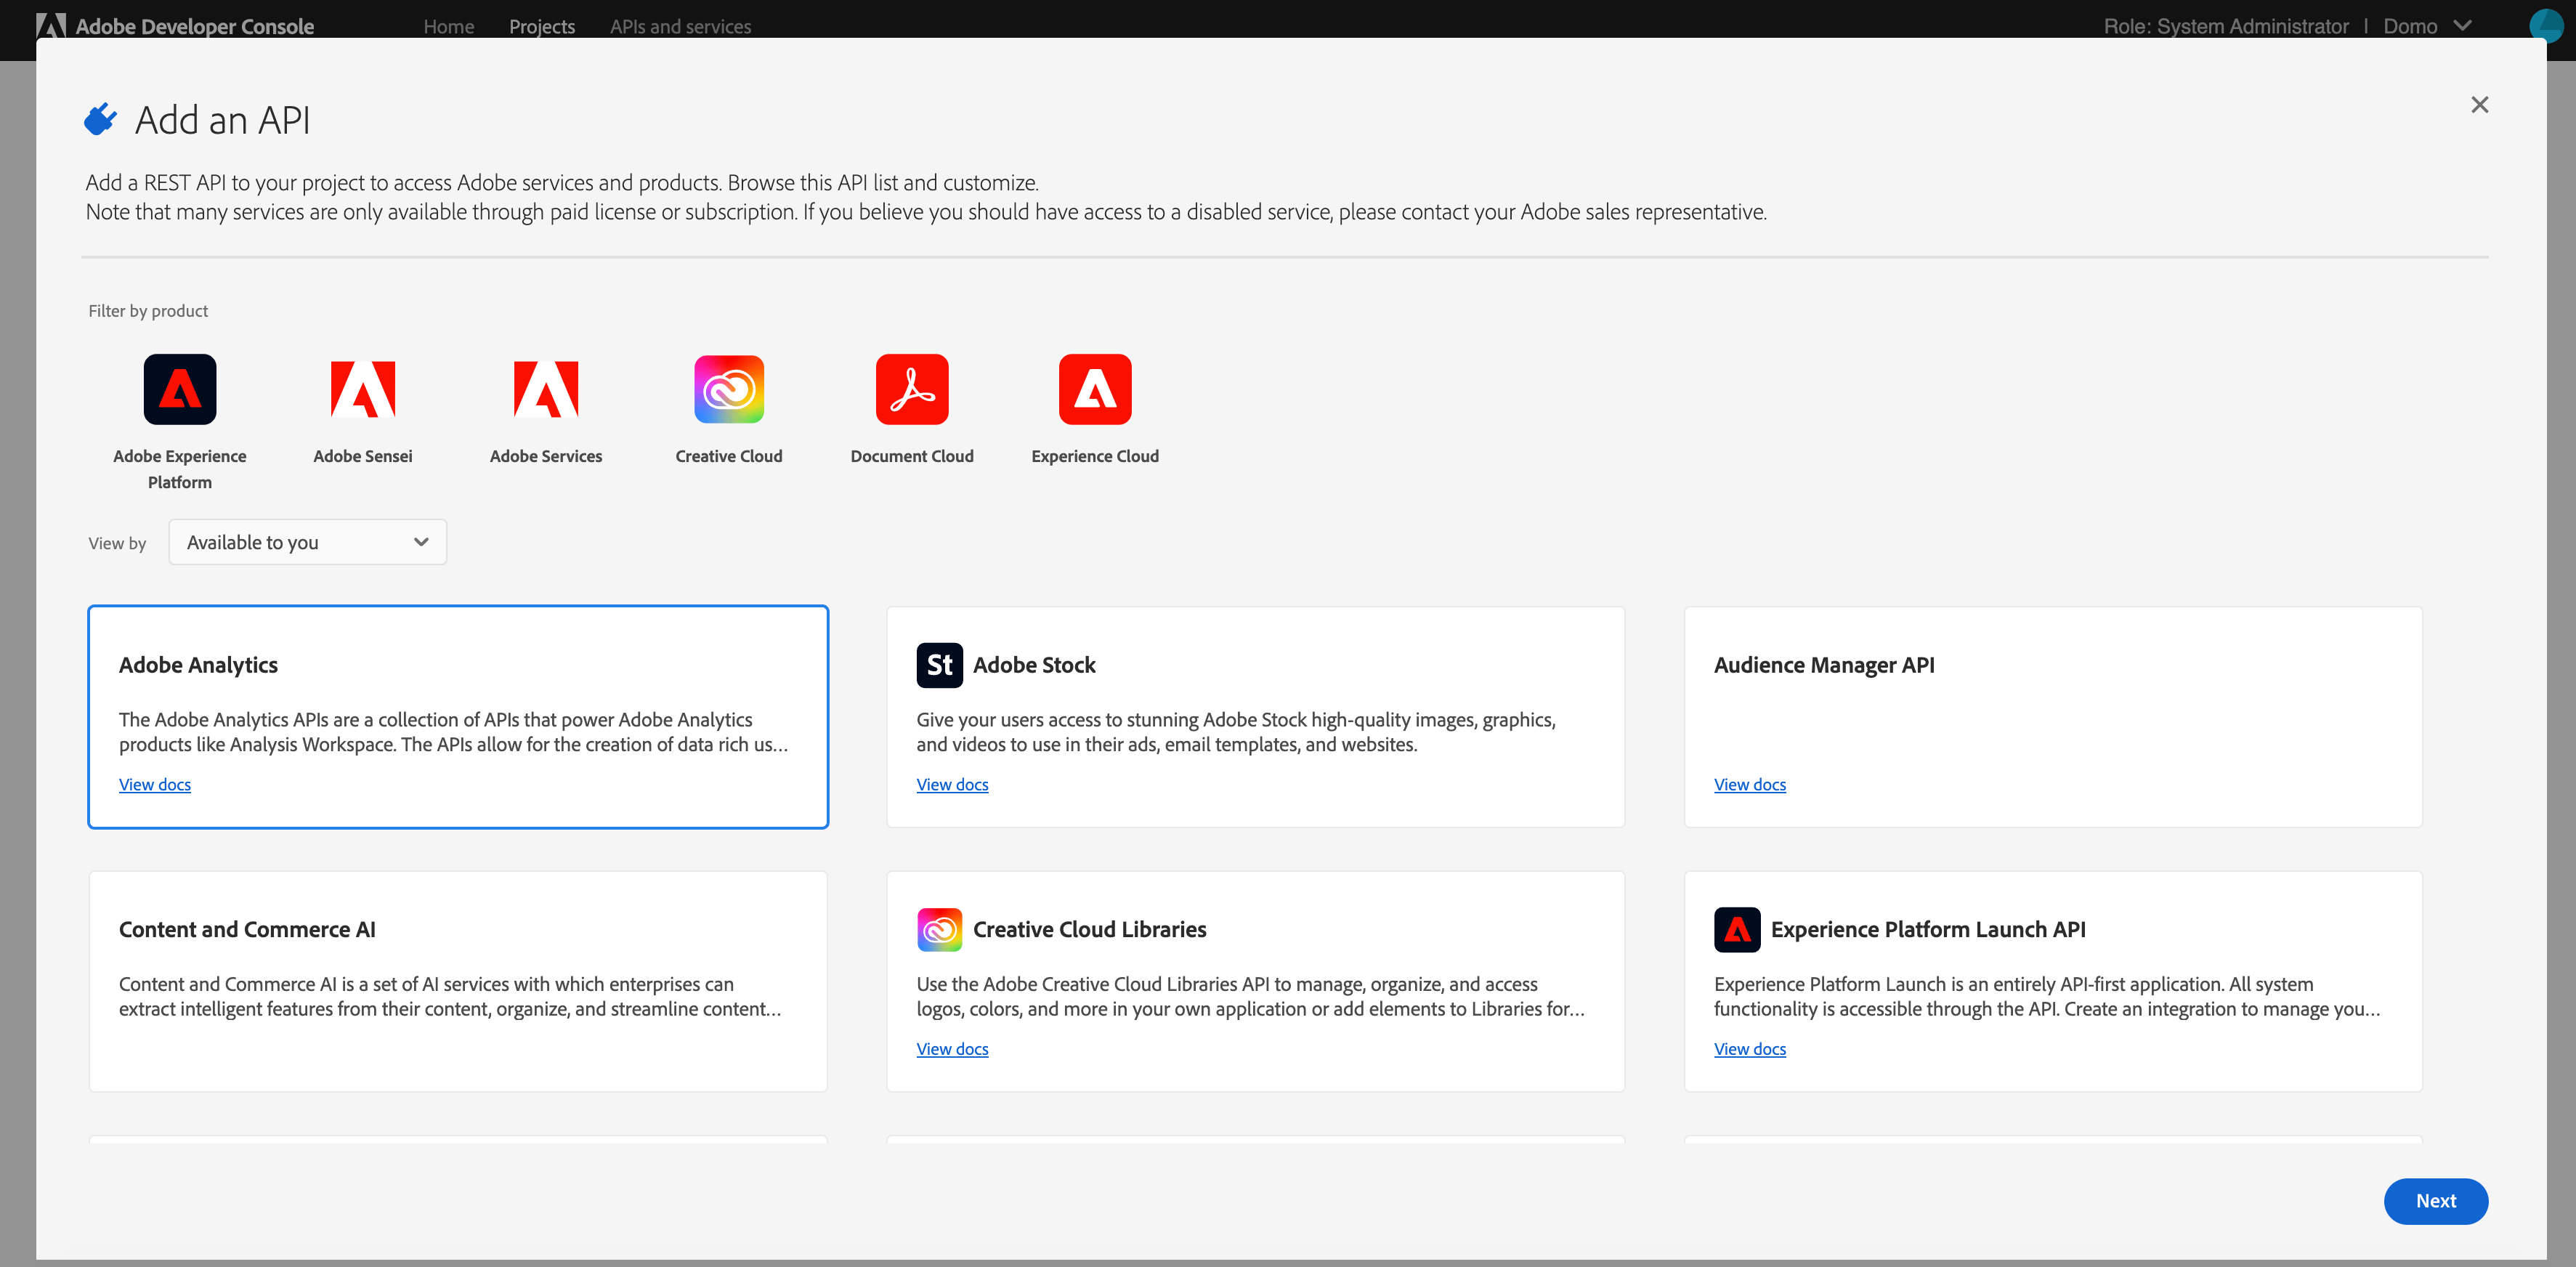
4. The APIs available to you will be listed in the
   **Add an API** window. Select **Adobe Analytics**.
<Frame>
  <img alt="Add_an_API-Adobe_Analytics.png" src="https://mintcdn.com/domoinc-openapi-sync-dataflows/2K-MJunolF8arvf9/images/kb/ka0Vq00000012UP-00N5w00000Ri7BU-0EM5w000005vO19.png?fit=max&auto=format&n=2K-MJunolF8arvf9&q=85&s=5cab7a57a078351f9f6307ddac7d29a8" width="3546" height="1744" data-path="images/kb/ka0Vq00000012UP-00N5w00000Ri7BU-0EM5w000005vO19.png" />
</Frame>

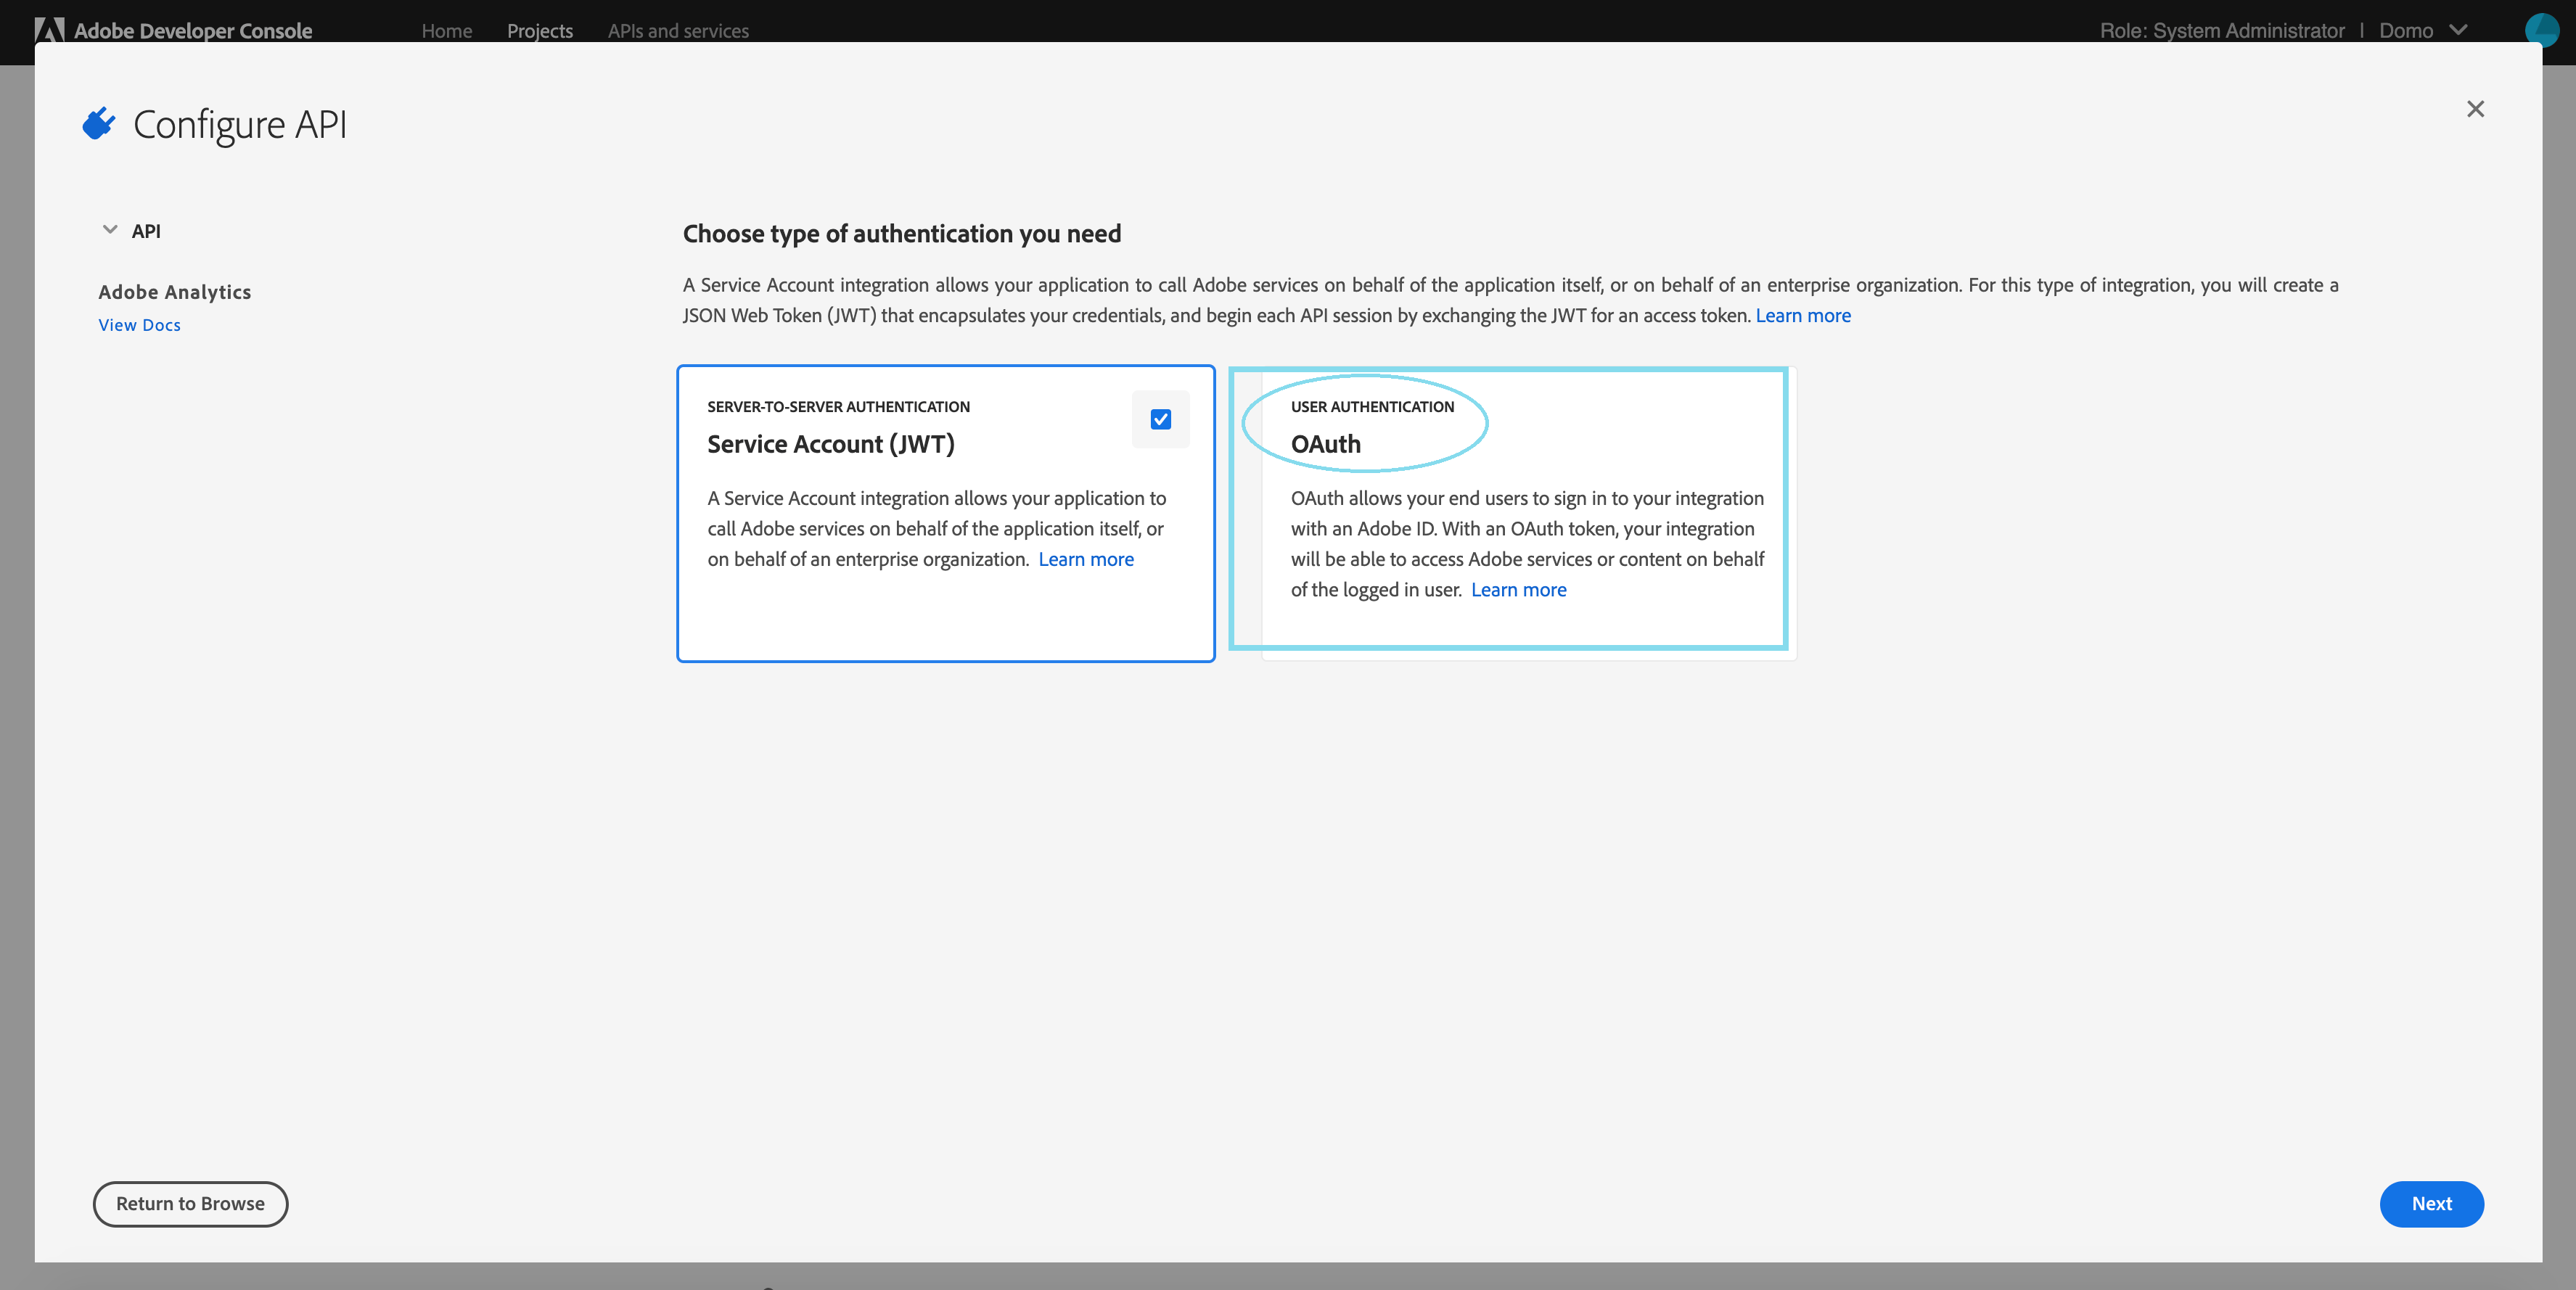
5. Now, you need to select the authentication type. Select
   **OAuth** here.
<Frame>
  <img alt="OAuth-service_account_OAuth.png" src="https://mintcdn.com/domoinc-openapi-sync-dataflows/yCOsvW2xnTRbP1fO/images/kb/ka0Vq0000008NaX-00N5w00000Ri7BU-0EM5w000005vO1D.png?fit=max&auto=format&n=yCOsvW2xnTRbP1fO&q=85&s=837fb17c43a07c86ed9f5e7e75dfa4c2" width="3550" height="1778" data-path="images/kb/ka0Vq0000008NaX-00N5w00000Ri7BU-0EM5w000005vO1D.png" />
</Frame>

6. Select the
   **Web** platform to configure the API.

Enter the **Default redirect URI** as **[https://oauth.domo.com/api/data/v2/oauth/providers/adobe-analytics-oauth/exchange](https://oauth.domo.com/api/data/v2/oauth/providers/adobe-analytics-oauth/exchange)**

Enter the **Redirect URI pattern** as **[https://oauth/.domo/.com/api/data/v2/oauth/providers/adobe-analytics-oauth/exchange](https://oauth/.domo/.com/api/data/v2/oauth/providers/adobe-analytics-oauth/exchange)**

7. Click
   **Save configured API**.

## Connecting to Your Adobe Analytics OAuth Account

This section enumerates the options in the **Credentials** and **Details** panes in the Adobe Analytics OAuth Connector page. The components of the other panes in this page, **Scheduling** and **Name & Describe Your DataSet**, are universal across most connector types and are discussed in greater length in [Adding a DataSet Using a Connector](https://domo-support.domo.com/s/article/360042926274?language=en_US "Adding a DataSet Using a Connector").

### Credentials Pane

This pane contains fields for entering credentials to connect to the Adobe Analytics API. The following table describes what is needed for each field:

<table border="1" cellpadding="1" cellspacing="1"><thead><tr><th colspan="1" rowspan="1"><p><span class="s1"> Field </span></p></th><th colspan="1" rowspan="1"><p><span class="s1"> Description </span></p></th></tr></thead><tbody><tr><td colspan="1" rowspan="1"> Client ID </td><td colspan="1" rowspan="1"> Enter the client ID associated with your Adobe Analytics account. </td></tr><tr><td colspan="1" rowspan="1"> Client Secret </td><td colspan="1" rowspan="1"> Enter the client secret associated with your Adobe Analytics account. </td></tr></tbody></table>

Once you have entered valid credentials, you can use the same account any time you go to create a new Adobe Analytics 1.4 OAuth DataSet. You can manage connector accounts in the **Accounts** tab in the Data Center. For more information about this tab, see [Manage Connector Accounts](https://domo-support.domo.com/s/article/360042926054?language=en_US "Manage Connector Accounts").

### Details Pane

This pane contains two primary menus, **Report Suite** and **Report Type**, along with various other menus which may or may not appear depending on the report type you select.

#### Primary Menus

<table border="1" cellpadding="1" cellspacing="1"><thead><tr><th colspan="1" rowspan="1"><p> Menu </p></th><th colspan="1" rowspan="1"><p> Description </p></th></tr></thead><tbody><tr><td colspan="1" rowspan="1"> Company </td><td colspan="1" rowspan="1"> Enter your company's name as featured on Adobe Analytics, which is used as a parameter for the Company.GetEndpoint method (see <a href="https://github.com/AdobeDocs/analytics-1.4-apis/blob/master/docs/admin-api/methods/company/r_GetEndpoint.md" target="_blank" title="https://github.com/AdobeDocs/analytics-1.4-apis/blob/master/docs/admin-api/methods/company/r_GetEndpoint.md"> [https://github.com/AdobeDocs/analytics-1.4-apis/blob/master/docs/admin-api/methods/company/r\_GetEndpoint.md](https://github.com/AdobeDocs/analytics-1.4-apis/blob/master/docs/admin-api/methods/company/r_GetEndpoint.md) </a> ) </td></tr><tr><td colspan="1" rowspan="1"><p> Report Suite </p></td><td colspan="1" rowspan="1"><p> Select the Adobe Analytics Report Suite you want to pull data from. </p></td></tr><tr><td colspan="1" rowspan="1"><p> Report Type </p></td><td colspan="1" rowspan="1"><p> Select a report type. The report type determines the set of inputs needed to configure the DataSet. </p><p> Report types are as follows: </p><table border="1" cellpadding="1" cellspacing="1"><tbody><tr><td colspan="1" rowspan="1"><p> Easy - Predefined </p></td><td colspan="1" rowspan="1"><p> Lets you select from a number of predefined Adobe Analytics reports. </p></td></tr><tr><td colspan="1" rowspan="1"><p> Intermediate - Custom </p></td><td colspan="1" rowspan="1"><p> Lets you specify the elements, metrics, segments, and date-time information for your report. </p></td></tr><tr><td colspan="1" rowspan="1"><p> Advanced - Query </p></td><td colspan="1" rowspan="1"><p> Lets you pull data using an Adobe Analytics Web Service API Explorer Query. For more information about queries, see <a class="link-https" href="https://adobedocs.github.io/analytics-1.4-apis/" target="_blank" title="https://adobedocs.github.io/analytics-1.4-apis/"> [https://adobedocs.github.io/analytics-1.4-apis/](https://adobedocs.github.io/analytics-1.4-apis/) </a>. </p></td></tr></tbody></table></td></tr></tbody></table>

#### "Easy - Predefined" Report Type Options

<table border="1" cellpadding="1" cellspacing="1" class="mt-responsive-table"><thead><tr><th class="mt-column-width-35" colspan="1" rowspan="1"><p> Option </p></th><th class="mt-column-width-65" colspan="1" rowspan="1"><p> Description </p></th></tr></thead><tbody><tr><td class="mt-column-width-35" colspan="1" rowspan="1"><p> Predefined Report </p></td><td class="mt-column-width-65" colspan="1" rowspan="1"><p> Select the report you want to run. For a list of report types, see the next section. </p></td></tr><tr><td class="mt-column-width-35" colspan="1" rowspan="1"><p> Backfill </p></td><td class="mt-column-width-65" colspan="1" rowspan="1"><p> Select the number of days back that should backfill the first time the report is run. </p></td></tr><tr><td class="mt-column-width-35" colspan="1" rowspan="1"><p> Report </p></td><td class="mt-column-width-65" colspan="1" rowspan="1"><p> Select a predefined report. These reports are available <em> only </em> when you select <b> Easy - Predefined </b> as your <b> Report Type </b>. </p><table border="1" cellpadding="1" cellspacing="1" class="mt-responsive-table"><tbody><tr><td class="mt-column-width-15 mt-noheading" colspan="1" rowspan="1"><p> Base Metrics </p></td><td class="mt-column-width-45 mt-noheading" colspan="1" rowspan="1"><p> Returns data about page views; average time spent on website; unique visitors by month, week, and day; new visitors; etc. </p></td></tr><tr><td class="mt-column-width-15 mt-noheading" colspan="1" rowspan="1"><p> Commerce Metrics </p></td><td class="mt-column-width-45 mt-noheading" colspan="1" rowspan="1"><p> Returns data about number of visits, orders, checkouts, revenue, new and returning customers, etc. </p></td></tr><tr><td class="mt-column-width-15 mt-noheading" colspan="1" rowspan="1"><p> Existing Customer Campaigns </p></td><td class="mt-column-width-45 mt-noheading" colspan="1" rowspan="1"><p> Returns data about visits, orders, and revenue, broken down by existing customer campaign. </p></td></tr><tr><td class="mt-column-width-15 mt-noheading" colspan="1" rowspan="1"><p> Existing Customer Products </p></td><td class="mt-column-width-45 mt-noheading" colspan="1" rowspan="1"><p> Returns data about existing customer visits, orders, checkouts, and revenue, broken down by product. </p></td></tr><tr><td class="mt-column-width-15 mt-noheading" colspan="1" rowspan="1"><p> Mobile Device Types </p></td><td class="mt-column-width-45 mt-noheading" colspan="1" rowspan="1"><p> Returns data about mobile views, visits, and daily unique visitors, broken down by device type. </p></td></tr><tr><td class="mt-column-width-15 mt-noheading" colspan="1" rowspan="1"><p> Mobile Metrics </p></td><td class="mt-column-width-45 mt-noheading" colspan="1" rowspan="1"><p> Returns metrics about mobile device usage, such as device type, OS, views, visits, and daily unique visitors. </p></td></tr><tr><td class="mt-column-width-15 mt-noheading" colspan="1" rowspan="1"><p> Natural Search Conversion </p></td><td class="mt-column-width-45 mt-noheading" colspan="1" rowspan="1"><p> Returns data about number of visits, orders, and revenue, broken down by natural search keyword. </p></td></tr><tr><td class="mt-column-width-15 mt-noheading" colspan="1" rowspan="1"><p> Natural Search Visits </p></td><td class="mt-column-width-45 mt-noheading" colspan="1" rowspan="1"><p> Returns data about number of visits, page views, and daily unique visitors, broken down by natural search keyword. </p></td></tr><tr><td class="mt-column-width-15 mt-noheading" colspan="1" rowspan="1"><p> New Visitor Best Campaigns </p></td><td class="mt-column-width-45 mt-noheading" colspan="1" rowspan="1"><p> Returns data about visits, orders, revenue, and units, broken down by new visitor campaign. </p></td></tr><tr><td class="mt-column-width-15 mt-noheading" colspan="1" rowspan="1"><p> New Visitor Geo </p></td><td class="mt-column-width-45 mt-noheading" colspan="1" rowspan="1"><p> Returns data about visits, orders, revenue, and units, broken down by region. </p></td></tr><tr><td class="mt-column-width-15 mt-noheading" colspan="1" rowspan="1"><p> New Visitor Geo Country </p></td><td class="mt-column-width-45 mt-noheading" colspan="1" rowspan="1"><p> Returns data about visits, orders, revenue, and units, broken down by country. </p></td></tr><tr><td class="mt-column-width-15 mt-noheading" colspan="1" rowspan="1"><p> New Visitor Keywords </p></td><td class="mt-column-width-45 mt-noheading" colspan="1" rowspan="1"><p> Returns data about visits, orders, revenue, and units, broken down by paid search keyword. </p></td></tr><tr><td class="mt-column-width-15 mt-noheading" colspan="1" rowspan="1"><p> New Visitor Products </p></td><td class="mt-column-width-45 mt-noheading" colspan="1" rowspan="1"><p> Returns data about new customer visits, orders, checkouts, revenue, units, etc., broken down by product. </p></td></tr><tr><td class="mt-column-width-15 mt-noheading" colspan="1" rowspan="1"><p> New Visitor Traffic <br /> Source </p></td><td class="mt-column-width-45 mt-noheading" colspan="1" rowspan="1"><p> Returns data about visits, orders, revenue, and units, broken down by referrer type. </p></td></tr><tr><td class="mt-column-width-15 mt-noheading" colspan="1" rowspan="1"><p> Page Effectiveness </p></td><td class="mt-column-width-45 mt-noheading" colspan="1" rowspan="1"><p> Returns data about page visits, entries and exists, bounces, and bounce rate, broken down by page. </p></td></tr><tr><td class="mt-column-width-15 mt-noheading" colspan="1" rowspan="1"><p> Page Metrics </p></td><td class="mt-column-width-45 mt-noheading" colspan="1" rowspan="1"><p> Returns data about page views, visits, daily unique visitors, and exists, broken down by page. </p></td></tr><tr><td class="mt-column-width-15 mt-noheading" colspan="1" rowspan="1"><p> Paid Search Conversion </p></td><td class="mt-column-width-45 mt-noheading" colspan="1" rowspan="1"><p> Returns data about visits, orders, and revenue, broken down by paid search keyword. </p></td></tr><tr><td class="mt-column-width-15 mt-noheading" colspan="1" rowspan="1"><p> Paid Search Visits </p></td><td class="mt-column-width-45 mt-noheading" colspan="1" rowspan="1"><p> Returns data about page views, daily unique visitors, and visits, broken down by paid search keyword. </p></td></tr><tr><td class="mt-column-width-15 mt-noheading" colspan="1" rowspan="1"><p> Products and Categories </p></td><td class="mt-column-width-45 mt-noheading" colspan="1" rowspan="1"><p> Returns data about visits, orders, and revenue, broken down by product and category. </p></td></tr></tbody></table></td></tr></tbody></table>

#### "Intermediate - Custom" Report Type Options

<table border="1" cellpadding="1" cellspacing="1" class="mt-responsive-table"><thead><tr><th class="mt-column-width-35" colspan="1" rowspan="1"><p> Option </p></th><th class="mt-column-width-65" colspan="1" rowspan="1"><p> Description </p></th></tr></thead><tbody><tr><td class="mt-column-width-35" colspan="1" rowspan="1"><p> Elements </p></td><td class="mt-column-width-65" colspan="1" rowspan="1"><p> Select up to four element names. </p><p> An <em> element </em> is a structure that breaks down a report's metrics data. For example, you can generate a report that breaks down page views (metric) by the browsers used to access the page (element). The resulting report lists page views by browser type. </p><p> By default the Adobe Analytics API only returns the top 10 elements. If you want to view more, you can do so by entering information for the additional elements in the <b> Additional Element Information </b> field. </p><p> For more information about elements, see <a class="link-https" href="https://adobedocs.github.io/analytics-1.4-apis/" target="_blank" title="https://adobedocs.github.io/analytics-1.4-apis/"> [https://adobedocs.github.io/analytics-1.4-apis/](https://adobedocs.github.io/analytics-1.4-apis/) </a>. </p></td></tr><tr><td class="mt-column-width-35" colspan="1" rowspan="1"><p> Additional Element Information </p></td><td class="mt-column-width-65" colspan="1" rowspan="1"><p> Enter any additional element information using the JSON format defined in the API Explorer (<a class="link-https" href="https://adobedocs.github.io/analytics-1.4-apis/" target="_blank" title="https://adobedocs.github.io/analytics-1.4-apis/"> [https://adobedocs.github.io/analytics-1.4-apis/](https://adobedocs.github.io/analytics-1.4-apis/) </a> ). </p><p> For example: </p><p><code> \{"top":50, <br /> "selected":\[], <br /> "classifications":\[], <br /> "id":"page", <br /> "name":"Page"} </code></p><p> This parameter is described in detail later in this topic: <a href="https://knowledge.domo.com/Connect/Connecting_to_Data_with_Connectors/Configuring_Each_Connector/Connectors_for_Analytics/Adobe_Analytics_Advanced_Connector#Understanding_The_.22Additional_Elements.22_Field" target="_blank" title="Adobe Analytics Advanced Connector"> Understanding the Additional Elements field </a>. </p></td></tr><tr><td class="mt-column-width-35" colspan="1" rowspan="1"><p> Segments </p></td><td class="mt-column-width-65" colspan="1" rowspan="1"><p> Select segment definitions for your report. You can select as many segments as you want. For more information about segments, see the API Explorer documentation (<a class="link-https" href="https://adobedocs.github.io/analytics-1.4-apis/" target="_blank" title="https://adobedocs.github.io/analytics-1.4-apis/"> [https://adobedocs.github.io/analytics-1.4-apis/](https://adobedocs.github.io/analytics-1.4-apis/) </a> ). </p><div class="mdx-embed"><Note><p><b> Note: </b> Although you have the ability to select as many segments as you would like, be cautious about what those segments are doing to the overall picture of your data. Selecting segments will change the grouping of your data and can lead to unexpected results. </p></Note></div></td></tr><tr><td class="mt-column-width-35" colspan="1" rowspan="1"><p> Inline Segments </p></td><td class="mt-column-width-65" colspan="1" rowspan="1"><p> Enter inline segment information using the JSON format defined in the API Explorer (<a class="link-https" href="https://adobedocs.github.io/analytics-1.4-apis/" target="_blank" title="https://adobedocs.github.io/analytics-1.4-apis/"> [https://adobedocs.github.io/analytics-1.4-apis/](https://adobedocs.github.io/analytics-1.4-apis/) </a> ). </p><p> Inline segments allow you to create a segment in the connector without having to define it first in Adobe Analytics. For example, if I wanted to segment (filter) the data to show only the Home Page and Shopping Cart, I would populate the inline segmentation window with the below JSON snippet. </p><p><code> \{ <br /> "id": "page", <br /> "selected": \["Home Page", "Shopping Cart"] <br /> } </code><br /></p><p> You can also apply logic to your filtering. </p><p> For more information about inline segments, see <a class="link-https" href="https://adobedocs.github.io/analytics-1.4-apis/" target="_blank" title="https://adobedocs.github.io/analytics-1.4-apis/"> [https://adobedocs.github.io/analytics-1.4-apis/](https://adobedocs.github.io/analytics-1.4-apis/) </a>. </p></td></tr><tr><td class="mt-column-width-35" colspan="1" rowspan="1"><p> Metrics </p></td><td class="mt-column-width-65" colspan="1" rowspan="1"><p> Select up to 30 metrics for your report. For more information about Adobe Analytics metrics, see <a class="link-https" href="https://marketing.adobe.com/developer/documentation/analytics-reporting-1-4/metrics" target="_blank" title="https://marketing.adobe.com/developer/documentation/analytics-reporting-1-4/metrics"> [https://github.com/AdobeDocs/analytics-1.4-apis/blob/master/docs/reporting-api/metrics.md](https://github.com/AdobeDocs/analytics-1.4-apis/blob/master/docs/reporting-api/metrics.md) </a>. </p><p> Some combinations of metrics will lead to errors. Adobe has provided a list of metrics that are blacklisted from being used together. <br /><a class="link-https" href="https://github.com/AdobeDocs/analytics-1.4-apis/blob/master/docs/reporting-api/combinations.md" target="_blank" title="https://github.com/AdobeDocs/analytics-1.4-apis/blob/master/docs/reporting-api/combinations.md"> [https://github.com/AdobeDocs/analytics-1.4-apis/blob/master/docs/reporting-api/combinations.md](https://github.com/AdobeDocs/analytics-1.4-apis/blob/master/docs/reporting-api/combinations.md) </a></p></td></tr><tr><td class="mt-column-width-35" colspan="1" rowspan="1"><p> Date Granularity </p></td><td class="mt-column-width-65" colspan="1" rowspan="1"><p> Select a date grain for the report. This determines whether the data is broken down by day, by week, etc. </p></td></tr><tr><td class="mt-column-width-35" colspan="1" rowspan="1"><p> Duration </p></td><td class="mt-column-width-65" colspan="1" rowspan="1"><p> Specify whether the data in this report is for a single date or a range of dates. </p></td></tr><tr><td class="mt-column-width-35" colspan="1" rowspan="1"><p> Report Date </p></td><td class="mt-column-width-65" colspan="1" rowspan="1"><p> Select whether the data in the report is for a specific date or for a relative date based on the selected <b> Date Granularity </b>. For example, if you selected <b> Date Granularity > Day </b> , you could select <b> Today </b> as your report date. Then, each time the data updated, it would show date for the current date. </p></td></tr><tr><td class="mt-column-width-35" colspan="1" rowspan="1"><p> Date Offset </p></td><td class="mt-column-width-65" colspan="1" rowspan="1"><p> Enter the number of periods back that will be used to offset your relative date. The period is based on your selected Date Granularity. </p><p> For example, if you selected <b> Date Granularity > Day </b> and <b> Report Date > Yesterday </b> , then entered <code> 2 </code> for <b> Date Offset </b> , the report would pull data for three days in the past (yesterday minus two days). </p></td></tr><tr><td class="mt-column-width-35" colspan="1" rowspan="1"><p> Select Specific Date </p></td><td class="mt-column-width-65" colspan="1" rowspan="1"><p> Select the date you want to retrieve data for. </p></td></tr><tr><td class="mt-column-width-35" colspan="1" rowspan="1"><p> Date From </p></td><td class="mt-column-width-65" colspan="1" rowspan="1"><p> Specify whether the first date in your date range is a specific or relative date. You select the last date in your range in <b> Date To </b>. Options in these menus are determined by the selected <b> Date Granularity </b>. </p><p> For example, if you selected <b> Date Granularity > Week </b> , you could then select <b> Date From > Last Week </b> and <b> Date To > This Week </b>. Each time your report updated, it would then show data for this week as well as last week. </p></td></tr><tr><td class="mt-column-width-35" colspan="1" rowspan="1"><p> Date To </p></td><td class="mt-column-width-65" colspan="1" rowspan="1"><p> Specify whether the last date in your date range is a specific or relative date. You select the first date in your range in <b> Date From </b>. Options in these menus are determined by the selected <b> Date Granularity </b>. </p><p> For example, if you selected <b> Date Granularity > Week </b> , you could then select <b> Date From > Last Week </b> and <b> Date To > This Week </b>. Each time your report updated, it would then show data for this week as well as last week. </p></td></tr><tr><td class="mt-column-width-35" colspan="1" rowspan="1"><p> Date From Offset </p></td><td class="mt-column-width-65" colspan="1" rowspan="1"><p> Enter the number of periods back that will be used to offset the first date in your date range. The period is based on your selected <b> Date Granularity </b>. </p><p> For example, if you selected <b> Date Granularity > Week </b> and <b> Date From > Last Week </b> , then entered <code> 2 </code> for <b> Date From Offset </b> , the first date in the date range would be set to three weeks in the past (last week minus two weeks). </p></td></tr><tr><td class="mt-column-width-35" colspan="1" rowspan="1"><p> Date To Offset </p></td><td class="mt-column-width-65" colspan="1" rowspan="1"><p> Enter the number of periods back that will be used to offset the last date in your date range. The period is based on your selected <b> Date Granularity </b>. </p><p> For example, if you selected <b> Date Granularity > Week </b> and <b> Date To > This Week </b> , then entered <code> 2 </code> for <b> Date To Offset </b> , the last date in your date range would be set to two weeks in the past (this week minus two weeks). </p></td></tr><tr><td class="mt-column-width-35" colspan="1" rowspan="1"><p> Select Specific Date From </p></td><td class="mt-column-width-65" colspan="1" rowspan="1"><p> Select the first date in your date range. </p></td></tr><tr><td class="mt-column-width-35" colspan="1" rowspan="1"><p> Select Specific Date To </p></td><td class="mt-column-width-65" colspan="1" rowspan="1"><p> Select the last date in your date range. </p></td></tr><tr><td class="mt-column-width-35" colspan="1" rowspan="1"><p> Time Zone </p></td><td class="mt-column-width-65" colspan="1" rowspan="1"><p> Select the UTC time zone for your data. </p></td></tr><tr><td class="mt-column-width-35" colspan="1" rowspan="1"><p> Include All Time Zones </p></td><td class="mt-column-width-65" colspan="1" rowspan="1"><p> Check this box if you want all time zones included in your report. </p></td></tr><tr><td class="mt-column-width-35" colspan="1" rowspan="1"><p> Backfill </p></td><td class="mt-column-width-65" colspan="1" rowspan="1"><p> Enter the number of periods back (based on the selected <b> Date Granularity </b> ) that should backfill the first time the report is run. </p></td></tr></tbody></table>

#### "Advanced - Query" Report Type Options

<table border="1" cellpadding="1" cellspacing="1" class="mt-responsive-table"><thead><tr><th class="mt-column-width-35" colspan="1" rowspan="1"><p> Option </p></th><th class="mt-column-width-65" colspan="1" rowspan="1"><p> Description </p></th></tr></thead><tbody><tr><td class="mt-column-width-35" colspan="1" rowspan="1"><p> Query </p></td><td class="mt-column-width-65" colspan="1" rowspan="1"><p> Enter an Adobe Analytics Web Service API Explorer Query to pull data for your report. For more information about queries, see <a class="link-https" href="https://adobedocs.github.io/analytics-1.4-apis/" target="_blank" title="https://adobedocs.github.io/analytics-1.4-apis/"> [https://adobedocs.github.io/analytics-1.4-apis/](https://adobedocs.github.io/analytics-1.4-apis/) </a>. </p><p> For example: </p><p><code> \{"reportDescription":\{ <br /> "reportSuiteID":"thankyoudev", <br /> "dateFrom":"2014-09-07", <br /> "dateTo":"2014-09-07", <br /> "dateGranularity":"Day", <br /> "elements":\[ <br /> \{"top":50, <br /> "selected":\[], <br /> "classifications":\[], <br /> "id":"page", <br /> "name":"Page"}], <br /> "metrics":\[ <br /> \{"decimals":0, <br /> "id":"pageviews", <br /> "name":"Page Views"}, <br /> \{"decimals":0, <br /> "id":"visits", <br /> "name":"Visits"}], <br /> "segments":\[], <br /> "locale":"en\_US"}} </code></p></td></tr></tbody></table>

### Other Panes

For information about the remaining sections of the connector interface, including how to configure scheduling, retry, and update options, see [Adding](https://knowledge.domo.com/Connect/Connecting_to_Data_with_Connectors/General_Guide_to_Connecting_with_Connectors/01Adding_a_DataSet_Using_a_Data_Connector "Adding a DataSet Using a Data Connector") [Adding a DataSet Using a Connector](https://domo-support.domo.com/s/article/360042926274?language=en_US "Adding a DataSet Using a Connector").

## Understanding The "Additional Elements" Field

The following JSON snippet contains all of the code needed to utilize the **Additional Elements** parameter of the connector. You just need to replace *string* & *int* with the values you choose. You can also delete the sections of this JSON that you will not be using. Examples on how to use this will be discussed in the sections that follow.

```json theme={"dark"}
{

"id":"

 string

",

"classification":"

 string

",

"top":"

 int

",

"startingWith":"

 int

",

"search":{

"type":"

 string

",

"keywords":[

"

 string

"

],

}

}
```

### Using Additional Elements to Increase Your Top Results

By default, the Adobe Analytics API only return the top 10 results for the selected element. You can increase the number of top results using **Additional Elements**. For example, to increase the limit to 100 you would add the following to the **Additional Elements** field:

`{“top”:100, “id”:”page”}`

*"* id" is the ID of the element you want. There is no upper limit to the “Top” number but the less you pull back in using the query, the more efficient it will be. You can do this for multiple elements by separating them with a comma.

```json theme={"dark"}
{“top”:100,

“id”:”page”},

{“top”:100,

“id”:”region”}
```

### Using Additional Elements to Search for Keywords in Elements

You can use **Additional Elements** to search for keywords in elements by inputting properly formatted JSON. You can search using AND, OR, and NOT operators. Below is a table that describes these operators.

<table class="mt-responsive-table"><thead><tr><th class="mt-column-width-35" colspan="1" rowspan="1"><p> Value </p></th><th class="mt-column-width-65" colspan="1" rowspan="1"><p> Description </p></th></tr></thead><tbody><tr><td class="mt-column-width-35" colspan="1" rowspan="1"><p> AND </p></td><td class="mt-column-width-65" colspan="1" rowspan="1"><p> Combines multiple search terms to return results that have all of the search keywords. </p></td></tr><tr><td class="mt-column-width-35" colspan="1" rowspan="1"><p> OR </p></td><td class="mt-column-width-65" colspan="1" rowspan="1"><p> Combines multiple search terms to return results that match any of the search keywords. </p></td></tr><tr><td class="mt-column-width-35" colspan="1" rowspan="1"><p> NOT </p></td><td class="mt-column-width-65" colspan="1" rowspan="1"><p> Excludes the selected keywords from the search results. </p></td></tr></tbody></table>

The following example searches for the top three pages that have “help” OR “faq” in the page name/URL. You can also do an AND search by replacing the “OR” with “AND”.

```json theme={"dark"}
{

"id": "page",

"top": 3,

"search": {

"type": "OR",

"keywords": ["help","faq"]

}

}
```

You can also use special characters like the following to increase the power of your search:

<table class="mt-responsive-table"><thead><tr><th class="mt-column-width-35" colspan="1" rowspan="1"><p> Special Character </p></th><th class="mt-column-width-65" colspan="1" rowspan="1"><p> Description </p></th></tr><tr><td class="mt-column-width-35" colspan="1" rowspan="1"><p> \* </p></td><td class="mt-column-width-65" colspan="1" rowspan="1"><p> Wild Card. Add to the beginning or end of keywords (e.g. <code> page\*.html </code> ). </p></td></tr><tr><td class="mt-column-width-35" colspan="1" rowspan="1"><p> ^ </p></td><td class="mt-column-width-65" colspan="1" rowspan="1"><p> Starts With. Add to the beginning of your keyword/string to find results that start with this keyword/string (e.g. <code> ^http\:// </code> ). </p></td></tr><tr><td class="mt-column-width-35" colspan="1" rowspan="1"><p> \$ </p></td><td class="mt-column-width-65" colspan="1" rowspan="1"> Ends With. Add to the end of your keyword/string to find results that end with this keyword/string (e.g. <code>.html\$ </code> ) </td></tr></thead></table>

Here is an example of a search that uses these characters:

```json theme={"dark"}
{

"id": "page",

"top": 3,

"search": {

"type": "OR",

"keywords": [“help*","^faq"]

}

}
```

Exact keyword matches can be obtained by placing the "starts with" and "ends with" special characters at the beginning and ending of the keyword:

```json theme={"dark"}
{

"id": "page",

"top": 3,

"search": {

"type": "OR",

"keywords": ["^faq$"]

}

}
```

### Adding Classifications to the JSON Syntax

If you wish to do any of the above advanced functions with a SAINT Classification then you need to add the classification to the JSON syntax, as shown in the following example:

```json theme={"dark"}
{

"id": “page",

“classification”:”region”,

"top": 3

}
```

## Troubleshooting

### Unique Metrics

One of the most frequently encountered issues with the Adobe Analytics connector involves unique metrics, such as Unique Visitors, Unique Pageviews, etc. Unique metrics are non-additive and need to be pulled from the connector at the same level of granularity they will be viewed at. This is because if you pull these metrics in a different granularity when the numbers are rolled up, they will no longer be accurate. For example, say we have a visitor to our site, Visitor 1. This individual visits the site once a day for a week. When we go to report how many people visited the site in a week, if we pull the data using a day granularity, Visitor 1 is counted 7 times. However, if we pull the data using a week granularity, Visitor 1 is only counted once, giving us an accurate count of how many individuals visited the page in a week but NOT how many times the site was visited.

### API Explorer

Adobe Analytics has an API Explorer that you can use to run your report and check the results. It is available at [https://adobedocs.github.io/analytics-1.4-apis/](https://adobedocs.github.io/analytics-1.4-apis/ "https://adobedocs.github.io/analytics-1.4-apis/").

## Tips and Tricks

* Make sure to leverage the Additional Element Information field, as explained above.
* Classifications are identified by an “->” in the Element list.
* The fewer elements per data source, the better.
* Try and stay below 10 metrics per data source.
* Stagger the runtimes of your data sources.
* Learn how to use the Adobe Analytics API explorer.
* Reference the Adobe API documentation (URL is provided under
  [Helpful Links](/s/article/360043433593 "Adobe Analytics Advanced Connector") ).
* Segments will lengthen runtimes.
* Although you have the ability to select as many segments as you would like, be cautious about what those segments are doing to the overall picture of your data. Selecting segments will change the grouping of your data and can lead to unexpected results.
* sProps and eVars cannot be pulled together.

## FAQ

<AccordionGroup>
  <Accordion title="Q: When should I use this connector?">
    A: Connect your customer insight data to Domo using V1.4 of Adobe's API and authenticating using OAuth.
  </Accordion>

  <Accordion title="Q: I successfully created an Adobe Analytics OAuth account, but about two weeks later I got an alert: &#x22;Account Adobe Analytics OAuth Account has been Deactivated&#x22;. Why is this happening and what can I do about it?">
    A: Adobe Analytics OAuth has a refresh token that expires after two weeks (see [Adobe documentation](https://www.adobe.io/authentication/auth-methods.html#!AdobeDocs/adobeio-auth/master/OAuth/OAuth.md#exchanging-refresh-tokens "https://www.adobe.io/authentication/auth-methods.html#!AdobeDocs/adobeio-auth/master/OAuth/OAuth.md#exchanging-refresh-tokens") for details.) This causes Adobe OAuth to no longer authenticate after two weeks. This is an Adobe limitation. Older datasets use WSSE authentication (Username: Company, Password), but Adobe has deprecated WSSE authentication. Please contact Adobe support to request a resolution to this issue.

    ```
    Note: JWT connector which is recommended by Adobe does not need to authenticate after two weeks
    ```
  </Accordion>

  <Accordion title="Q: Do I need a certain kind of account with the data service to set up the connector?">
    A: It is best if your account has the Admin access. At the very least you need access to the report suites you want as well as access to retrieve elements, metrics and segments from the API.
  </Accordion>

  <Accordion title="Q: My Adobe Analytics OAuth datasets are failing intermittently and displaying unhelpful error messages like &#x22;Unable to complete report at this time. Please try again later.&#x22; What should I do?">
    A: This error originates on Adobe ’s end. Unfortunately, it is nothing we at Domo have direct control over, but we are working with Adobe to improve these types of errors. That said, you can take steps to alleviate the occurrence of these errors, which include reducing the number of connectors, the frequency at which they try to pull data, and the size of their requests. Attempting to schedule requests to run at different times can also help. Another possible solution is to use the “retry” setting in the connector.
  </Accordion>

  <Accordion title="Q: What do I do if I need to include more than 4 elements in my Adobe Analytics OAuth DataSet?">
    A: Run Adobe's Data Warehouse reports. These do not use the Domo connector; rather they leverage scheduled emails to import data into Domo. These reports can use SFTP. Note that results may vary slightly from the Adobe Analytics front end.
  </Accordion>

  <Accordion title="Q: My report takes a long time. How do I speed up my report?">
    A: In case of the Intermediate-Custom report, the number of elements selected and the parameters in the Additional Element Information text box can make a big difference in your report performance. Select the minimum number of elements needed.

    It is also possible to have a number of reports queued up in Adobe Analytics that is preventing your report from being finished. You can use the Queue report to see what reports are currently being processed by Adobe.

    If you have a large number of datasets, try to stagger their execution times so that the datasets will not clog up Adobe's queue all at once.
  </Accordion>

  <Accordion title="Q: Is there a way to see what data is being returned from the Adobe Analytics API?">
    A: Adobe Analytics has an API Explorer that you can use to run your report and check the results. It is available at [https://adobedocs.github.io/analytics-1.4-apis/](https://adobedocs.github.io/analytics-1.4-apis/ "https://adobedocs.github.io/analytics-1.4-apis/").
  </Accordion>

  <Accordion title="Q: Is there any limit to the number of Elements that can be retrieved?">
    A: Adobe's API has a 4 element limit and only 50000 rows per element can be retrieved.
  </Accordion>

  <Accordion title="Q: What is the workflow for pulling data from Adobe?">
    A: The process used by Domo to pull Adobe data is as follows:

    1. **Queue report** -- Domo sends Adobe the parameters of the desired report. [https://github.com/AdobeDocs/analytics-1.4-apis/blob/master/docs/reporting-api/methods/r\_Queue.md](https://github.com/AdobeDocs/analytics-1.4-apis/blob/master/docs/reporting-api/methods/r_Queue.md "https://github.com/AdobeDocs/analytics-1.4-apis/blob/master/docs/reporting-api/methods/r_Queue.md")
    2. **Get report ID** -- Domo receives a report ID.
    3. **Wait for report to be done** -- Domo watches Adobe's queue and wait for the report to be done. [https://github.com/AdobeDocs/analytics-1.4-apis/blob/master/docs/reporting-api/methods/r\_GetQueue.md](https://github.com/AdobeDocs/analytics-1.4-apis/blob/master/docs/reporting-api/methods/r_GetQueue.md "https://github.com/AdobeDocs/analytics-1.4-apis/blob/master/docs/reporting-api/methods/r_GetQueue.md")
    4. **Pull report** -- When the report no longer appears in the queue, Domo uses the report ID received in step 2 to ask for the data of the report. [https://github.com/AdobeDocs/analytics-1.4-apis/blob/master/docs/reporting-api/methods/r\_Get.md](https://github.com/AdobeDocs/analytics-1.4-apis/blob/master/docs/reporting-api/methods/r_Get.md "https://github.com/AdobeDocs/analytics-1.4-apis/blob/master/docs/reporting-api/methods/r_Get.md")
  </Accordion>
</AccordionGroup>

## Helpful Links

The following links provide access to pages on Adobe's website with helpful information:

API Overview: [https://adobedocs.github.io/analytics-1.4-apis/](https://adobedocs.github.io/analytics-1.4-apis/ "https://adobedocs.github.io/analytics-1.4-apis/")

Adobe Analytics API Explorer: [https://adobedocs.github.io/analytics-1.4-apis/](https://adobedocs.github.io/analytics-1.4-apis/ "https://adobedocs.github.io/analytics-1.4-apis/")

Inline Segmentation: [https://adobedocs.github.io/analytics-1.4-apis/](https://adobedocs.github.io/analytics-1.4-apis/ "https://adobedocs.github.io/analytics-1.4-apis/")

High-Level Schema Overview: [https://adobedocs.github.io/analytics-1.4-apis/](https://adobedocs.github.io/analytics-1.4-apis/ "https://adobedocs.github.io/analytics-1.4-apis/")

Pathing and Fallout Reports: [https://adobedocs.github.io/analytics-1.4-apis/](https://adobedocs.github.io/analytics-1.4-apis/ "https://adobedocs.github.io/analytics-1.4-apis/")

Data Warehouse Reports: [https://blogs.adobe.com/digitalmarketing/analytics/omniture-datawarehouse-inside-omniture-sitecatalyst/](https://blogs.adobe.com/digitalmarketing/analytics/omniture-datawarehouse-inside-omniture-sitecatalyst/)
