> ## Documentation Index
> Fetch the complete documentation index at: https://domoinc-openapi-sync-dataflows.mintlify.site/llms.txt
> Use this file to discover all available pages before exploring further.

# Sprinklr Advanced Connector

## Intro

Sprinklr is a company that develops and markets a social software platform, also called Sprinklr, that provides social media marketing, social advertising, content management, collaboration, advocacy and social media monitoring for large enterprises. Use Domo's Sprinklr Advanced connector to retrieve information about post insights, bootstrap info, profiles, and more, as well as create custom queries. For more information about the Sprinklr API, visit their website. ([https://dev.sprinklr.com](https://dev.sprinklr.com "https://dev.sprinklr.com") ).

The Sprinklr Advanced connector is exactly the same as the [standard Sprinklr connector](/s/article/360043431993 "Sprinklr Connector") except that it contains one additional report type—"Custom Query." This report allows you to enter a query definition from the Sprinklr UI to duplicate the behavior of a report in Sprinklr.

The Sprinklr Advanced connector is a "Cloud App" connector, meaning it retrieves data stored in the cloud. In the Data Center, you can access the connector page for this and other Cloud App connectors by clicking **Cloud App** in the toolbar at the top of the window.

You connect to your Sprinklr account in the Data Center. This topic discusses the fields and menus that are specific to the Sprinklr Advanced connector user interface. General information for adding DataSets, setting update schedules, and editing DataSet information is discussed in [Adding a DataSet Using a Connector](/s/article/360042926274 "Adding a DataSet Using a Connector").

<table class="mt-responsive-table" data-aura-rendered-by="33:195;a">
  <tbody>
    <tr>
      <td class="mt-noheading" colspan="1" rowspan="1">
        <p>
          <b> Primary Use Cases </b>
        </p>
      </td>

      <td class="mt-noheading" colspan="1" rowspan="1">
        <p>
          {" "}

          Sprinklr allows an organization to aggregate their various social platform accounts into one place and track social
          media KPIs.{" "}
        </p>
      </td>
    </tr>

    <tr>
      <td class="mt-noheading" colspan="1" rowspan="1">
        <p>
          <b> Primary Metrics </b>
        </p>
      </td>

      <td class="mt-noheading" colspan="1" rowspan="1">
        <ul>
          <li>
            <p> Engagements (ie, Facebook Likes, Twitter Loves, LinkedIn Shares) </p>
          </li>

          <li>
            <p> Reach </p>
          </li>

          <li>
            <p> Impressions </p>
          </li>
        </ul>
      </td>
    </tr>

    <tr>
      <td class="mt-noheading" colspan="1" rowspan="1">
        <p>
          <b> Primary Company Roles </b>
        </p>
      </td>

      <td class="mt-noheading" colspan="1" rowspan="1">
        <p> Social marketers </p>
      </td>
    </tr>

    <tr>
      <td class="mt-noheading" colspan="1" rowspan="1">
        <p>
          <b> Average Implementation Time </b>
        </p>
      </td>

      <td class="mt-noheading" colspan="1" rowspan="1">
        <p>
          {" "}

          Application process to access the API could take 2 weeks. Actual implementation time once authenticated takes about
          5 hours.{" "}
        </p>
      </td>
    </tr>

    <tr>
      <td class="mt-noheading" colspan="1" rowspan="1">
        <p>
          <b> Ease of Use (on a 1-to-10 scale with 1 being easiest) </b>
        </p>
      </td>

      <td class="mt-noheading" colspan="1" rowspan="1">
        <p> 7 </p>
      </td>
    </tr>
  </tbody>
</table>

## Best Practices

Many of the report options require manual configuration. More information about these options can be found in the API documentation. For example, the "Account Insights," "Post Insights," and "Paid Ad Stats Insights" reports require you to fill in a groupby field. Whatever you enter in this field becomes the dimensions in the report. Available columns that can be used in the groupby are listed in the API documentation. The connector tool tips demonstrate the appropriate format that is required for each configuration step.

## Prerequisites

To connect to your Sprinklr account and create a DataSet, you must have a Sprinklr client ID and client secret.

To get access to the API, you must submit an application and be approved by Sprinklr. Steps to complete this application process can be found here: [https://dev.sprinklr.com](https://dev.sprinklr.com "https://dev.sprinklr.com")

You must also set up a redirect\_uri to [https://oauth.domo.com/api/data/v1/oauth/providers/sprinklr/exchange](https://oauth.domo.com/api/data/v1/oauth/providers/sprinklr/exchange) when creating the API key.

Once access is confirmed, you will be able to authenticate using your client ID and client secret.

## Connecting to Your Sprinklr Account

This section enumerates the options in the **Credentials** and **Details** panes in the Sprinklr Connector page. The components of the other panes in this page, **Scheduling** and **Name & Describe Your DataSet**, are universal across most connector types and are discussed in greater length in [Adding a DataSet Using a Connector](/s/article/360042926274 "Adding a DataSet Using a Connector").

## Credentials Pane

This pane contains fields for entering credentials to connect to your Sprinklr account. The following table describes what is needed for each field:

<table border="1" cellpadding="1" cellspacing="1" data-aura-rendered-by="33:195;a">
  <thead>
    <tr>
      <th colspan="1" rowspan="1">
        <p> Field </p>
      </th>

      <th colspan="1" rowspan="1">
        <p> Description </p>
      </th>
    </tr>
  </thead>

  <tbody>
    <tr>
      <td colspan="1" rowspan="1">
        <p> Environment </p>
      </td>

      <td colspan="1" rowspan="1">
        <p> Select the Sprinklr environment you want to connect to, either sandbox or production. </p>
      </td>
    </tr>

    <tr>
      <td colspan="1" rowspan="1">
        <p> Client ID </p>
      </td>

      <td colspan="1" rowspan="1">
        <p> Enter your Sprinklr client ID. </p>
      </td>
    </tr>

    <tr>
      <td colspan="1" rowspan="1">
        <p> Client Secret </p>
      </td>

      <td colspan="1" rowspan="1">
        <p> Enter your Sprinklr client secret. </p>
      </td>
    </tr>
  </tbody>
</table>

For more information about authentication, see "Prerequisites," above.

Once you have entered valid Sprinklr credentials, you can use the same account any time you go to create a new Sprinklr DataSet. You can manage connector accounts in the **Accounts** tab in the Data Center. For more information about this tab, see [Manage Connector/Adapter Accounts](/s/article/360042926054 "Manage Connector/Adapter Accounts").

## Details Pane

This pane contains a primary **Report** menu in which you select a report type, along with various other menus and fields which may appear depending on the selected report type.

<table border="1" cellpadding="1" cellspacing="1" data-aura-rendered-by="33:195;a">
  <thead>
    <tr>
      <th colspan="1" rowspan="1">
        <p>
          <b> Menu </b>
        </p>
      </th>

      <th colspan="1" rowspan="1">
        <p>
          <b> Description </b>
        </p>
      </th>
    </tr>
  </thead>

  <tbody>
    <tr>
      <td colspan="1" rowspan="1">
        <p> Report </p>
      </td>

      <td colspan="1" rowspan="1">
        <p> Select a Sprinklr report. The following reports are available: </p>

        <table border="1" cellpadding="1" cellspacing="1">
          <tbody>
            <tr>
              <td colspan="1" rowspan="1">
                <p> Account Insights </p>
              </td>

              <td colspan="1" rowspan="1">
                <p> Returns account-level information. </p>
              </td>
            </tr>

            <tr>
              <td colspan="1" rowspan="1">
                <p> Bootstrap Info </p>
              </td>

              <td colspan="1" rowspan="1">
                <p> Returns static data for various resources. </p>
              </td>
            </tr>

            <tr>
              <td colspan="1" rowspan="1">
                <p> Custom Metric Information </p>
              </td>

              <td colspan="1" rowspan="1">
                <p> Returns information about user-defined custom metrics. </p>
              </td>
            </tr>

            <tr>
              <td colspan="1" rowspan="1">
                <p> Custom Query </p>
              </td>

              <td colspan="1" rowspan="1">
                <p>
                  {" "}

                  Enter a query definition taken from the Sprinklr UI to duplicate the behavior of a Sprinklr report.{" "}
                </p>

                <p>
                  <a href="https://dev.sprinklr.com/report-read-v1" target="_blank" title="https://dev.sprinklr.com/report-read-v1">
                    {" "}

                    [https://dev.sprinklr.com/report-read-v1\{](https://dev.sprinklr.com/report-read-v1\{)" "}
                  </a>
                </p>
              </td>
            </tr>

            <tr>
              <td colspan="1" rowspan="1">
                <p> Dashboard Column </p>
              </td>

              <td colspan="1" rowspan="1">
                <p> Returns details on the requested monitoring dashboard column. </p>
              </td>
            </tr>

            <tr>
              <td colspan="1" rowspan="1">
                {" "}

                Listening Stream{" "}
              </td>

              <td colspan="1" rowspan="1">
                {" "}

                Returns the message stream associated with each message, containing the required information{" "}
              </td>
            </tr>

            <tr>
              <td colspan="1" rowspan="1">
                {" "}

                Listening Topic Configuration{" "}
              </td>

              <td colspan="1" rowspan="1">
                {" "}

                Returns the list of all available configured topic groups and topics{" "}
              </td>
            </tr>

            <tr>
              <td colspan="1" rowspan="1">
                {" "}

                Listening Widget{" "}
              </td>

              <td colspan="1" rowspan="1">
                {" "}

                Returns a single widget. Widgets are the names of the graphs or charts created to show listening data and
                analytics in visually appealing formats.{" "}
              </td>
            </tr>

            <tr>
              <td colspan="1" rowspan="1">
                {" "}

                Paid Ad Stat Insights{" "}
              </td>

              <td colspan="1" rowspan="1">
                {" "}

                Returns statistics about paid ads.{" "}
              </td>
            </tr>

            <tr>
              <td colspan="1" rowspan="1">
                <p> Post Insights </p>
              </td>

              <td colspan="1" rowspan="1">
                <p> Returns insights for the published brand posts. </p>

                <p>
                  {" "}

                  For a list of acceptable columns for this report, see <br />

                  <a href="https://dev.sprinklr.com/post-insights-report-v1" target="_blank" title="https://dev.sprinklr.com/post-insights-report-v1">
                    {" "}

                    [https://dev.sprinklr.com/post-insights-report-v1\{](https://dev.sprinklr.com/post-insights-report-v1\{)" "}
                  </a>
                </p>
              </td>
            </tr>

            <tr>
              <td colspan="1" rowspan="1">
                <p> Profile Conversion Data </p>
              </td>

              <td colspan="1" rowspan="1">
                <p> Returns messages in a conversation for a given user ID. </p>
              </td>
            </tr>

            <tr>
              <td colspan="1" rowspan="1">
                <p> Profile Details </p>
              </td>

              <td colspan="1" rowspan="1">
                <p> Returns the profile details of the requested social profile. </p>
              </td>
            </tr>

            <tr>
              <td colspan="1" rowspan="1">
                <p> Stream Feed </p>
              </td>

              <td colspan="1" rowspan="1">
                <p>
                  {" "}

                  Returns the messages for the requested <b> Stream ID </b>. Note that since the column can be defined with
                  various filtering options, the API returns only the filtered messages if the column was configured with
                  filters. The Stream Feed API is generic where the column can represent different types of feed including
                  inbox, workflow or outbound messages.{" "}
                </p>
              </td>
            </tr>
          </tbody>
        </table>
      </td>
    </tr>

    <tr>
      <td colspan="1" rowspan="1">
        <p> Aggregate Function </p>
      </td>

      <td colspan="1" rowspan="1">
        {" "}

        Select how you would like the data in the report to be aggregated.{" "}
      </td>
    </tr>

    <tr>
      <td colspan="1" rowspan="1">
        {" "}

        Measurement Names{" "}
      </td>

      <td colspan="1" rowspan="1">
        {" "}

        Select all the measurements you want to retrieve data for.{" "}
      </td>
    </tr>

    <tr>
      <td colspan="1" rowspan="1">
        {" "}

        Group By Options{" "}
      </td>

      <td colspan="1" rowspan="1">
        <p>
          {" "}

          Enter the desired
          <span class="mt-font-courier-new"> groupby
          </span> options in the format

          <span class="mt-font-courier-new">
            {" "}

            (columnName,dimensionName,groupType,detail=value){" "}
          </span>

          .{" "}
        </p>

        <p>
          {" "}

          For example:

          <span class="mt-font-courier-new">
            {" "}

            ("MyAccountId",ACCOUNT\_ID,FIELD),(date,DATE\_HISTOGRAM,interval=1w){" "}
          </span>
        </p>
      </td>
    </tr>

    <tr>
      <td colspan="1" rowspan="1">
        {" "}

        Filter Options{" "}
      </td>

      <td colspan="1" rowspan="1">
        <p>
          {" "}

          Enter the desired filter options in the format

          <span class="mt-font-courier-new">
            {" "}

            (dimensionName,filterType,\[value1,value2],detail=value).{" "}
          </span>
        </p>

        <p>
          {" "}

          For example:

          <span class="mt-font-courier-new">
            {" "}

            (SN\_TYPE,IN,\[FACEBOOK]),(CLIENT\_ID,IN,\[62]),(ACCOUNT\_ID,IN,\[3051,553,565]){" "}
          </span>
        </p>
      </td>
    </tr>

    <tr>
      <td colspan="1" rowspan="1">
        {" "}

        Measurement Options{" "}
      </td>

      <td colspan="1" rowspan="1">
        {" "}

        Select measurement options for additional result calculations.{" "}
      </td>
    </tr>

    <tr>
      <td colspan="1" rowspan="1">
        <p> Duration </p>
      </td>

      <td colspan="1" rowspan="1">
        <p> Select whether you want to pull data for a specific date or a date range. </p>
      </td>
    </tr>

    <tr>
      <td colspan="1" rowspan="1">
        <p> Report Date </p>
      </td>

      <td colspan="1" rowspan="1">
        <p> Select whether the report data is for a specific date or for a relative number of days back from today. </p>
      </td>
    </tr>

    <tr>
      <td colspan="1" rowspan="1">
        <p> Select Specific Date </p>
      </td>

      <td colspan="1" rowspan="1">
        <p> Select the date for the report. </p>
      </td>
    </tr>

    <tr>
      <td colspan="1" rowspan="1">
        <p> Days Back </p>
      </td>

      <td colspan="1" rowspan="1">
        <p> Enter the number of past days that should appear in the report. </p>
      </td>
    </tr>

    <tr>
      <td colspan="1" rowspan="1">
        <p> Start Date </p>
      </td>

      <td colspan="1" rowspan="1">
        <p>
          {" "}

          Specify whether the first date in your date range is a specific or relative date. You select the last date in your
          range in <b> End Date </b>.{" "}
        </p>
      </td>
    </tr>

    <tr>
      <td colspan="1" rowspan="1">
        <p> End Date </p>
      </td>

      <td colspan="1" rowspan="1">
        <p>
          {" "}

          Specify whether the second date in your date range is a specific or relative date. You select the first date in
          your range in <b> Start Date </b>.{" "}
        </p>
      </td>
    </tr>

    <tr>
      <td colspan="1" rowspan="1">
        <p> Select Specific Start Date </p>
      </td>

      <td colspan="1" rowspan="1">
        <p> Select the first date in your date range. </p>
      </td>
    </tr>

    <tr>
      <td colspan="1" rowspan="1">
        <p> Select Specific End Date </p>
      </td>

      <td colspan="1" rowspan="1">
        <p> Select the second date in your date range. </p>
      </td>
    </tr>

    <tr>
      <td colspan="1" rowspan="1">
        <p> Days Back to Start From </p>
      </td>

      <td colspan="1" rowspan="1">
        <p>
          {" "}

          Enter the number of the farthest day back that should be represented in the report. Combine with

          <b>
            {" "}

            Days Back to End At{" "}
          </b>

          to create a range of represented days.{" "}
        </p>

        <p>
          {" "}

          For example, if you entered
          <span class="mt-font-courier-new"> 10
          </span> for

          <b>
            {" "}

            Days Back to Start From{" "}
          </b>

          and <span class="mt-font-courier-new"> 5 </span> for <b> Days Back to End At </b>, the report would contain
          data for 10 days ago up until 5 days ago.{" "}
        </p>
      </td>
    </tr>

    <tr>
      <td colspan="1" rowspan="1">
        <p> Days Back to End At </p>
      </td>

      <td colspan="1" rowspan="1">
        <p>
          {" "}

          Enter the number of the most recent day back that should be represented in the report. Combine with

          <b>
            {" "}

            Days Back to Start From{" "}
          </b>

          to create a range of represented days.{" "}
        </p>

        <p>
          {" "}

          For example, if you entered
          <span class="mt-font-courier-new"> 10 </span> for

          <b>
            {" "}

            Days Back to Start From{" "}
          </b>

          and <span class="mt-font-courier-new"> 5 </span> for <b> Days Back to End At </b>, the report would contain
          data for 10 days ago up until 5 days ago.{" "}
        </p>
      </td>
    </tr>

    <tr>
      <td colspan="1" rowspan="1">
        {" "}

        Select Resources{" "}
      </td>

      <td colspan="1" rowspan="1">
        {" "}

        Select all resources you want to retrieve data for.{" "}
      </td>
    </tr>

    <tr>
      <td colspan="1" rowspan="1">
        {" "}

        Select Reports{" "}
      </td>

      <td colspan="1" rowspan="1">
        {" "}

        Select all reports you want to retrieve custom metric information for.{" "}
      </td>
    </tr>

    <tr>
      <td colspan="1" rowspan="1">
        {" "}

        Dashboard Name{" "}
      </td>

      <td colspan="1" rowspan="1">
        {" "}

        Enter the dashboard name (e.g. <span class="mt-font-courier-new"> AutoDashboard </span> ).{" "}
      </td>
    </tr>

    <tr>
      <td colspan="1" rowspan="1">
        {" "}

        Column Name{" "}
      </td>

      <td colspan="1" rowspan="1">
        {" "}

        Enter the column name (e.g. <span class="mt-font-courier-new"> fbinbox </span> ).{" "}
      </td>
    </tr>

    <tr>
      <td colspan="1" rowspan="1">
        {" "}

        Channel Type for the Profile{" "}
      </td>

      <td colspan="1" rowspan="1">
        {" "}

        Enter the channel type for the profile (e.g. <span class="mt-font-courier-new"> FACEBOOK </span> ).{" "}
      </td>
    </tr>

    <tr>
      <td colspan="1" rowspan="1">
        {" "}

        Profile ID of Social Channel{" "}
      </td>

      <td colspan="1" rowspan="1">
        {" "}

        Enter the unique profile ID of the social channel (e.g.

        <span class="mt-font-courier-new">
          {" "}

          215244391952058{" "}
        </span>

        ).{" "}
      </td>
    </tr>

    <tr>
      <td colspan="1" rowspan="1">
        {" "}

        Stream{" "}
      </td>

      <td colspan="1" rowspan="1">
        {" "}

        Enter the ID for the stream you want to retrieve data for.{" "}
      </td>
    </tr>

    <tr>
      <td colspan="1" rowspan="1">
        {" "}

        Widget Type{" "}
      </td>

      <td colspan="1" rowspan="1">
        {" "}

        Select the type of listening widget you want to retrieve data for (distribution, trend, etc.).{" "}
      </td>
    </tr>

    <tr>
      <td colspan="1" rowspan="1">
        {" "}

        Columns to Expand (Optional){" "}
      </td>

      <td colspan="1" rowspan="1">
        {" "}

        Enter a comma-separated list of columns you want to expand into multiple columns. These are columns normally returned
        as "List" or "Object."{" "}
      </td>
    </tr>

    <tr>
      <td colspan="1" rowspan="1">
        {" "}

        Dimension{" "}
      </td>

      <td colspan="1" rowspan="1">
        {" "}

        Select the first dimension you want to show in your "Listening Widget" report.{" "}
      </td>
    </tr>

    <tr>
      <td colspan="1" rowspan="1">
        {" "}

        Custom Field Name{" "}
      </td>

      <td colspan="1" rowspan="1">
        {" "}

        Enter the custom field name for your selected dimension.{" "}
      </td>
    </tr>

    <tr>
      <td colspan="1" rowspan="1">
        {" "}

        Other Dimension{" "}
      </td>

      <td colspan="1" rowspan="1">
        {" "}

        Select the second dimension you want to show in your "Listening Widget" report.{" "}
      </td>
    </tr>

    <tr>
      <td colspan="1" rowspan="1">
        {" "}

        Subtype{" "}
      </td>

      <td colspan="1" rowspan="1">
        {" "}

        Select the subtype of users you want to retrieve data for in your "Listening Widget" report.{" "}
      </td>
    </tr>

    <tr>
      <td colspan="1" rowspan="1">
        <p> Expand Lists </p>
      </td>

      <td colspan="1" rowspan="1">
        <p>
          {" "}

          Choose whether you want to expand columns that contain lists. If you choose this option, your DataSet may contain
          multiple rows for a single post.{" "}
        </p>
      </td>
    </tr>

    <tr>
      <td colspan="1" rowspan="1">
        <p> Query </p>
      </td>

      <td colspan="1" rowspan="1">
        <p> Enter a custom query to pull a Sprinklr report into Domo. </p>
      </td>
    </tr>
  </tbody>
</table>

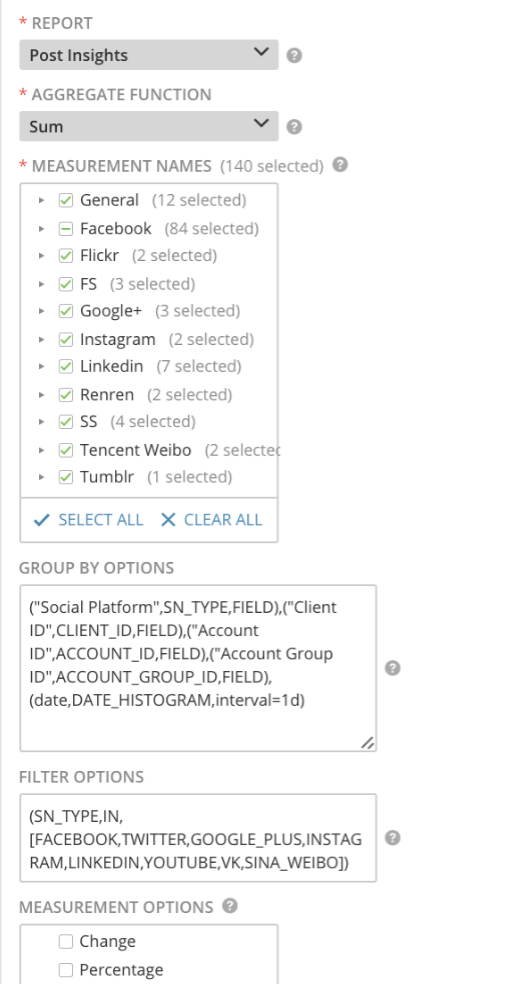
The following screenshot shows an example configuration for the "Post Insights" report:

<Frame>
  <img alt="" src="https://mintcdn.com/domoinc-openapi-sync-dataflows/Ii_OEK7nN-EzkrX1/images/kb/ka0Vq00000074Rt-00N5w00000Ri7BU-0EM5w000005vO2V.png?fit=max&auto=format&n=Ii_OEK7nN-EzkrX1&q=85&s=034f2cf52daa3e486f053b76c57e8eb5" style={{ width: 510, height: 984 }} width="510" height="984" data-path="images/kb/ka0Vq00000074Rt-00N5w00000Ri7BU-0EM5w000005vO2V.png" />
</Frame>

## Other Panes

For information about the remaining sections of the connector interface, including how to configure scheduling, retry, and update options, see [Adding a DataSet Using a Data Connector](/s/article/360042926274 "Adding a DataSet Using a Data Connector").

## Troubleshooting

The most commonly occurring issue with this connector relates to filters. Each report in Sprinklr is filtered and run on a separate query that cleans the Sprinklr data displayed in the reports on the Sprinklr website. When setting up the connector, you *must* use these same filters; otherwise, data will be duplicated or missing. To do this, you must use the API call that is in the backend of a Sprinklr Report.

To access this code or to find the filters and backend report to pull from the connector, do the following:

1. Open the Chrome browser.

2. Right-click in the browser and select **Inspect**.

3. In the developer screen, navigate to the **Network** tab.

4. Refresh your screen on the Sprinklr report page.
   This causes several elements to appear under the **Name** column.

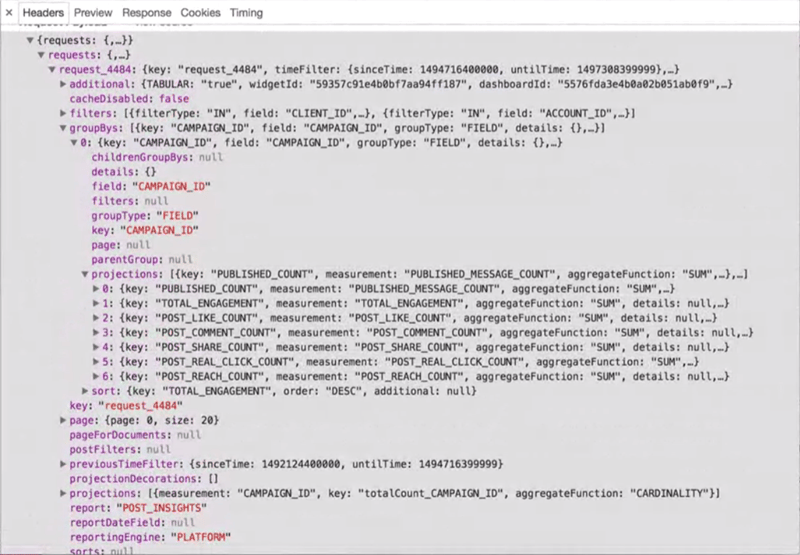
5. Search through the queries and find the corresponding report or data you want to replicate.

6. Select the query and search under **requests** to find all the inputs you need to enter into the Domo Connector.
   <Frame>
     <img alt="sprinklr1__1_.png" src="https://mintcdn.com/domoinc-openapi-sync-dataflows/Ii_OEK7nN-EzkrX1/images/kb/ka0Vq00000074Rt-00N5w00000Ri7BU-0EM5w000005vO2W.png?fit=max&auto=format&n=Ii_OEK7nN-EzkrX1&q=85&s=599cef36bbc63f7e7c50356c2ea1c33f" width="800" height="555" data-path="images/kb/ka0Vq00000074Rt-00N5w00000Ri7BU-0EM5w000005vO2W.png" />
   </Frame>

7. Connect to the Sprinklr connector to Domo using your credentials.

8. Select the report used in the Sprinklr report.
   In Sprinklr this is found under **requests >** **parameter**. In the sample it is called “Post Insights.”

9. For **Aggregation Function**, select the function used in the Sprinklr report.
   In Sprinklr this is found under **groupBys >** **p** **rojections**. In the sample it is called **SUM**.

10. For **Measurement** **Name**, select the function used in the Sprinklr report.
    In Sprinklr this is found under **groupbys > projections > measurement**.  In the sample it is called **TOTAL\_ENGAGEMENT**.

11. For **Group By Options,** enter the **groupby** fields found in the Sprinklr report under the **Requests** dropdown menu in the **Network** tab, using the syntax (columnName,dimensionName,groupType,detail=value).
    For example, if I had the “Client\_ID” field listed in the group, I would use the following syntax for **Group By Options**: (Client\_ID,Client\_ID, field).
    We also recommend you use a date group by even though the Sprinklr report may not contain that information, so the Domo cards will render the data in the needed format. For example: (date,DATE\_HISTOGRAM,interval=1h) or (POST\_PUBLISHED\_DATE,FIELD)

12. For **Filters**, enter the filters used in the Sprinklr report.
    In Sprinklr these are found under **requests > filters**.  Use the syntax under? that you find by the **Filters** box.

13. (Conditional) If the query code in the Sprinklr report states that
    **Columns to Expand** and **Measurement** **Options** are being used, enter the info that is included in the “request” data.

14. When configuring the time frame, use the time frame stated in the actual Sprinklr report/graph or the one needed for your card visualization. For most Sprinklr reports in Domo, no time frame is provided in the actual Sprinklr report. You can see in the backend that the time stated in the **Time** filter is in a format that is not database friendly or recognizable as a date.

## Building Drilldown

To create drilldown in your Sprinklr data, design or find the type of drilldown you wish to see in your card and create a new Sprinklr DataSet that shows that data. For the drilldown to work, you will need to pull or rename the same field names in a DataFlow that correspond with the top level Sprinklr data source.

## FAQs

<AccordionGroup>
  <Accordion title="What version of the Sprinklr API does this connector use?">
    This connector uses version 1 of the Sprinklr API ([https://api3.sprinklr.com/api/v1/.)](https://api3.sprinklr.com/api/v1/.)"[https://api3.sprinklr.com/api/v1/](https://api3.sprinklr.com/api/v1/).)")
  </Accordion>

  <Accordion title="Which endpoint(s) does each report call in this connector?">
    <table data-aura-rendered-by="33:195;a">
      <tbody>
        <tr>
          <th colspan="1" rowspan="1" width="30%">
            {" "}

            Report Name{" "}
          </th>

          <th colspan="1" rowspan="1" width="70%">
            {" "}

            Endpoint URL(s){" "}
          </th>
        </tr>

        <tr>
          <td colspan="1" rowspan="1">
            {" "}

            Account Insights{" "}
          </td>

          <td colspan="1" rowspan="1">
            {" "}

            /reports/query{" "}
          </td>
        </tr>

        <tr>
          <td colspan="1" rowspan="1">
            {" "}

            Bootstrap Info{" "}
          </td>

          <td colspan="1" rowspan="1">
            {" "}

            /bootstrap/resources{" "}
          </td>
        </tr>

        <tr>
          <td colspan="1" rowspan="1">
            {" "}

            Custom Metric Information{" "}
          </td>

          <td colspan="1" rowspan="1">
            {" "}

            /reports/customMetric{" "}
          </td>
        </tr>

        <tr>
          <td colspan="1" rowspan="1">
            {" "}

            Custom Query{" "}
          </td>

          <td colspan="1" rowspan="1">
            {" "}

            /reports/query{" "}
          </td>
        </tr>

        <tr>
          <td colspan="1" rowspan="1">
            {" "}

            Dashboard Column{" "}
          </td>

          <td colspan="1" rowspan="1">
            {" "}

            /dashboard/{dashboardName}/stream/{columnName}{" "}
          </td>
        </tr>

        <tr>
          <td colspan="1" rowspan="1">
            {" "}

            Listening Stream{" "}
          </td>

          <td colspan="1" rowspan="1">
            {" "}

            /listening/query/stream{" "}
          </td>
        </tr>

        <tr>
          <td colspan="1" rowspan="1">
            {" "}

            Listening Topic Configuration{" "}
          </td>

          <td colspan="1" rowspan="1">
            {" "}

            /listening/topics{" "}
          </td>
        </tr>

        <tr>
          <td colspan="1" rowspan="1">
            {" "}

            Listening Widget{" "}
          </td>

          <td colspan="1" rowspan="1">
            {" "}

            /listening/query/widget{" "}
          </td>
        </tr>

        <tr>
          <td colspan="1" rowspan="1">
            {" "}

            Paid Ad Stat Insights{" "}
          </td>

          <td colspan="1" rowspan="1">
            {" "}

            /reports/query{" "}
          </td>
        </tr>

        <tr>
          <td colspan="1" rowspan="1">
            {" "}

            Post Insights{" "}
          </td>

          <td colspan="1" rowspan="1">
            {" "}

            /reports/query{" "}
          </td>
        </tr>

        <tr>
          <td colspan="1" rowspan="1">
            {" "}

            Profile Conversion Data{" "}
          </td>

          <td colspan="1" rowspan="1">
            {" "}

            /profile/conversations{" "}
          </td>
        </tr>

        <tr>
          <td colspan="1" rowspan="1">
            {" "}

            Profile Details{" "}
          </td>

          <td colspan="1" rowspan="1">
            {" "}

            /profile{" "}
          </td>
        </tr>

        <tr>
          <td colspan="1" rowspan="1">
            {" "}

            Stream Feed{" "}
          </td>

          <td colspan="1" rowspan="1">
            {" "}

            /stream/{streamId}/feed{" "}
          </td>
        </tr>
      </tbody>
    </table>
  </Accordion>

  <Accordion title="What kind of credentials do I need to power up this connector?">
    You need to know if your Sprinklr instance is Production or Sandbox. (Production is the most common.) You also need to create an application to connect to Domo and provide the Client ID and Secret associated with that application.
  </Accordion>

  <Accordion title="Can I use the same account multiple times to create a datasets?">
    Yes
  </Accordion>

  <Accordion title="How often can the data be updated?">
    DataSets should be set to update once a day.
  </Accordion>

  <Accordion title="Are there any API limits I should be aware of?">
    Sprinklr limits calls to Production instances to 5 calls per second and 500 per hour. Calls to Sandbox instances are limited to 2 calls per second and 100 per hour. Note that a single DataSet run may require multiple calls.
  </Accordion>
</AccordionGroup>