> ## Documentation Index
> Fetch the complete documentation index at: https://domoinc-openapi-sync-dataflows.mintlify.site/llms.txt
> Use this file to discover all available pages before exploring further.
# Assigning Users to Power Up Template Visualization Cards
export const InlineImage = ({src, alt = '', height = '1.6em'}) => {
return  ;
};
## Intro
As an executive or manager of your organization, you may want to assign a team member to create and power up a Visualization Card. Domo provides a simple way to do this. You can choose the **>** **Assign Card creation** option in a Page and assign a user in your Domo to power a Card. Domo then creates a *template* Visualization Card—a "dummy" Card not yet connected to a DataSet—and adds it to the same Page in the assigned user's Domo. The assigned user also receives a notification that he/she is responsible for powering and owning the Card. For more information about notifications, see [Creating an Alert for a Visualization Card](/s/article/360043430513 "Notifications and Alerts").
## Assigning a user to create a Visualization Card
When you assign a Card to a user, Domo sends a message to the user and adds an empty template Card to the Page.
**To assign a user to create a Visualization Card,**
1. Navigate to the Page where you want the new Card to appear.
2. Click
.
3. Click **Assign Card creation**.
The **Assign Card** dialog appears.
4. Designate an owner by typing a name in the **Assignee** field.
5. Enter a name for the Card.
6. (Optional) Enter a message for the new owner if desired.
7. Click **Assign**.
## Powering a template Card
When a user assigns you to create a Visualization Card, it is your job to power it with meaningful data. Domo lets you power up charts using DataSets that have already been uploaded to Domo. You can also upload new Microsoft Excel or Google Sheet DataSets on the fly.
### Powering up a template Visualization Card with an existing DataSet
If the DataSet you want to use to power up the Card has already been uploaded, you can use the **Existing Data** option to retrieve the DataSet. All DataSets that you upload to Domo are stored in a database so you can locate them for use in powering up new Cards.
**To power up a template Visualization Card using an existing DataSet,**
1. Click **Power this Card** at the bottom of the Card.
2. Click **Existing Data**.
A dialog appears in which you can choose a DataSet.
;
};
## Intro
As an executive or manager of your organization, you may want to assign a team member to create and power up a Visualization Card. Domo provides a simple way to do this. You can choose the **>** **Assign Card creation** option in a Page and assign a user in your Domo to power a Card. Domo then creates a *template* Visualization Card—a "dummy" Card not yet connected to a DataSet—and adds it to the same Page in the assigned user's Domo. The assigned user also receives a notification that he/she is responsible for powering and owning the Card. For more information about notifications, see [Creating an Alert for a Visualization Card](/s/article/360043430513 "Notifications and Alerts").
## Assigning a user to create a Visualization Card
When you assign a Card to a user, Domo sends a message to the user and adds an empty template Card to the Page.
**To assign a user to create a Visualization Card,**
1. Navigate to the Page where you want the new Card to appear.
2. Click
.
3. Click **Assign Card creation**.
The **Assign Card** dialog appears.
4. Designate an owner by typing a name in the **Assignee** field.
5. Enter a name for the Card.
6. (Optional) Enter a message for the new owner if desired.
7. Click **Assign**.
## Powering a template Card
When a user assigns you to create a Visualization Card, it is your job to power it with meaningful data. Domo lets you power up charts using DataSets that have already been uploaded to Domo. You can also upload new Microsoft Excel or Google Sheet DataSets on the fly.
### Powering up a template Visualization Card with an existing DataSet
If the DataSet you want to use to power up the Card has already been uploaded, you can use the **Existing Data** option to retrieve the DataSet. All DataSets that you upload to Domo are stored in a database so you can locate them for use in powering up new Cards.
**To power up a template Visualization Card using an existing DataSet,**
1. Click **Power this Card** at the bottom of the Card.
2. Click **Existing Data**.
A dialog appears in which you can choose a DataSet.
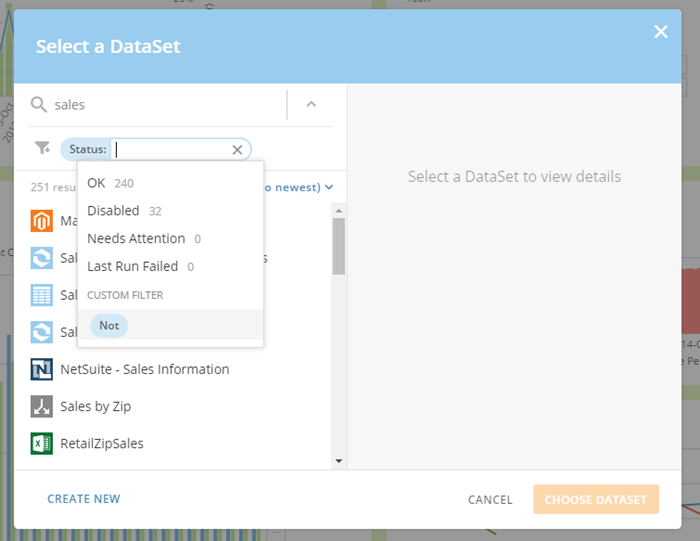 This dialog includes many options for locating your desired DataSet. In addition to being able to search by name, you can also apply various filters to your search. If you click the icon, a dialog appears with a number of selectable filters such as **Owned by**, **Created Date**, **Tag**, and so on. You can choose any of these filters then specify the criteria for the filter. For example, if you chose **Tag**, you would then be prompted to select the tag associated with your desired DataSet. You can also customize filters by applying operators. These differ between filters. Most filters include the **Not** operator so you can indicate that specified criteria are excluded from your filter. For example, you might build a filter in which the status is *not* disabled. Date-based filters include the **On**, **Not On**, **Before**, and **After** operators so you can narrow down when a DataSet was created or last run. Number-based filters include **Equal To**, **Not Equal To**, **Less Than**, and **Greater Than** operators.
In the filter dialog, you can also choose from several quick filters by clicking **Favorite Filters**. These include **Recently run** (which defaults to 7 days), **Owned by you**, and **Needs attention**.
You can apply multiple filters to narrow down your results; for example, you might apply an **Owned by** filter specifying user "Kate Nickelby," a **Type** filter specifying "Adobe Analytics," and a **Status** filter specifying "Disabled."
Once you have your results set, you can change the sort by clicking **Created Date (oldest to newest** **)** and then choosing the desired sort method and direction.
You can add or manage DataSets in the Data Center. For more information, see [Data Center Layout](https://domo-support.domo.com/s/article/360047553253?language=en_US).
3. Locate and select the desired DataSet.
The Analyzer appears. For more information, see [Visualization Card Building Part 2: The Analyzer](/s/topic/0TO5w000000ZaoUGAS).
### Powering up a template Visualization Card with a Microsoft Excel or CSV spreadsheet
You can power up a Visualization Card using a Microsoft Excel spreadsheet or CSV file.
**To power up a static Visualization Card using a Microsoft Excel spreadsheet or CSV file,**
1. Click **Power this Card** at the bottom of the Card.
2. Click **Excel** (even if you are planning to upload a CSV file).
3. Upload your file by following the instructions in
[File Upload Connector](/s/article/360043436573 "File Upload Connector").
After you upload your spreadsheet, the Analyzer appears. For more information, see [Visualization Card Building Part 2: The Analyzer](/s/topic/0TO5w000000ZaoUGAS).
### Powering up a Visualization Card with a Google Sheet spreadsheet
As with a Microsoft Excel spreadsheet, you can power up a Card using a Google Sheet spreadsheet.
**To power up a static Visualization Card using a Google Sheet spreadsheet,**
1. Select **Power this Card** at the bottom of the Card.
2. Click **Connect Spreadsheet**.
3. (Conditional) If necessary, link your Google account to Domo by entering your Google account information. For more information, see
[Google Sheets Connector](/s/article/360043436633 "Google Sheets Connector").
4. Select the desired Google Sheet spreadsheet.
5. Specify whether the data in your spreadsheet is laid out in a column or row format. For more information about the distinction between column- and row-based spreadsheets, see
[Understanding Chart Data](/s/article/360043428693 "Understanding Chart Data").
6. Click **Continue**.
The spreadsheet data appears on your screen for you to review.
7. (Optional) Add a description for the DataSet by doing the following:
1. Click **Add DataSet Description**.
A **Description** field appears.
2. Enter the desired description text in the field.
3. Click **Save**.
You can add or manage DataSets in the Data Center. For more information, see [Data Center Layout](https://domo-support.domo.com/s/article/360047553253?language=en_US).
8. (Optional) Specify a range of rows or columns in the spreadsheet to be uploaded by doing the following:
1. Click **Specify where your data is**.
2. In the **Label Cells** fields, enter the numbers of the header cells in your spreadsheet that constitute your range boundaries. For example, if you entered "A1" and "J1", only the columns in your spreadsheet between columns A1 and J1 would be uploaded.
This pulls all of the data for the range you specified.
3. To specify only a single column or row of data in the range you specified in the previous step, check **Manually specify data range?**, then enter the range for the data cells in the two fields marked **Data Cells**.
4. Click **Preview** to see the cells in the range(s) you specified.
9. (Conditional) If the desired spreadsheet is found on a specific Page in your document, select the correct Page from the menu under the "Success" message.
10. Click **Continue**.
The Analyzer appears. For more information, see [Visualization Card Building Part 2: The Analyzer](/s/topic/0TO5w000000ZaoUGAS).