Show\... | if you want... |
|---|---|
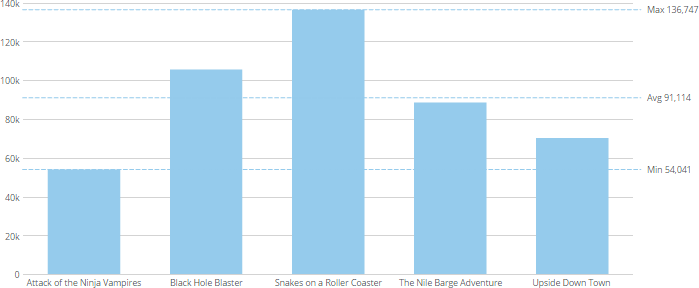
Fewer | If you want to show relative values so users can distinguish overall trends, show fewer gridlines so your chart appears less cluttered (with large "gaps" between reference values). |
More | If you want to show approximate values so users can match up elements with reference values, show more gridlines. |
 **To change the maximum number of value scale gridlines in a chart,**
1. Open the Analyzer for the chart you want to edit.
2. In **Chart Properties**, click **Value Scale**.
3. Enter the desired maximum number of gridlines in the **Max Gridlines** field.
Note that this number does *not* necessarily determine the number of gridlines that appear in the chart. It limits the maximum number of gridlines that are rendered.
**To change the maximum number of value scale gridlines in a chart,**
1. Open the Analyzer for the chart you want to edit.
2. In **Chart Properties**, click **Value Scale**.
3. Enter the desired maximum number of gridlines in the **Max Gridlines** field.
Note that this number does *not* necessarily determine the number of gridlines that appear in the chart. It limits the maximum number of gridlines that are rendered.