> ## Documentation Index
> Fetch the complete documentation index at: https://domoinc-openapi-sync-dataflows.mintlify.site/llms.txt
> Use this file to discover all available pages before exploring further.
# Applying and Resetting Chart Properties
## Intro
You can apply advanced properties to a chart using the **Chart Properties** tool. This can be found in the Analyzer for a chart, to the right of the chart. Setting properties to a chart can have far-reaching effects, so you can reset them if needed.
## Understanding chart properties
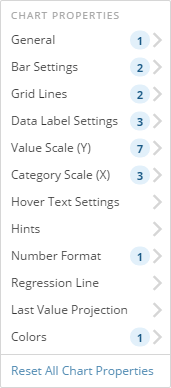
Available chart properties are different for each chart. Most charts have a specific set of categories of chart properties. For example, the Vertical Bar chart includes categories for **General**, **Bar Settings**, **Data Label Settings**, etc. Clicking any category in the Chart Properties brings up the available properties within that category. For example, for the Vertical Bar chart, clicking **General** would display properties for changing the font size, sorting on totals, and disabling animations.
A number to the right of a category name indicates the number of enabled properties within that category. In the following example, one property has been set within **General**, two have been set within **Bar Settings**, and so on.
 **Video - Applying and Resetting Chart Properties**
## Applying chart properties
To set properties for a chart, you must first [Analyzer Layout](/s/article/360042924034 "Opening the Analyzer").
**To apply Chart Properties,**
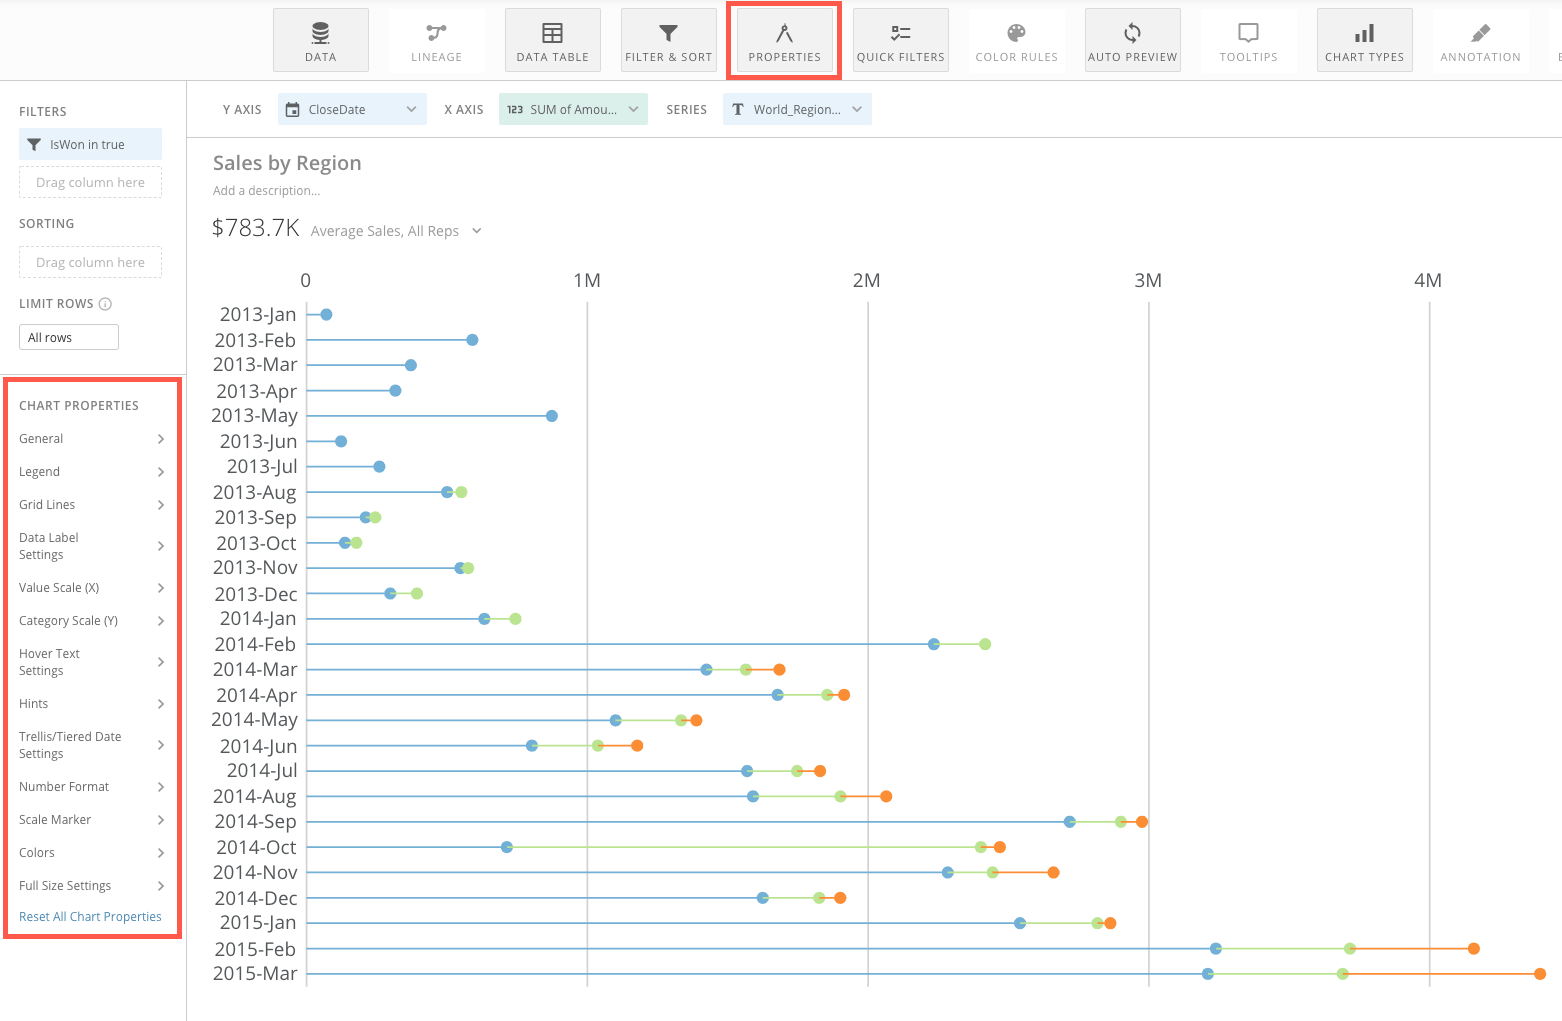
1. (Conditional) If the Chart Properties pane is not open, open it by clicking **Properties** in the toolbar at the top of the Analyzer.
2. Drag column names into all required fields to enable a preview of your chart.
For more information about specifying chart data, see [Understanding Chart Data](/s/article/360043428693 "Understanding Chart Data").
3. Specify the chart properties you want in the **Chart Properties** pane.
**Video - Applying and Resetting Chart Properties**
## Applying chart properties
To set properties for a chart, you must first [Analyzer Layout](/s/article/360042924034 "Opening the Analyzer").
**To apply Chart Properties,**
1. (Conditional) If the Chart Properties pane is not open, open it by clicking **Properties** in the toolbar at the top of the Analyzer.
2. Drag column names into all required fields to enable a preview of your chart.
For more information about specifying chart data, see [Understanding Chart Data](/s/article/360043428693 "Understanding Chart Data").
3. Specify the chart properties you want in the **Chart Properties** pane.
 ## Resetting chart properties
You can reset chart properties to their default settings either by resetting all chart properties at once or by setting the **Default** option for individual chart properties.
**To reset all chart properties,**
1. In the **Chart Properties** pane, click the **Reset All Chart Properties** option.
**To reset an individual chart property,**
1. In the **Chart Properties** pane, locate and click the chart property you want to reset.
2. In the option menu, select the **Default** option.
## Resetting chart properties
You can reset chart properties to their default settings either by resetting all chart properties at once or by setting the **Default** option for individual chart properties.
**To reset all chart properties,**
1. In the **Chart Properties** pane, click the **Reset All Chart Properties** option.
**To reset an individual chart property,**
1. In the **Chart Properties** pane, locate and click the chart property you want to reset.
2. In the option menu, select the **Default** option.