> ## Documentation Index
> Fetch the complete documentation index at: https://domoinc-openapi-sync-dataflows.mintlify.site/llms.txt
> Use this file to discover all available pages before exploring further.

# > Gauges

### Intro

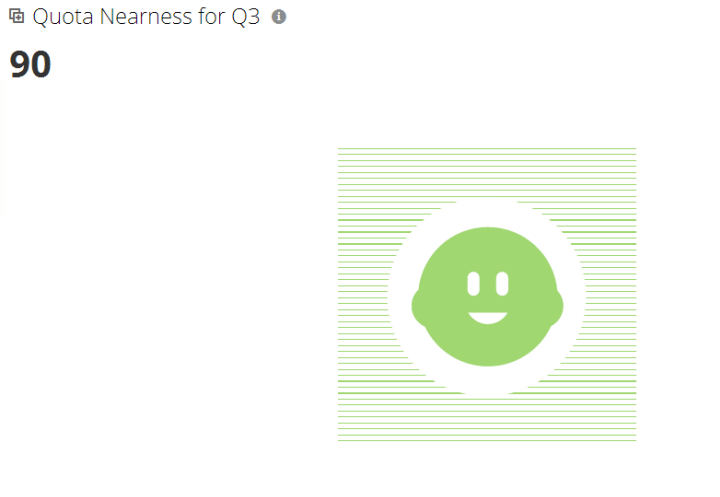
Gauges classify data values as belonging to a predetermined range. An example is a Face Chart, where a face is green, yellow, or red, based on the values selected.

<Frame>
  <img alt="" src="https://mintcdn.com/domoinc-openapi-sync-dataflows/7il5zODxajeeXiuu/images/kb/ka0Vq000000DY8l-00N5w00000Ri7BU-0EMVq000007cijx.jpg?fit=max&auto=format&n=7il5zODxajeeXiuu&q=85&s=356714cd02cc8010052f2d304bc0f469" style={{width: 251, height: 247}} width="347" height="341" data-path="images/kb/ka0Vq000000DY8l-00N5w00000Ri7BU-0EMVq000007cijx.jpg" />
</Frame>

The following table lists the types of gauges available in Domo:

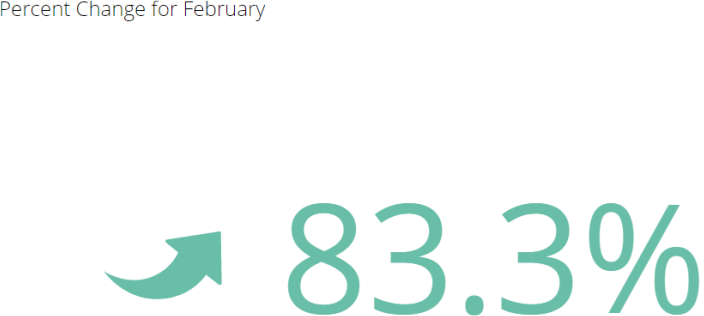
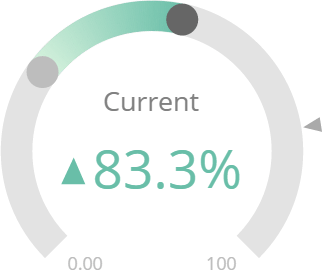
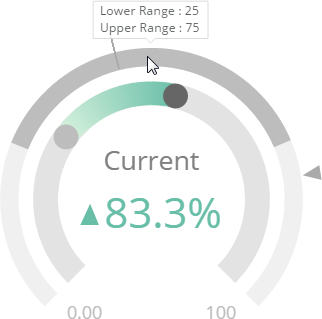
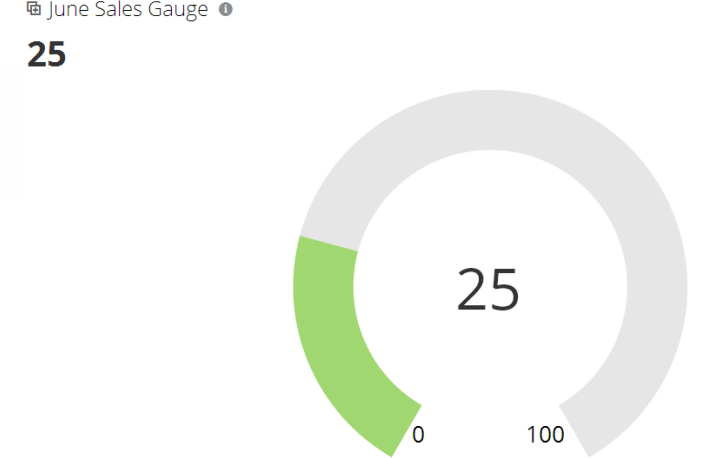
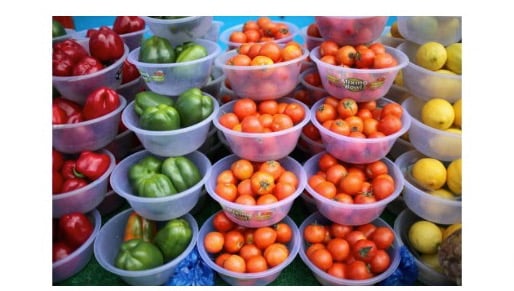
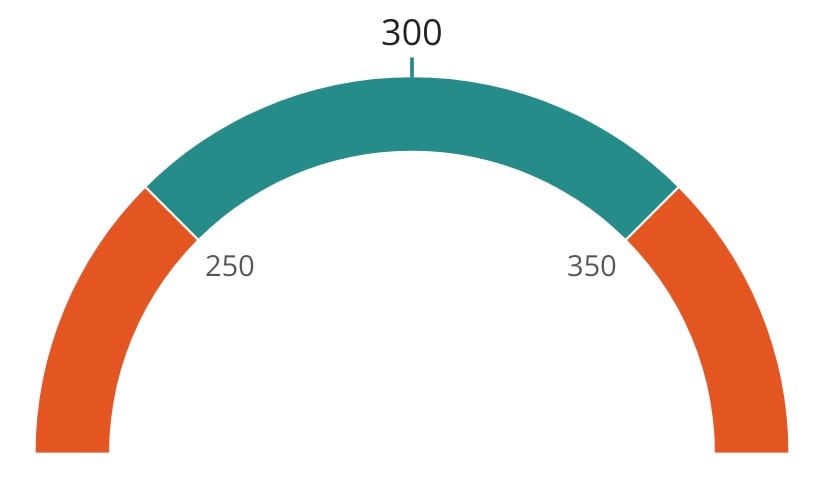
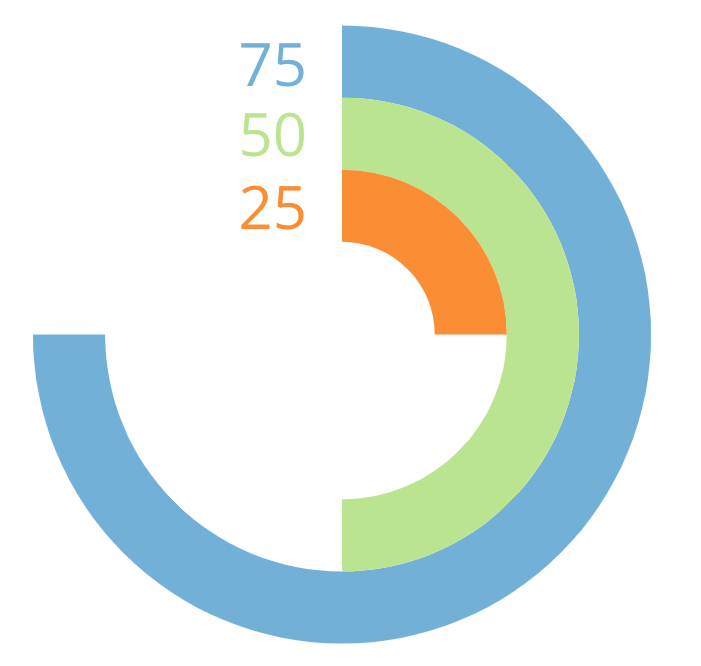
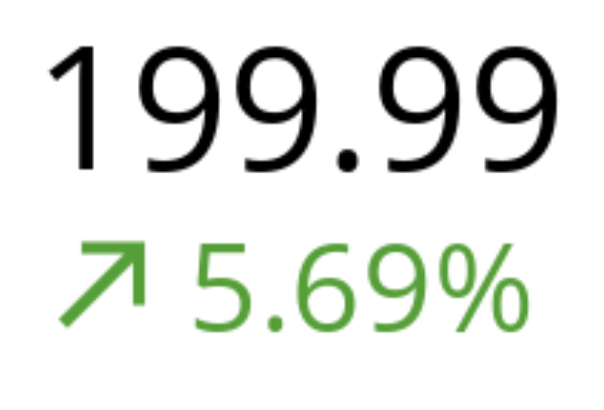
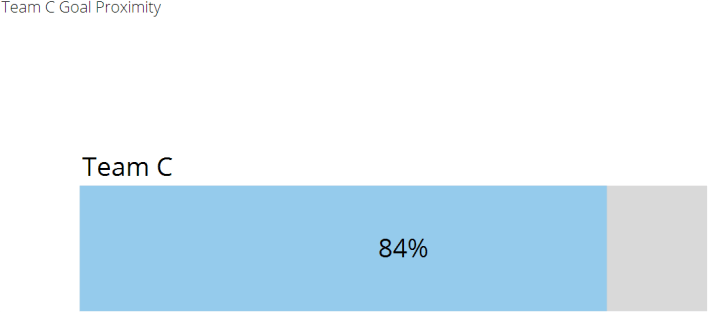
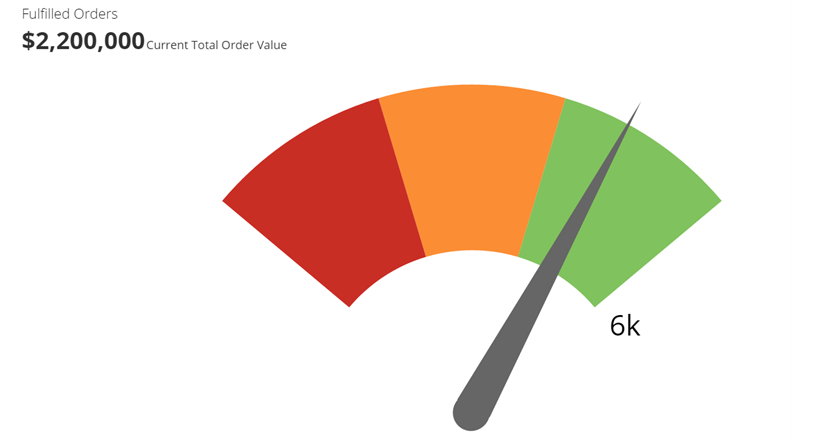
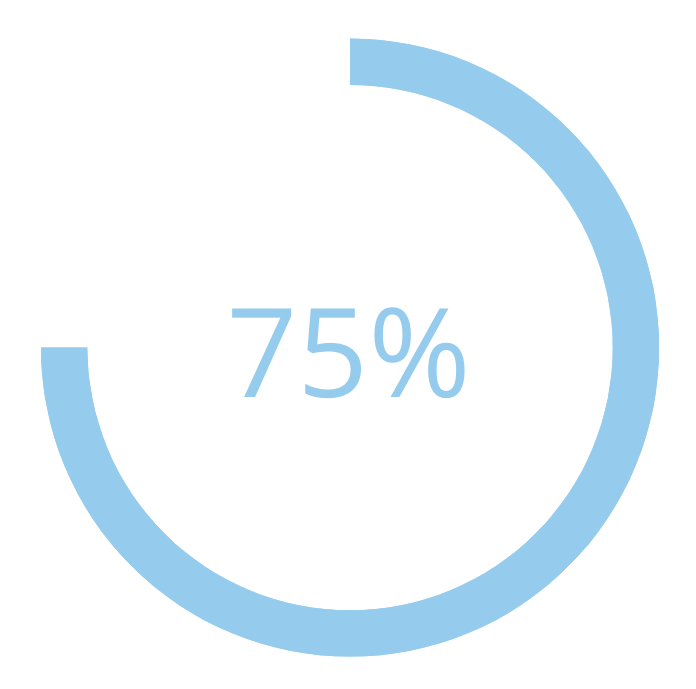
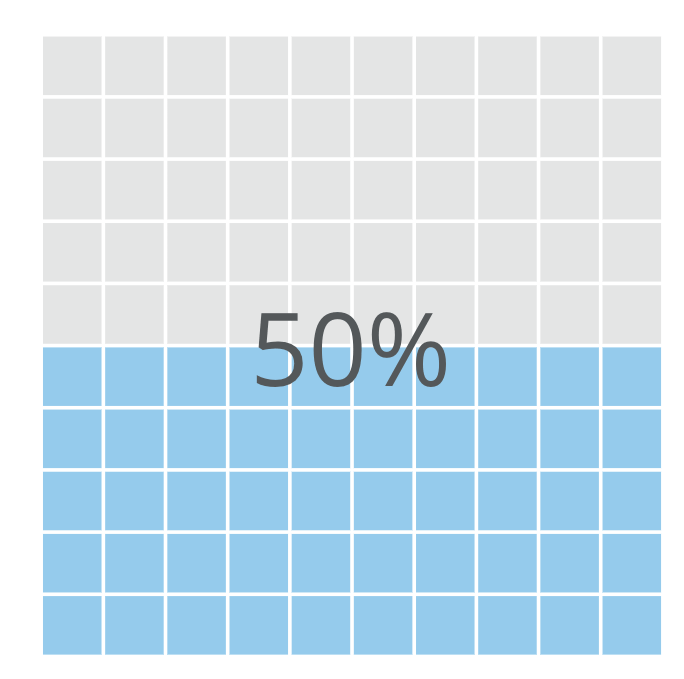
<table border="1" cellpadding="1" cellspacing="1" data-aura-rendered-by="33:209;a"><thead><tr><th colspan="1" rowspan="1"><p> Gauge Type </p></th><th colspan="1" rowspan="1"><p> Description </p></th></tr></thead><tbody><tr><td colspan="1" rowspan="2"><p> Comparative Gauge </p></td><td colspan="1" rowspan="2"><p> A Comparative Gauge is a simple gauge consisting of a single value that shows the degree of change between a previous value and a current value. The degree of change may be shown as a percentage or as the actual difference between values. Alternatively, you may choose to show only the current value. </p><p> See <a href="/s/article/360042924434" target="_self" title="Comparative Gauge"> Comparative Gauge </a>. <a target="_blank" title="/@api/deki/files/239/comparative_gauge_kpi_example.png" /></p><p /><p><a target="_blank" title="/@api/deki/files/239/comparative_gauge_kpi_example.png"><img alt="" src="https://mintcdn.com/domoinc-openapi-sync-dataflows/EpEQaVXeYQJOgZLs/images/kb/ka0Vq000000DY8l-00N5w00000Ri7BU-0EM5w000005vPCk.png?fit=max&auto=format&n=EpEQaVXeYQJOgZLs&q=85&s=583fe2ae2e19ae3b9a49d3d549552688" style={{width: 549, height: 246}} width="704" height="316" data-path="images/kb/ka0Vq000000DY8l-00N5w00000Ri7BU-0EM5w000005vPCk.png" /></a></p><p /></td></tr><tr /><tr><td colspan="1" rowspan="2"><p> Comparative Fill Gauge (Basic) </p></td><td colspan="1" rowspan="2"><p> A basic comparative fill gauge is similar to a filled gauge but includes a parameter for a previous value. The gauge fills in only between this previous value and the current value so viewers can see the degree of change since the gauge was last updated. In addition, the percentage and direction of change appears in the center of the chart. This gauge type also includes a parameter for a target value, but this is optional. </p><p> This gauge type is the same as an advanced Comparative Fill Gauge but is simpler. It requires only four columns (with an optional fifth), while the advanced version requires eight. </p><p> See <a href="/s/article/360042924414" target="_self" title="Comparative Fill Gauge"> Comparative Fill Gauge (Basic and Advanced) </a>. </p><p /><p><a target="_blank" title="/@api/deki/files/238/comparative_fill_gauge_basic_kpi_example.png"><img alt="" src="https://mintcdn.com/domoinc-openapi-sync-dataflows/7il5zODxajeeXiuu/images/kb/ka0Vq000000DY8l-00N5w00000Ri7BU-0EM5w000005vPDF.png?fit=max&auto=format&n=7il5zODxajeeXiuu&q=85&s=e0608a268945215b04485da472404784" style={{width: 296, height: 248}} width="322" height="270" data-path="images/kb/ka0Vq000000DY8l-00N5w00000Ri7BU-0EM5w000005vPDF.png" /></a></p></td></tr><tr /><tr><td colspan="1" rowspan="2"><p> Comparative Fill Gauge (Advanced) </p></td><td colspan="1" rowspan="2"><p> An advanced Comparative Fill Gauge has the same features as the basic version but allows you to create a lower and upper range and specify a median value. These elements are displayed on a second circle in the gauge for a cleaner look. </p><p> See <a href="/s/article/360042924414" target="_self" title="Comparative Fill Gauge"> Comparative Fill Gauge </a><a href="/s/article/360042924414" target="_self" title="Comparative Fill Gauge"> (Basic and Advanced) </a><a href="/s/article/360042924414" target="_self" title="Comparative Fill Gauge" />. </p><p /><p><a target="_blank" title="/@api/deki/files/235/comparative_fill_gauge_advanced_kpi_example.png"><img alt="" src="https://mintcdn.com/domoinc-openapi-sync-dataflows/7il5zODxajeeXiuu/images/kb/ka0Vq000000DY8l-00N5w00000Ri7BU-0EM5w000005vPDD.png?fit=max&auto=format&n=7il5zODxajeeXiuu&q=85&s=a4acc2f113f054572ecccc430b7e922b" style={{width: 300, height: 297}} width="322" height="319" data-path="images/kb/ka0Vq000000DY8l-00N5w00000Ri7BU-0EM5w000005vPDD.png" /></a></p></td></tr><tr /><tr><td colspan="1" rowspan="2"><p> Face Gauge </p></td><td colspan="1" rowspan="2"><p> In a Face Gauge, any of three different versions of a face (smiling, happy, or neutral) is shown, depending on where the current value falls. This can be used to instantly classify a value as good, poor, or fair. </p><p> See <a href="/s/article/360042924534" target="_self" title="Face Gauge"> Face Gauge </a>. </p><p /><p><a target="_blank" title="/@api/deki/files/520/face_gauge_kpi_example.png"><img alt="" src="https://mintcdn.com/domoinc-openapi-sync-dataflows/7il5zODxajeeXiuu/images/kb/ka0Vq000000DY8l-00N5w00000Ri7BU-0EM5w000005vPCs.png?fit=max&auto=format&n=7il5zODxajeeXiuu&q=85&s=9359376bc8f1fefefc4f43a587334382" style={{width: 550, height: 379}} width="720" height="497" data-path="images/kb/ka0Vq000000DY8l-00N5w00000Ri7BU-0EM5w000005vPCs.png" /></a></p></td></tr><tr /><tr><td colspan="1" rowspan="2"><p> Filled Gauge </p></td><td colspan="1" rowspan="2"><p> Filled gauges are circular gauges that "fill" to indicate the current value of the gauge, like a thermometer. </p><p> See <a href="/s/article/360042924554" target="_self" title="Filled Gauge"> Filled Gauge </a>. </p><p /><p><a target="_blank" title="/@api/deki/files/472/filled_gauge_kpi_example.png"><img alt="" src="https://mintcdn.com/domoinc-openapi-sync-dataflows/7il5zODxajeeXiuu/images/kb/ka0Vq000000DY8l-00N5w00000Ri7BU-0EM5w000005vPCu.png?fit=max&auto=format&n=7il5zODxajeeXiuu&q=85&s=264f42f8577c0808d41ad36fb2bd460c" style={{width: 550, height: 358}} width="704" height="458" data-path="images/kb/ka0Vq000000DY8l-00N5w00000Ri7BU-0EM5w000005vPCu.png" /></a></p></td></tr><tr /><tr><td colspan="1" rowspan="2"><p> Image Chart </p></td><td colspan="1" rowspan="2"><p> Image charts allow you to use an image URL column in your data to dynamically display images based on the data being filtered on a dashboard or app page without concatenating an HTML element. </p><p> See <a href="/s/article/000005654" target="_self"> Image Chart </a> to learn more. </p><p /><p><img alt="image chart.jpg" src="https://mintcdn.com/domoinc-openapi-sync-dataflows/7il5zODxajeeXiuu/images/kb/ka0Vq000000DY8l-00N5w00000Ri7BU-0EMVq000005NGqo.jpg?fit=max&auto=format&n=7il5zODxajeeXiuu&q=85&s=da126d1df487cbd498d4f8d34043944c" style={{width: 496, height: 281}} width="514" height="291" data-path="images/kb/ka0Vq000000DY8l-00N5w00000Ri7BU-0EMVq000005NGqo.jpg" /></p></td></tr><tr /><tr><td colspan="1" rowspan="2"><p> In Range Gauge </p></td><td colspan="1" rowspan="2"><p> The In Range Gauge lets you visualize values within and outside of a given range within upper and lower limits. </p><p> See <a href="/s/article/000005373" target="_self"> In Range Gauge </a> to learn more. </p><p /><p><img alt="in range.jpeg" src="https://mintcdn.com/domoinc-openapi-sync-dataflows/XLeSvlwfBHPJHbmY/images/kb/ka0Vq000000ATFF-00N5w00000Ri7BU-0EMVq000000KxOv.jpg?fit=max&auto=format&n=XLeSvlwfBHPJHbmY&q=85&s=e11c53192d312f451d25e3dc71538e4d" style={{width: 435, height: 250}} width="834" height="479" data-path="images/kb/ka0Vq000000ATFF-00N5w00000Ri7BU-0EMVq000000KxOv.jpg" /></p></td></tr><tr /><tr><td colspan="1" rowspan="2"><p> Multi Radial Progress Gauge </p></td><td colspan="1" rowspan="2"><p> Filled gauges are circular gauges that "fill" to indicate the current value of the gauge, like a thermometer. The Multi Radial Progress Gauge allows for displaying for more than one metric. </p><p> See <a href="/s/article/4546378883863" target="_self"> Multi Radial Progress Gauge </a> to learn more. </p><p /><br /><p><img alt="multi radial.png" src="https://mintcdn.com/domoinc-openapi-sync-dataflows/7il5zODxajeeXiuu/images/kb/ka0Vq000000DY8l-00N5w00000Ri7BU-0EMVq000005M9Ht.jpg?fit=max&auto=format&n=7il5zODxajeeXiuu&q=85&s=583334cbf2272a698ed8eb0eb7057458" style={{width: 302, height: 286}} width="701" height="666" data-path="images/kb/ka0Vq000000DY8l-00N5w00000Ri7BU-0EMVq000005M9Ht.jpg" /></p></td></tr><tr /><tr><td colspan="1" rowspan="2"><p> Multi-Value Gauge </p></td><td colspan="1" rowspan="2"><p> A Multi-Value Gauge displays the current value of your as DataSet as a numeral, along with the degree of change for the gauge data, whether positive or negative. This chart type is useful when you want to see a change in value quickly, without having to interpret bars, lines, etc. </p><p> See <a href="/s/article/360042924774" target="_self"> Multi-Value Gauge </a> to learn more. </p><br /><p><img alt="Screen_Shot_2022-06-14_at_10.46.03_AM.png" src="https://mintcdn.com/domoinc-openapi-sync-dataflows/7il5zODxajeeXiuu/images/kb/ka0Vq000000DY8l-00N5w00000Ri7BU-0EM5w000005vPD6.png?fit=max&auto=format&n=7il5zODxajeeXiuu&q=85&s=a50ea1d1660d68eeaeffdba227a75036" style={{width: 209, height: 142}} width="604" height="410" data-path="images/kb/ka0Vq000000DY8l-00N5w00000Ri7BU-0EM5w000005vPD6.png" /></p></td></tr><tr /><tr><td colspan="1" rowspan="2"><p> Progress Bar Gauge </p></td><td colspan="1" rowspan="2"><p> A Progress Bar is similar to a Filled Gauge but is bar-shaped rather than circular and shows its value as a percentage. </p><p> See <a href="/s/article/360043429493" target="_self" title="Progress Bar Gauge"> Progress Bar Gauge </a> to learn more. </p><p /><p><a target="_blank" title="/@api/deki/files/968/progress_bar_kpi_example.png"><img alt="" src="https://mintcdn.com/domoinc-openapi-sync-dataflows/7il5zODxajeeXiuu/images/kb/ka0Vq000000DY8l-00N5w00000Ri7BU-0EM5w000005vPCw.png?fit=max&auto=format&n=7il5zODxajeeXiuu&q=85&s=1fec439655bfad2e2f61e7c8cf89e05f" style={{width: 499, height: 220}} width="708" height="312" data-path="images/kb/ka0Vq000000DY8l-00N5w00000Ri7BU-0EM5w000005vPCw.png" /></a></p></td></tr><tr /><tr><td colspan="1" rowspan="2"><p> Radial Gauge </p></td><td colspan="1" rowspan="2"><p> Radial gauges use an indicator that pivots around the gauge scale to indicate the current data value associated with the gauge. Common Radial gauges include dials and speedometers. </p><p> See <a href="/s/article/360042924934" target="_self" title="Radial Gauge"> Radial Gauge </a> to learn more. </p><p /><p><a target="_blank" title="/@api/deki/files/996/radial_gauge_kpi_example.png"><img alt="" src="https://mintcdn.com/domoinc-openapi-sync-dataflows/7il5zODxajeeXiuu/images/kb/ka0Vq000000DY8l-00N5w00000Ri7BU-0EM5w000005vPCy.png?fit=max&auto=format&n=7il5zODxajeeXiuu&q=85&s=c177d56583a4d2113b008c1db2c51e5b" style={{width: 500, height: 268}} width="820" height="439" data-path="images/kb/ka0Vq000000DY8l-00N5w00000Ri7BU-0EM5w000005vPCy.png" /></a></p></td></tr><tr /><tr><td colspan="1" rowspan="2"><p> Radial Progress Gauge </p></td><td colspan="1" rowspan="2"><p> Filled gauges are circular gauges that "fill" to indicate the current value of the gauge, like a thermometer. </p><p> See <a href="/s/article/4546361976087" target="_self"> Radial Progress Gauge </a> to learn more. </p><p /><p><img alt="Radial_Progress.png" src="https://mintcdn.com/domoinc-openapi-sync-dataflows/EpEQaVXeYQJOgZLs/images/kb/ka0Vq000000DY8l-00N5w00000Ri7BU-0EM5w000005vPCm.png?fit=max&auto=format&n=EpEQaVXeYQJOgZLs&q=85&s=3141ea5f81f45080cfb50efda0ef395f" style={{width: 300, height: 297}} width="696" height="689" data-path="images/kb/ka0Vq000000DY8l-00N5w00000Ri7BU-0EM5w000005vPCm.png" /></p></td></tr><tr /><tr><td colspan="1" rowspan="2"><p> Shape Gauge </p></td><td colspan="1" rowspan="2"><p> A shape gauge uses any of 45 different images to indicate a current value. By using different images to indicate different ranges, you can convey to users whether the current value is positive, neutral, or negative. </p><p> See <a href="/s/article/360042924714" target="_self"> Shape Gauge </a> learn more. </p><p><img alt="Screen_Shot_2022-06-14_at_10.48.38_AM.png" src="https://mintcdn.com/domoinc-openapi-sync-dataflows/EpEQaVXeYQJOgZLs/images/kb/ka0Vq000000DY8l-00N5w00000Ri7BU-0EM5w000005vPCl.png?fit=max&auto=format&n=EpEQaVXeYQJOgZLs&q=85&s=a2930e4a958dd19cd35db14b442ee794" style={{width: 300, height: 254}} width="598" height="506" data-path="images/kb/ka0Vq000000DY8l-00N5w00000Ri7BU-0EM5w000005vPCl.png" /></p></td></tr><tr /><tr><td colspan="1" rowspan="2"><p> Single Value Gauge </p></td><td colspan="1" rowspan="2"><p> A Single Value Gauge displays the first value in your DataSet as a numeral. No other graphics or images are used. This chart type is useful when you want to see a single value quickly without having to interpret bars, lines, etc. </p><p> See <a href="/s/article/360043429293" target="_self" title="Single Value Gauge"> Single Value Gauge </a> to learn more. </p><p><a target="_blank" title="/@api/deki/files/1030/single_value_kpi_example.png"><img alt="Screenshot 2025-02-12 at 5.59.44 PM.png" src="https://mintcdn.com/domoinc-openapi-sync-dataflows/7il5zODxajeeXiuu/images/kb/ka0Vq000000DY8l-00N5w00000Ri7BU-0EMVq000005M9zR.jpg?fit=max&auto=format&n=7il5zODxajeeXiuu&q=85&s=71779730e1eb6f3ea1c845a45d0e82d5" style={{width: 299, height: 203}} width="858" height="582" data-path="images/kb/ka0Vq000000DY8l-00N5w00000Ri7BU-0EMVq000005M9zR.jpg" /></a></p></td></tr><tr /><tr><td colspan="1" rowspan="2"><p> Waffle Gauge </p></td><td colspan="1" rowspan="2"><p> Waffle gauges provide a new, simple, and intuitive way to visualize data. They include many customizable settings to tell a more informative story. </p><p> See <a href="/s/article/4546335931031" target="_self"> Waffle Gauge </a> to learn more. </p><br /><p><img alt="Waffle.png" src="https://mintcdn.com/domoinc-openapi-sync-dataflows/7il5zODxajeeXiuu/images/kb/ka0Vq000000DY8l-00N5w00000Ri7BU-0EM5w000005vPCv.png?fit=max&auto=format&n=7il5zODxajeeXiuu&q=85&s=56e7975651f09d63ee1a5291a26e1db6" style={{width: 300, height: 297}} width="684" height="679" data-path="images/kb/ka0Vq000000DY8l-00N5w00000Ri7BU-0EM5w000005vPCv.png" /></p></td></tr><tr /></tbody></table>