> ## Documentation Index
> Fetch the complete documentation index at: https://domoinc-openapi-sync-dataflows.mintlify.site/llms.txt
> Use this file to discover all available pages before exploring further.
# Magic ETL Tiles: Split Join and Split Filter
### Intro
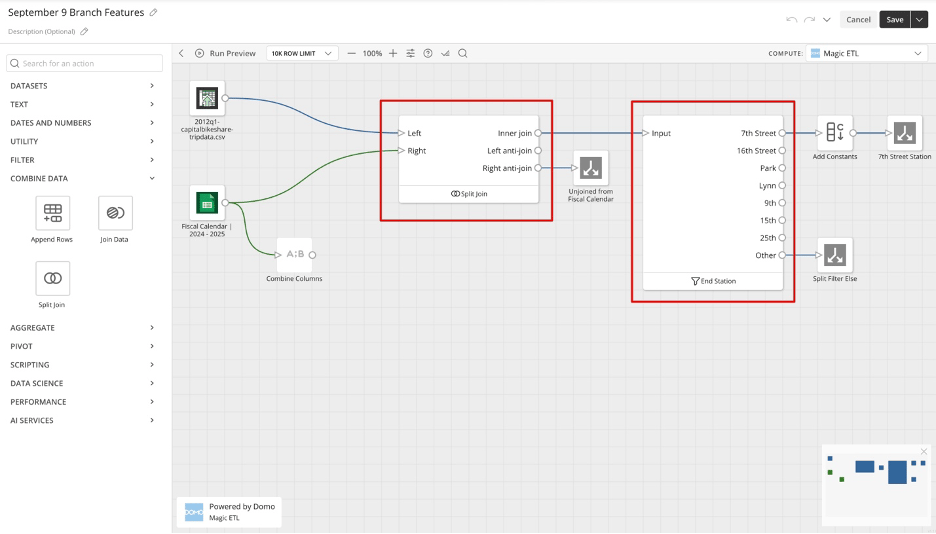
This article explains how to use two tiles under Actions in Magic ETL:
* **Split Join**
* **Split Filter**
 ***
### Configure the Split Join Tile
To join two input tables and output both matched and unmatched records (such as Inner join, Left anti-join, or Right anti-join), configure the **Split Join** tile as shown in the following steps:
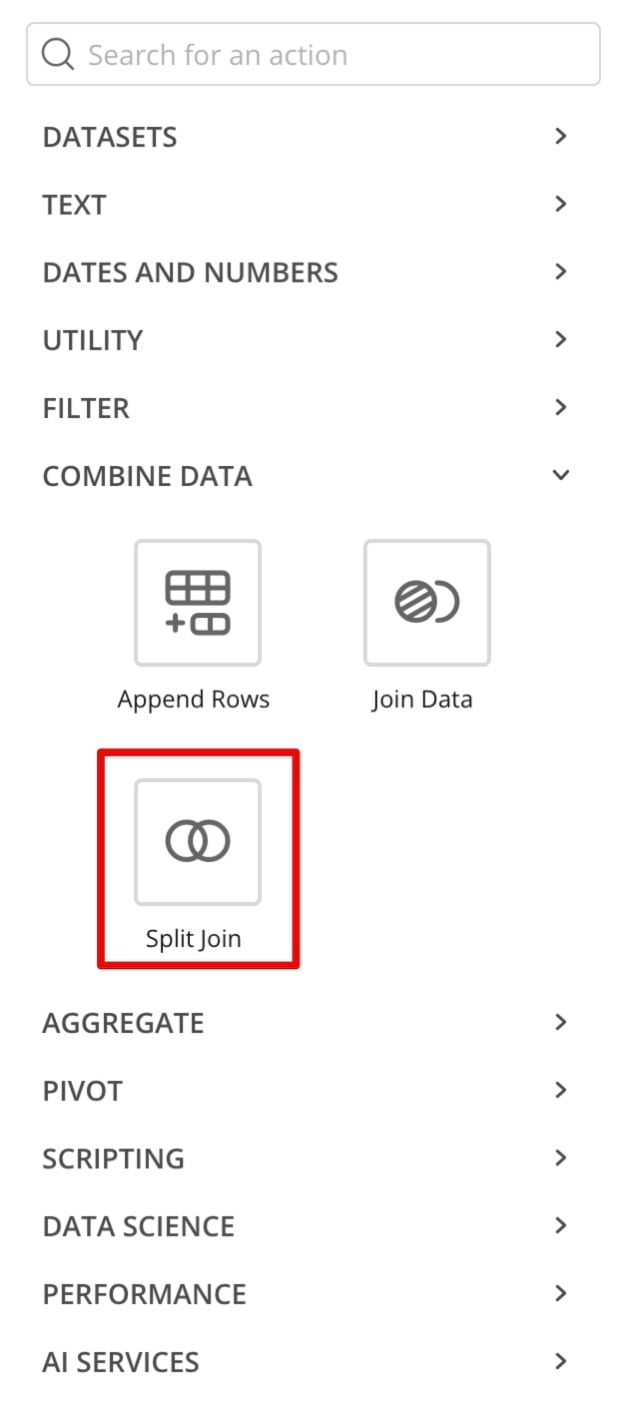
1. Drag the **Split Join** tile from **Combine Data** into the canvas. The tile is larger than a standard Join tile and expands as you enable more outputs.
***
### Configure the Split Join Tile
To join two input tables and output both matched and unmatched records (such as Inner join, Left anti-join, or Right anti-join), configure the **Split Join** tile as shown in the following steps:
1. Drag the **Split Join** tile from **Combine Data** into the canvas. The tile is larger than a standard Join tile and expands as you enable more outputs.
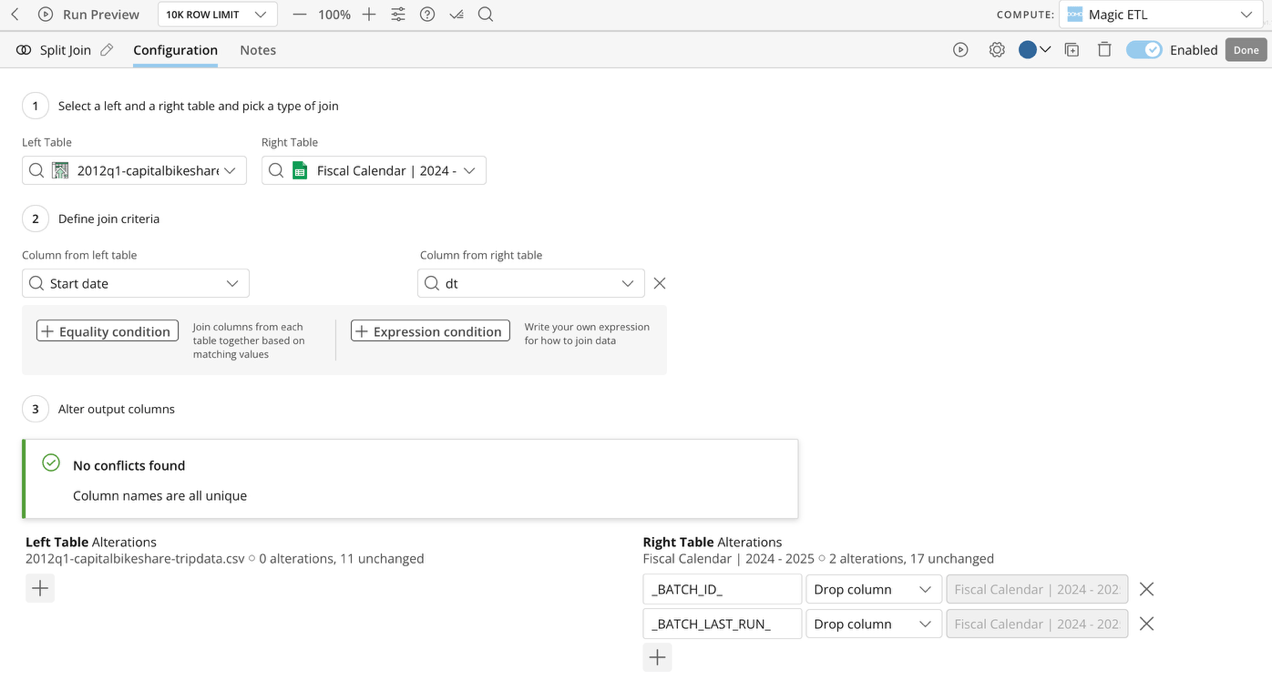
 2. Choose the left table and right table, either by dragging the arrows from the inputs to the tile, or by selecting the table names from the dropdowns in the configuration menu.
3. Configure your join and column handling the same way you would in the regular join tile.
2. Choose the left table and right table, either by dragging the arrows from the inputs to the tile, or by selecting the table names from the dropdowns in the configuration menu.
3. Configure your join and column handling the same way you would in the regular join tile.
 4. Under **Output names**, check the boxes next to which outputs you would like.
You can rename them.
4. Under **Output names**, check the boxes next to which outputs you would like.
You can rename them.
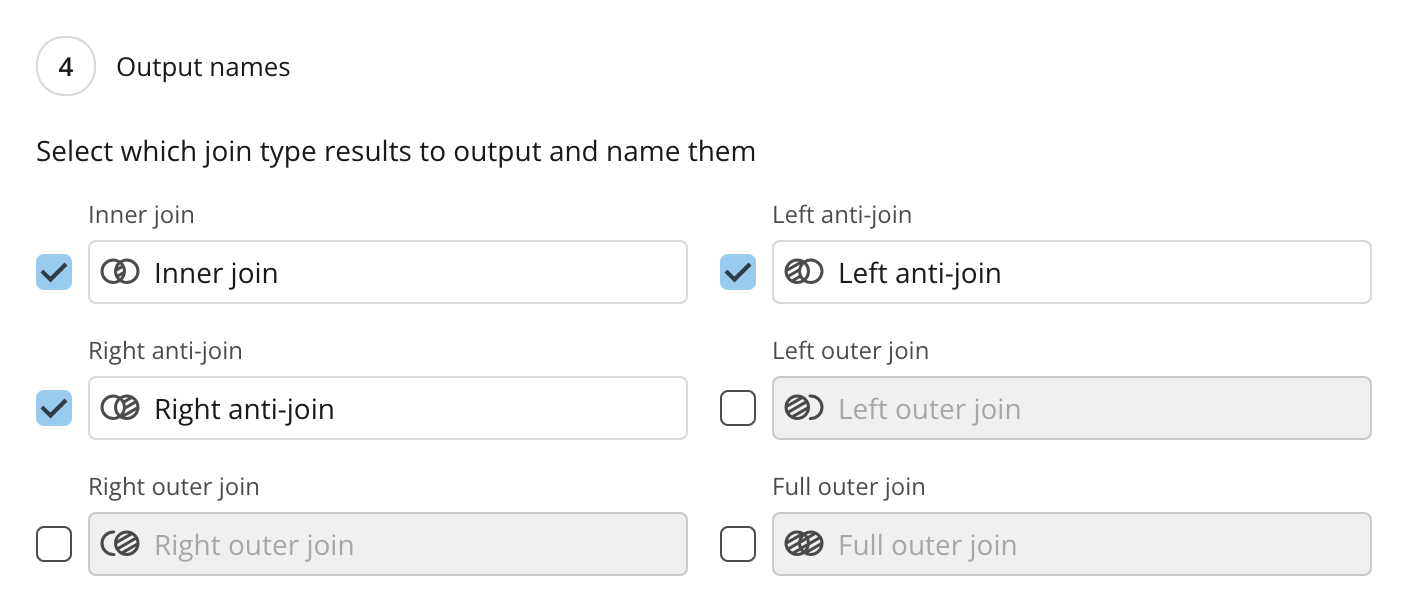 The result on the canvas is multiple nodes representing the outputs selected. You can build your downstream DataFlow from any of those outputs.
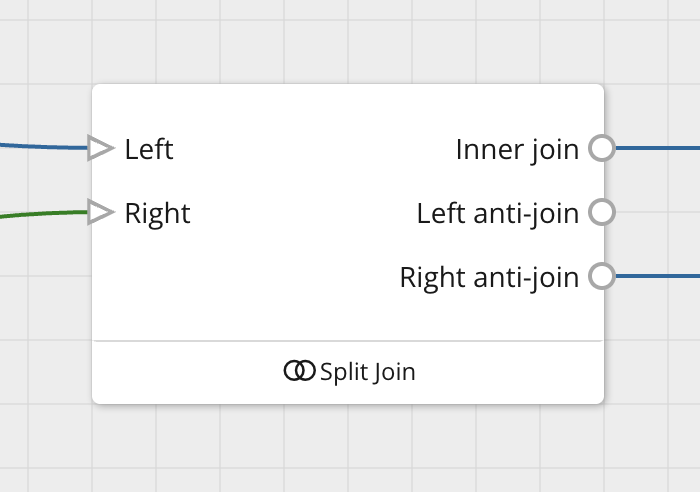 **Tip:** The tile expands horizontally as you add outputs. Rearrange the canvas for readability. You can hide unused outputs in the configuration panel.
### Configure the Split Filter Tile
To filter a DataSet into multiple named outputs based on formula conditions, and optionally capture all other rows in an *Else* output, use the **Split Filter** tile as outlined in the following steps:
1. Drag the **Split Filter** tile from **Filter** into the canvas. The tile expands as you add more outputs.
**Tip:** The tile expands horizontally as you add outputs. Rearrange the canvas for readability. You can hide unused outputs in the configuration panel.
### Configure the Split Filter Tile
To filter a DataSet into multiple named outputs based on formula conditions, and optionally capture all other rows in an *Else* output, use the **Split Filter** tile as outlined in the following steps:
1. Drag the **Split Filter** tile from **Filter** into the canvas. The tile expands as you add more outputs.
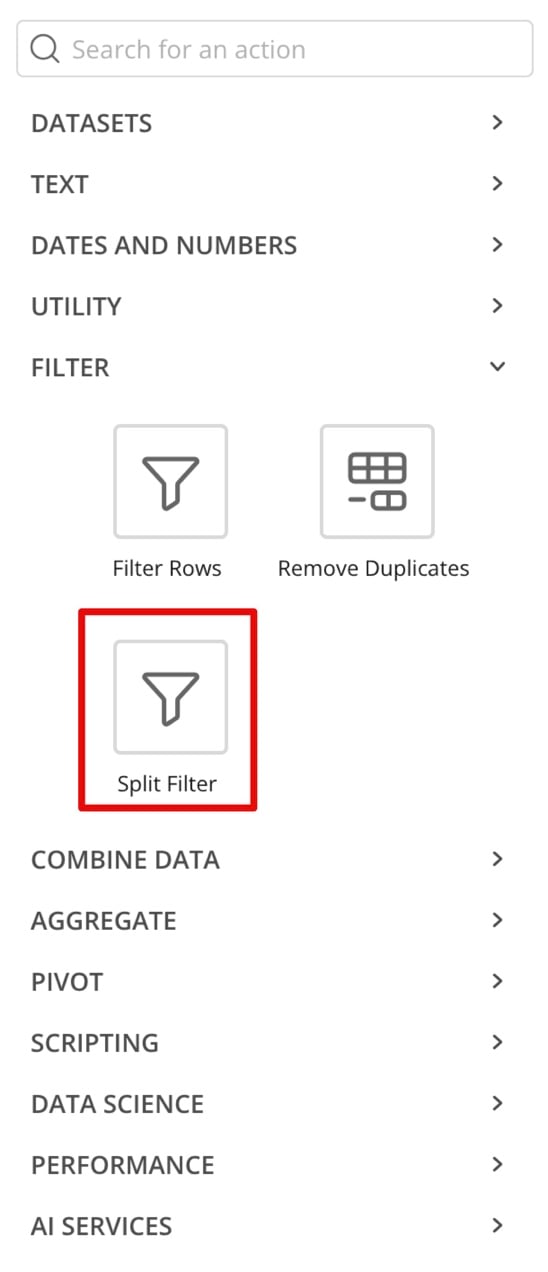 2. Configure the Formula filters. Each formula represents a different stream that will be output from the tile.
**Note:** You can only configure formula filters and not filter rules in this tile.
1. Choose whether to output all unfiltered rows as an *Else* .
2. Configure the Formula filters. Each formula represents a different stream that will be output from the tile.
**Note:** You can only configure formula filters and not filter rules in this tile.
1. Choose whether to output all unfiltered rows as an *Else* .
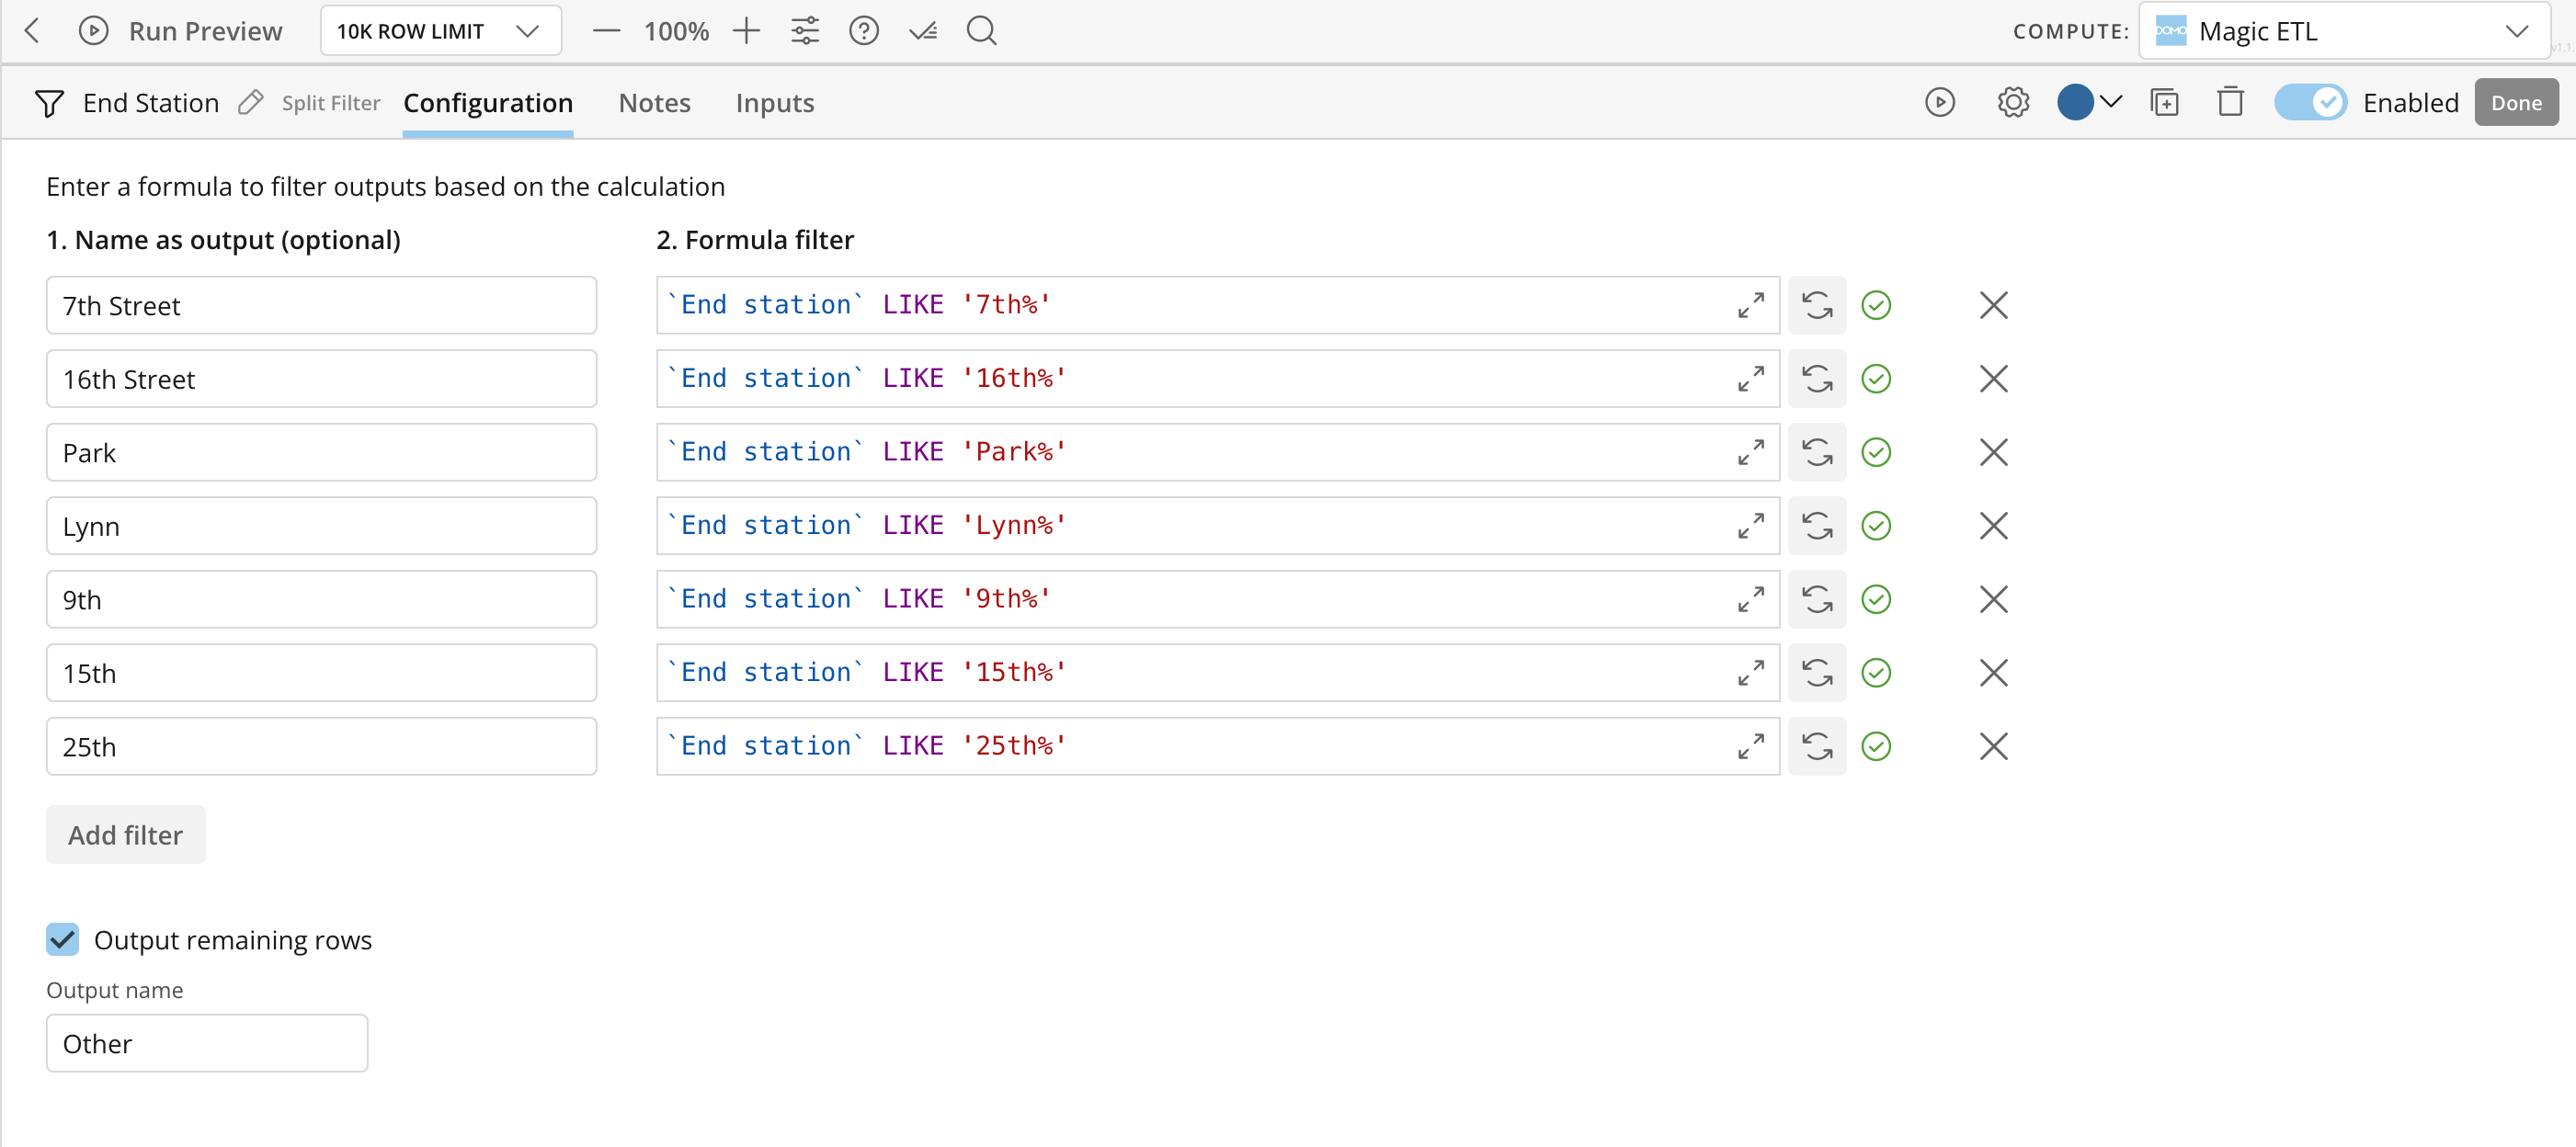 2. You can name any of the filter outputs, as well as the *Else* output.
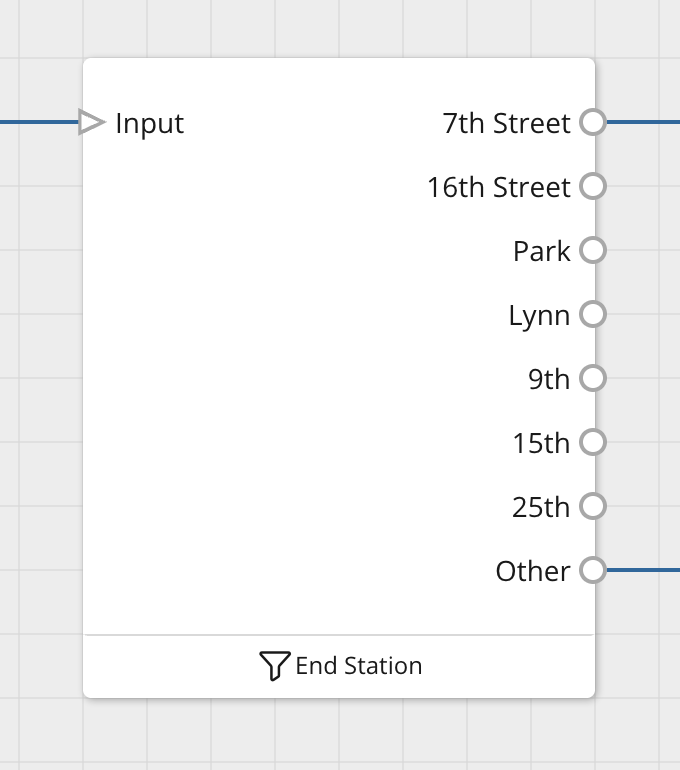
The result on the canvas will be multiple nodes representing the outputs selected. You can build your downstream DataFlow from any of those outputs.
2. You can name any of the filter outputs, as well as the *Else* output.
The result on the canvas will be multiple nodes representing the outputs selected. You can build your downstream DataFlow from any of those outputs.
 **Tip:** For complex, rule-based filtering, you can still use standard Filter tiles in combination. Split Filter is optimized for formula-driven, multi-stream splits.
### Example Use Cases
* **Join auditing:** Use Split Join to join *Customer A* (left) to *Customer B* (right). Output *Matched* rows for normal processing, *Left Only* rows to an error or reconciliation DataFlow, and *Right Only* rows for data quality review—all from one join step.
* **Multi-region sales processing:** Use the Split Filter to create one output per region (e.g., `Region = 'West'` , `Region = 'East'` , and so on). Process each region independently downstream, and use *Else* to capture rows with no region value.
### FAQ
No. You can use only the outputs you need. You can also hide unused outputs in the configuration panel.
The tile expands automatically, which might require rearranging the canvas for clarity.
An *Anti-join* (left or right) returns rows from one table that don’t have a corresponding match in the other table. It’s useful for finding missing or unmatched records. You can achieve the same result using Split Join outputs (*Left Only* or *Right Only* ) or with dedicated anti-join logic.
**Tip:** For complex, rule-based filtering, you can still use standard Filter tiles in combination. Split Filter is optimized for formula-driven, multi-stream splits.
### Example Use Cases
* **Join auditing:** Use Split Join to join *Customer A* (left) to *Customer B* (right). Output *Matched* rows for normal processing, *Left Only* rows to an error or reconciliation DataFlow, and *Right Only* rows for data quality review—all from one join step.
* **Multi-region sales processing:** Use the Split Filter to create one output per region (e.g., `Region = 'West'` , `Region = 'East'` , and so on). Process each region independently downstream, and use *Else* to capture rows with no region value.
### FAQ
No. You can use only the outputs you need. You can also hide unused outputs in the configuration panel.
The tile expands automatically, which might require rearranging the canvas for clarity.
An *Anti-join* (left or right) returns rows from one table that don’t have a corresponding match in the other table. It’s useful for finding missing or unmatched records. You can achieve the same result using Split Join outputs (*Left Only* or *Right Only* ) or with dedicated anti-join logic.