> ## Documentation Index
> Fetch the complete documentation index at: https://domoinc-openapi-sync-dataflows.mintlify.site/llms.txt
> Use this file to discover all available pages before exploring further.
# Build Your First Dashboard | Tutorial
export const InlineImage = ({src, alt = '', height = '1.6em'}) => {
return  ;
};
### Intro
In this tutorial, we’ll show you how to use Domo to build a dashboard from start to finish. We’ll walk you through connecting data, cleaning it through a simple ETL (Extract, Transform, Load) process, building a dashboard with four to five dynamic cards, setting a Card Alert, and pushing that alert to your email or phone in real time and sharing it with colleagues. This guide serves as a foundation for your journey with Domo, setting the stage for more advanced functionalities and applications.
As we move through the tutorial, you'll gain hands-on experience with Domo's powerful features. We'll provide step-by-step instructions, practical examples, and useful tips to make your learning process smooth and enjoyable.
***
### Prerequisites
Before beginning the tutorial, make sure you have the following:
* Access to these sample Google Sheets:
* [Sales Data](https://docs.google.com/spreadsheets/d/1K8YJxidZkCnc8DjCHLUnKWqm_Gywqoeh6DbamkLJy9w/edit?gid=99140820#gid=99140820)
* [Marketing Data](https://docs.google.com/spreadsheets/d/1AmnIH1-EbPl0rguDGDLkiVJp1uFsJYzDkh8Ud-OerXw/edit?gid=0#gid=0)
**Identify the spreadsheet IDs:**
Notice the spreadsheet IDs in these URLs. These IDs uniquely identify your Google Sheets are one way you can set up the connection in Domo.
* For the Sales data, the ID is 1K8YJxidZkCnc8DjCHLUnKWqm\_Gywqoeh6DbamkLJy9w
* For the Marketing data, the ID is 1AmnIH1-EbPl0rguDGDLkiVJp1uFsJYzDkh8Ud-OerXw
* To stay connected and access your data away from a computer, download the
[Domo Mobile](https://www.domo.com/business-intelligence/features/mobile)
app:
* **For Android users —**
Visit the Google Play Store and search for 'Domo'.
* **For iOS users —**
Go to the Apple App Store and look up 'Domo'.
Download and install the app on your device. After installing, log in to the app with your Domo credentials. If your organization uses Single Sign-On (SSO), you may need to follow a different login procedure.
**Note:**
The mobile app's default screen is the Home dashboard, which displays key pages and metrics. Follow these links to learn more about the Domo mobile app:
* [Customize Domo mobile app](https://domo-support.domo.com/s/article/000005648)
* [Mobile Enterprise Security](https://domo-support.domo.com/s/article/1500007028582)
* [Domo Mobile best practices](https://domo-support.domo.com/s/article/360042923554)
* [Edit a dashboard's mobile layout](https://domo-support.domo.com/s/article/1500010172542)
* Import Zips to Fips data
**Optional step to join data later:**
The Zips to Fips DataSet is a valuable asset from Domo's connector library. It helps in joining ZIP code data to FIPS codes, which can be used to group zip codes at a larger county level.
Follow these steps to access this data:
1. In your Domo instance, use the left navigation to go to
**Features** > **Data Warehouse**.
2. At the top of the screen, select
**Connect Data** > **Connectors**.
3. Search for "dimensions" and choose the
**Domo Dimensions Connector** to open the configuration modal.
4. Use the
**Files** dropdown to find and select the "zips\_to\_fips\_latest" DataSet.
5. Select
**Next** in the top right of the modal and name your DataSet "Zips to Fips."
6. Select
**Save and Run** to begin importing the data.
### Connect to Sample Google Sheets Data
Domo's connectors can efficiently bring your data into Domo when manual uploads and web forms seem too labor-intensive. This guide describes how to seamlessly integrate the [sample data](#prerequisites) above into Domo for use during this tutorial.
**Why use connectors?**
Connectors provide an automated "set it and forget it" method for data integration, contrasting the manual effort needed with other data connection methods.
Follow these steps to use the Google Sheets Connector with the [sample data](#prerequisites) provided above:
**Access the Google Sheets Connector**
1. In your Domo instance, use the left navigation to go to
**Features** > **DataSets**.
2. At the top of the screen, select
**Connect Data** > **Connectors**.
3. Search for the "Google Sheets" connector and select
**Use Recommended**.
;
};
### Intro
In this tutorial, we’ll show you how to use Domo to build a dashboard from start to finish. We’ll walk you through connecting data, cleaning it through a simple ETL (Extract, Transform, Load) process, building a dashboard with four to five dynamic cards, setting a Card Alert, and pushing that alert to your email or phone in real time and sharing it with colleagues. This guide serves as a foundation for your journey with Domo, setting the stage for more advanced functionalities and applications.
As we move through the tutorial, you'll gain hands-on experience with Domo's powerful features. We'll provide step-by-step instructions, practical examples, and useful tips to make your learning process smooth and enjoyable.
***
### Prerequisites
Before beginning the tutorial, make sure you have the following:
* Access to these sample Google Sheets:
* [Sales Data](https://docs.google.com/spreadsheets/d/1K8YJxidZkCnc8DjCHLUnKWqm_Gywqoeh6DbamkLJy9w/edit?gid=99140820#gid=99140820)
* [Marketing Data](https://docs.google.com/spreadsheets/d/1AmnIH1-EbPl0rguDGDLkiVJp1uFsJYzDkh8Ud-OerXw/edit?gid=0#gid=0)
**Identify the spreadsheet IDs:**
Notice the spreadsheet IDs in these URLs. These IDs uniquely identify your Google Sheets are one way you can set up the connection in Domo.
* For the Sales data, the ID is 1K8YJxidZkCnc8DjCHLUnKWqm\_Gywqoeh6DbamkLJy9w
* For the Marketing data, the ID is 1AmnIH1-EbPl0rguDGDLkiVJp1uFsJYzDkh8Ud-OerXw
* To stay connected and access your data away from a computer, download the
[Domo Mobile](https://www.domo.com/business-intelligence/features/mobile)
app:
* **For Android users —**
Visit the Google Play Store and search for 'Domo'.
* **For iOS users —**
Go to the Apple App Store and look up 'Domo'.
Download and install the app on your device. After installing, log in to the app with your Domo credentials. If your organization uses Single Sign-On (SSO), you may need to follow a different login procedure.
**Note:**
The mobile app's default screen is the Home dashboard, which displays key pages and metrics. Follow these links to learn more about the Domo mobile app:
* [Customize Domo mobile app](https://domo-support.domo.com/s/article/000005648)
* [Mobile Enterprise Security](https://domo-support.domo.com/s/article/1500007028582)
* [Domo Mobile best practices](https://domo-support.domo.com/s/article/360042923554)
* [Edit a dashboard's mobile layout](https://domo-support.domo.com/s/article/1500010172542)
* Import Zips to Fips data
**Optional step to join data later:**
The Zips to Fips DataSet is a valuable asset from Domo's connector library. It helps in joining ZIP code data to FIPS codes, which can be used to group zip codes at a larger county level.
Follow these steps to access this data:
1. In your Domo instance, use the left navigation to go to
**Features** > **Data Warehouse**.
2. At the top of the screen, select
**Connect Data** > **Connectors**.
3. Search for "dimensions" and choose the
**Domo Dimensions Connector** to open the configuration modal.
4. Use the
**Files** dropdown to find and select the "zips\_to\_fips\_latest" DataSet.
5. Select
**Next** in the top right of the modal and name your DataSet "Zips to Fips."
6. Select
**Save and Run** to begin importing the data.
### Connect to Sample Google Sheets Data
Domo's connectors can efficiently bring your data into Domo when manual uploads and web forms seem too labor-intensive. This guide describes how to seamlessly integrate the [sample data](#prerequisites) above into Domo for use during this tutorial.
**Why use connectors?**
Connectors provide an automated "set it and forget it" method for data integration, contrasting the manual effort needed with other data connection methods.
Follow these steps to use the Google Sheets Connector with the [sample data](#prerequisites) provided above:
**Access the Google Sheets Connector**
1. In your Domo instance, use the left navigation to go to
**Features** > **DataSets**.
2. At the top of the screen, select
**Connect Data** > **Connectors**.
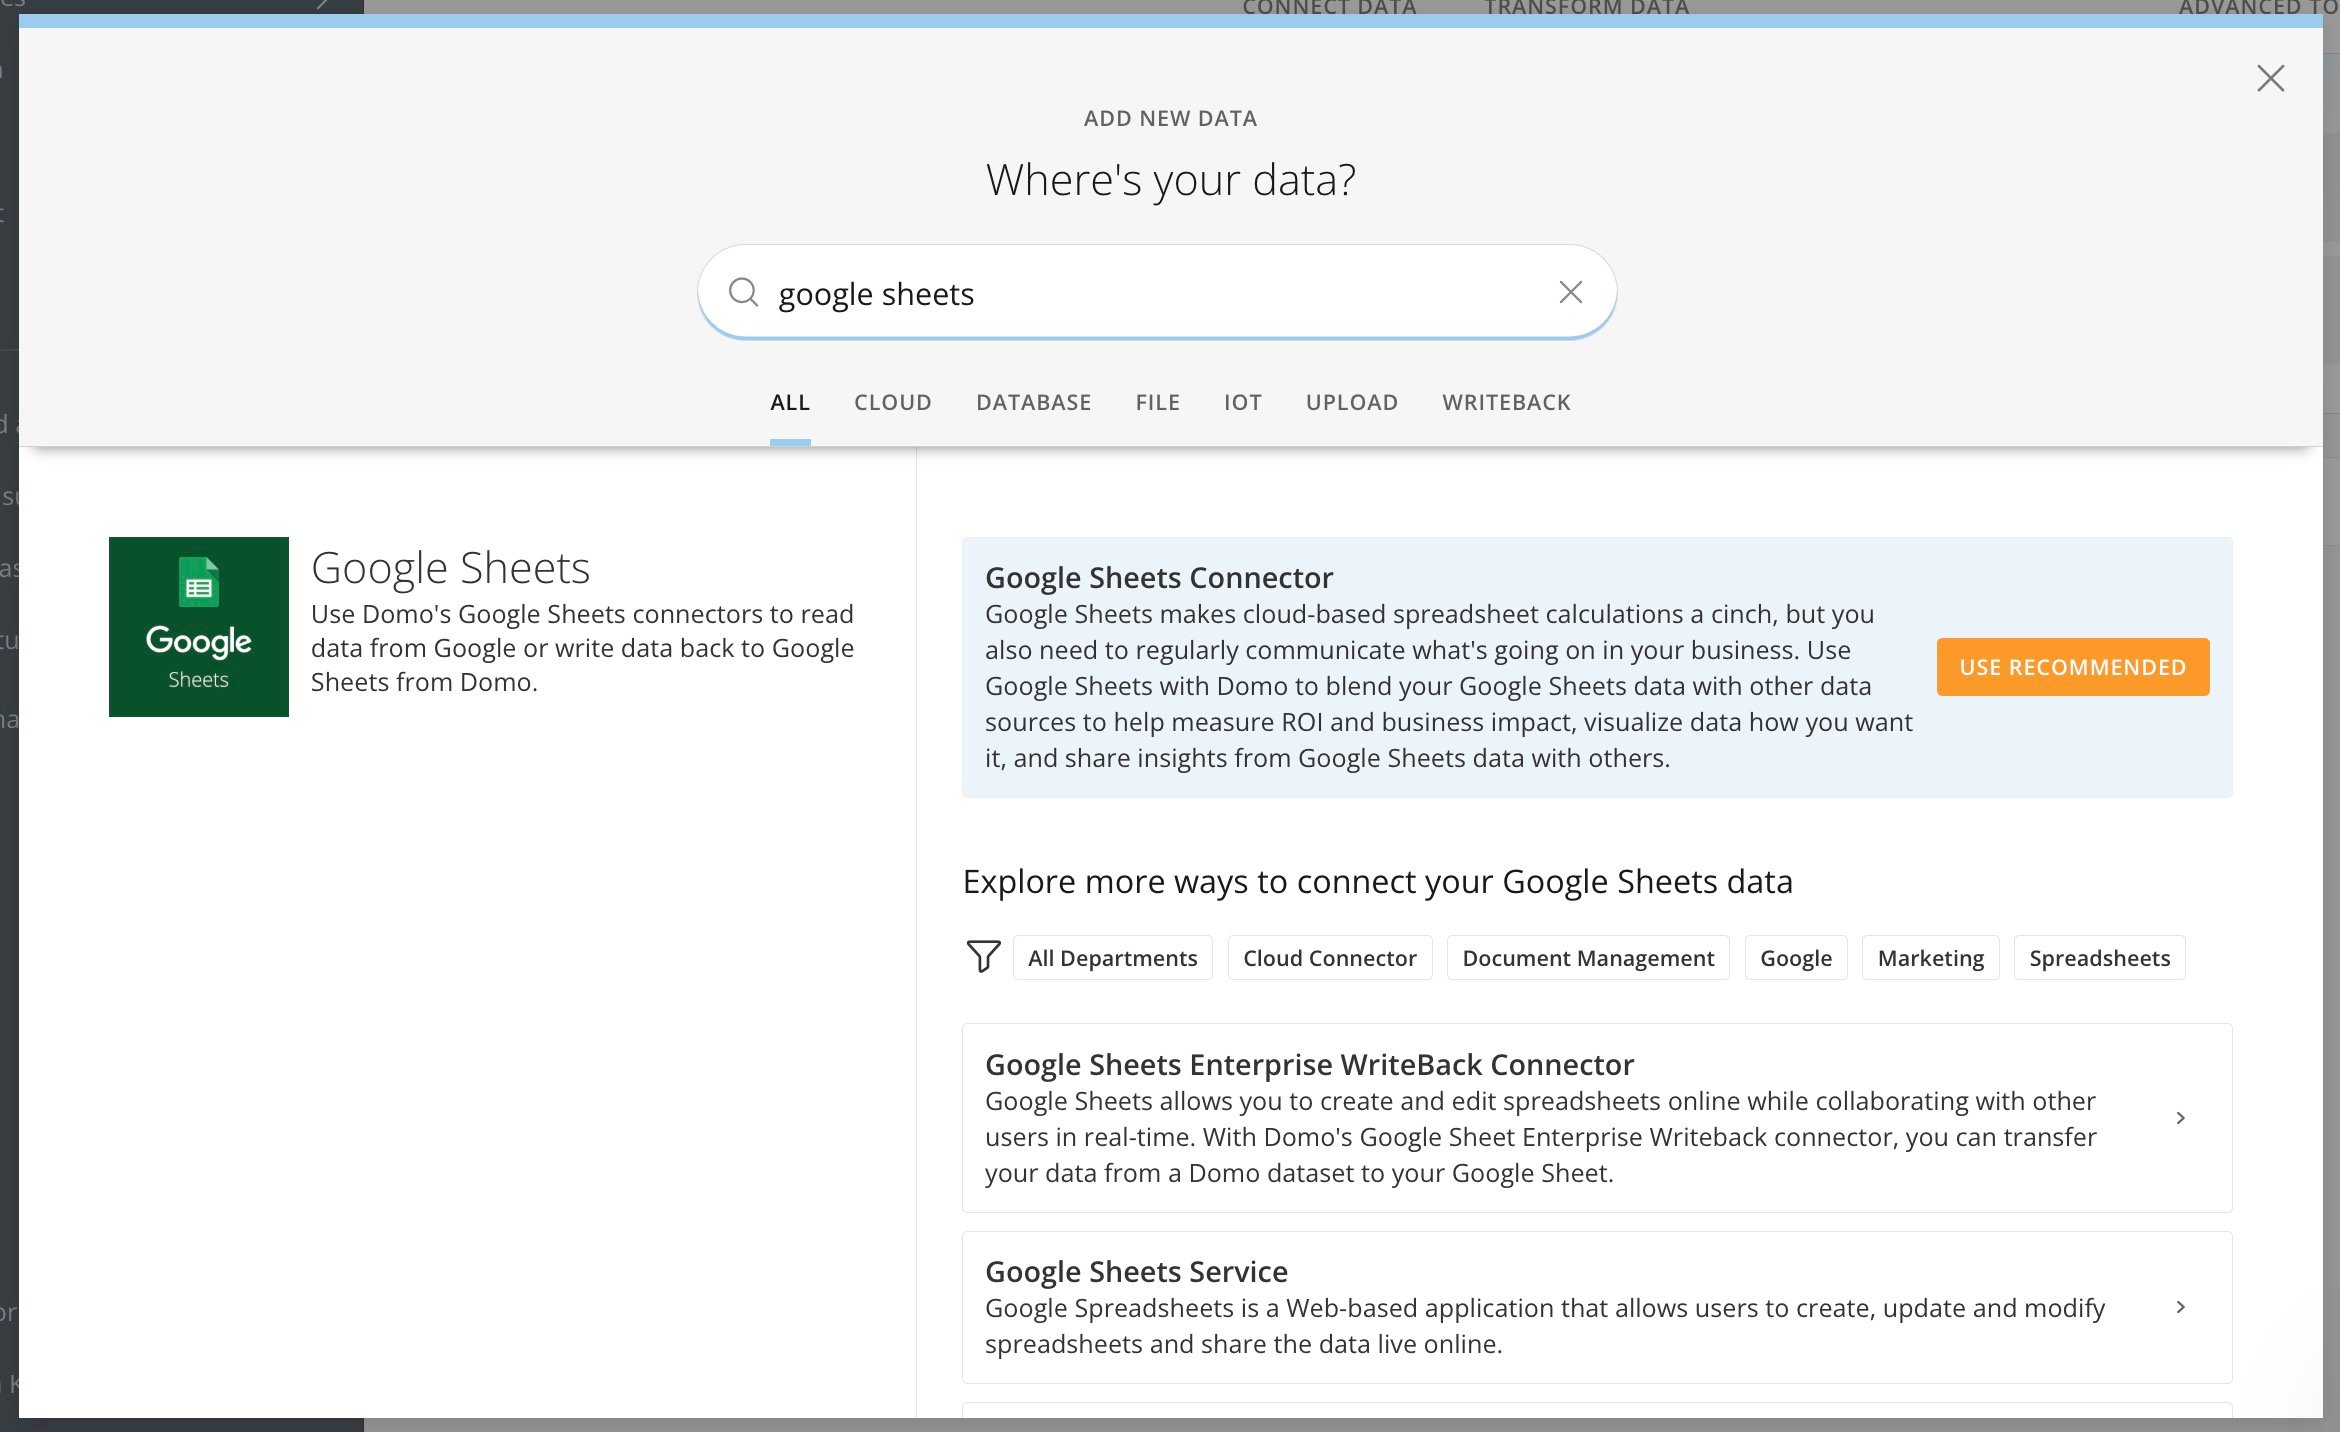
3. Search for the "Google Sheets" connector and select
**Use Recommended**.
 **Important:**
It's important to understand that Domo offers different connectors for different needs. For instance, there are separate Facebook connectors for organic and paid traffic. Similarly, Domo provides various connectors to Google Sheets, depending on the data integration requirements.
**Connect with the Google Sheets Connector**
4. Use the
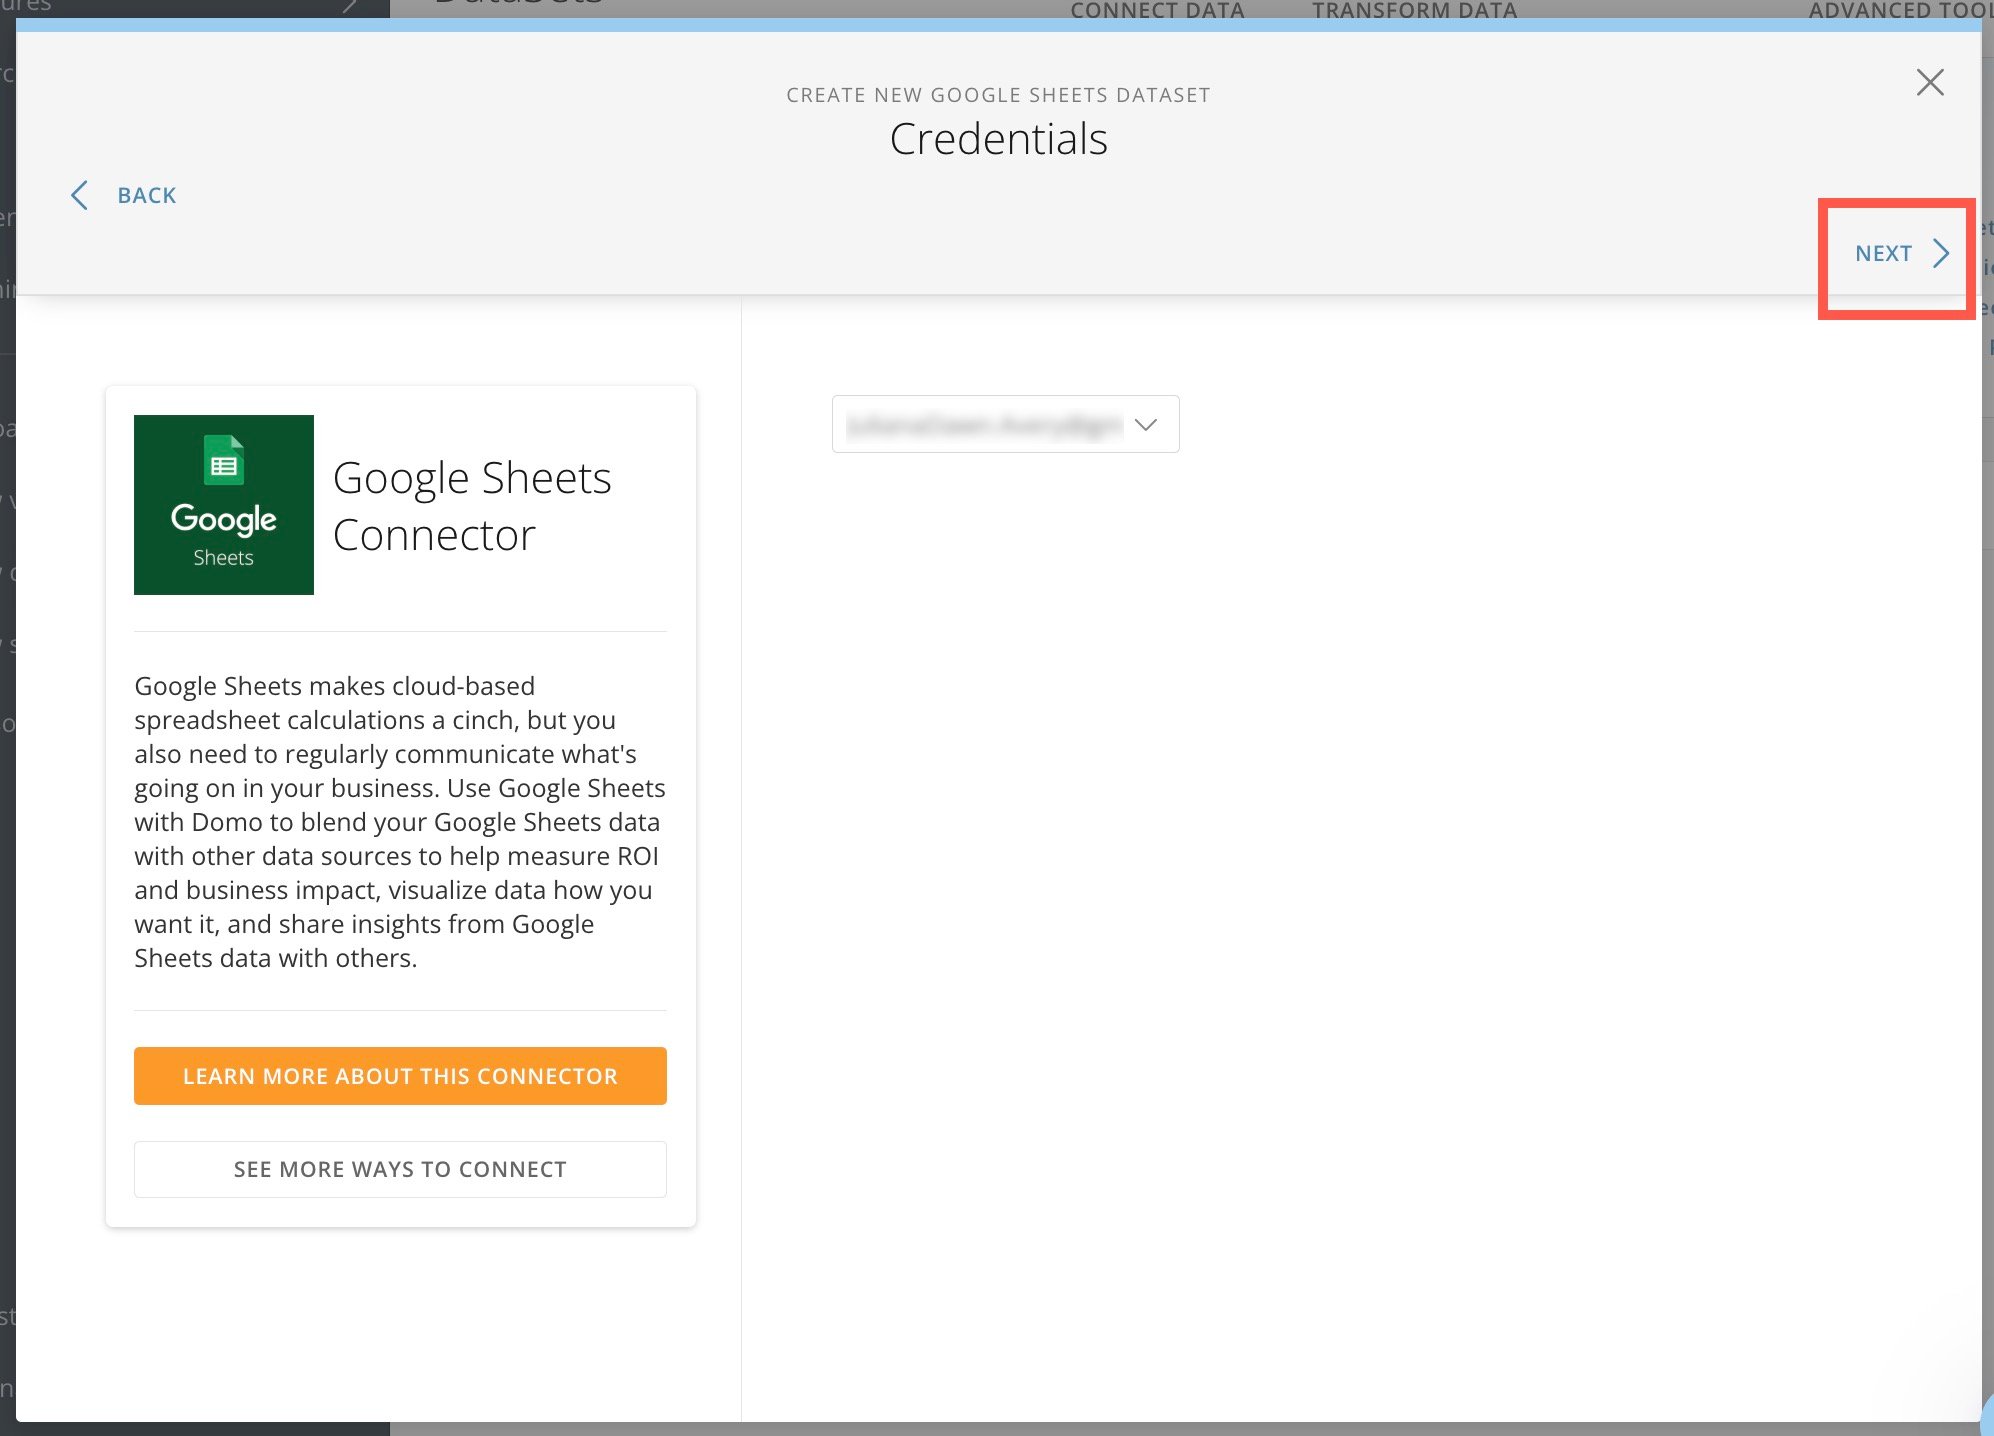
**Connect** option to choose a Google account. If you need to authenticate your Google account, a pop-up window guides you through the process.
5. In the top right corner of the connector modal, select
**Next**.
**Important:**
It's important to understand that Domo offers different connectors for different needs. For instance, there are separate Facebook connectors for organic and paid traffic. Similarly, Domo provides various connectors to Google Sheets, depending on the data integration requirements.
**Connect with the Google Sheets Connector**
4. Use the
**Connect** option to choose a Google account. If you need to authenticate your Google account, a pop-up window guides you through the process.
5. In the top right corner of the connector modal, select
**Next**.
 6. In the
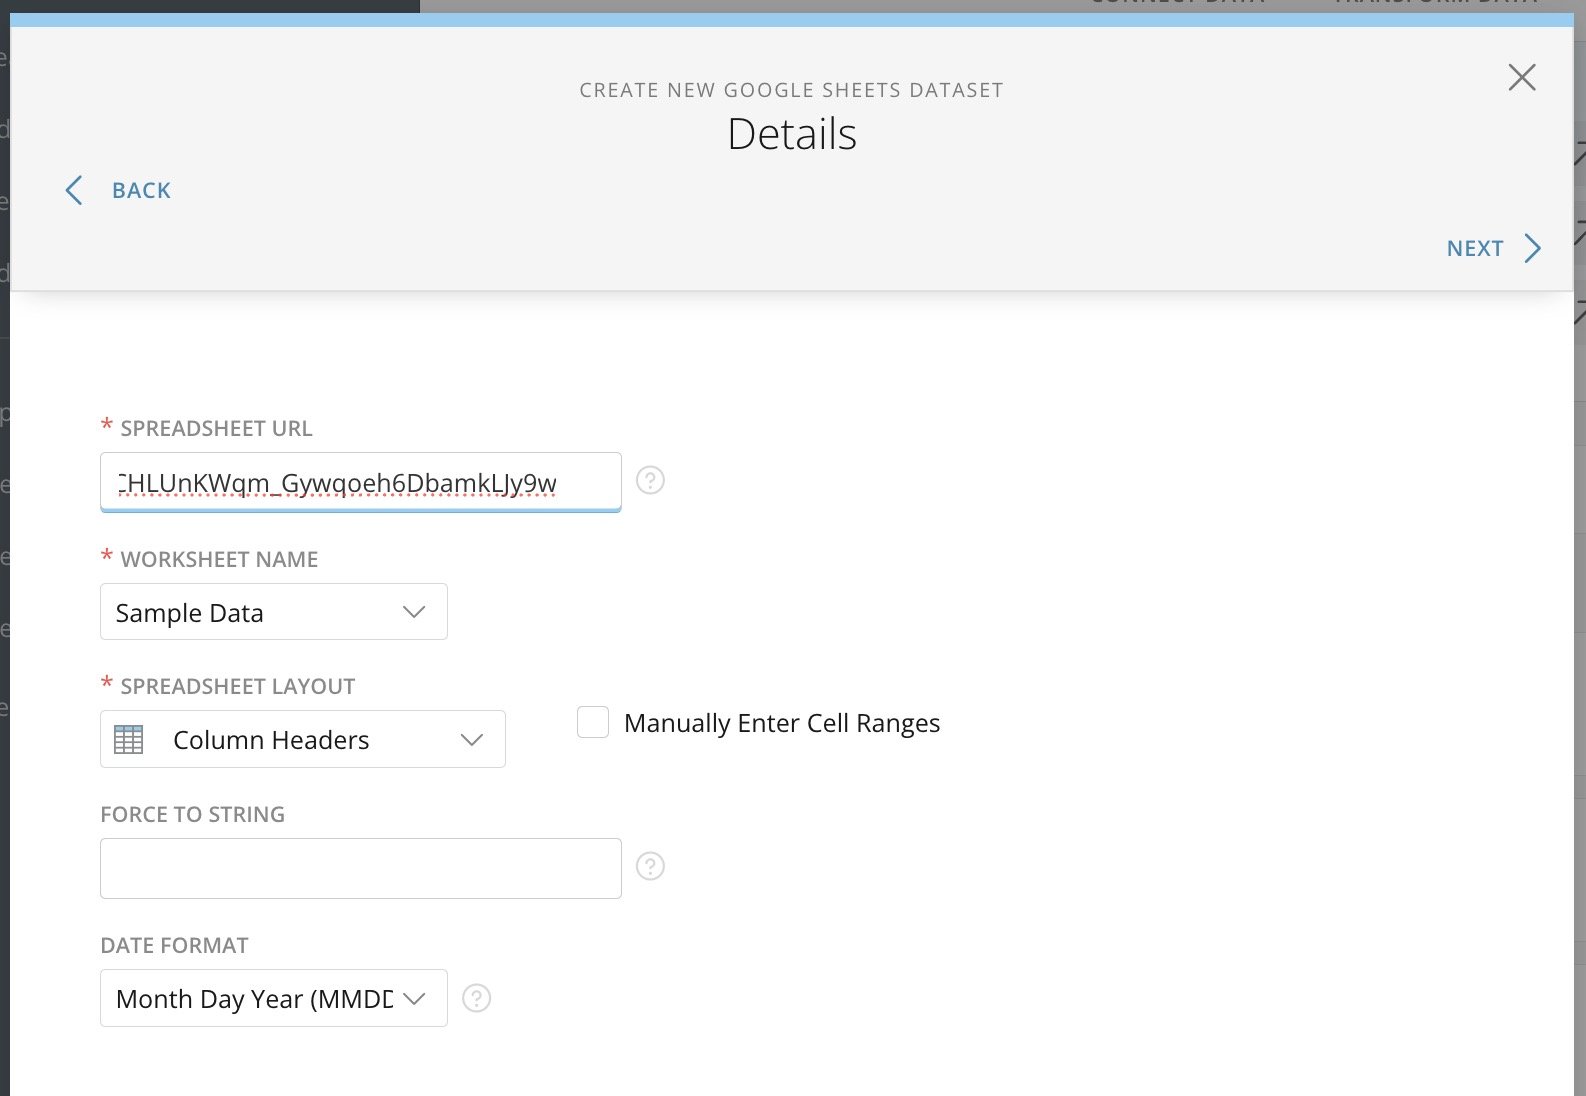
**Spreadsheet URL** field, enter the spreadsheet IDs from the [prerequisites](#prerequisites) section above and select **Next**.
In the next steps, the example uses the Sales Data file and spreadsheet ID. Repeat these steps for the Marketing Data, so we can use both DataSets later in this tutorial.
6. In the
**Spreadsheet URL** field, enter the spreadsheet IDs from the [prerequisites](#prerequisites) section above and select **Next**.
In the next steps, the example uses the Sales Data file and spreadsheet ID. Repeat these steps for the Marketing Data, so we can use both DataSets later in this tutorial.
 **Schedule Updates**
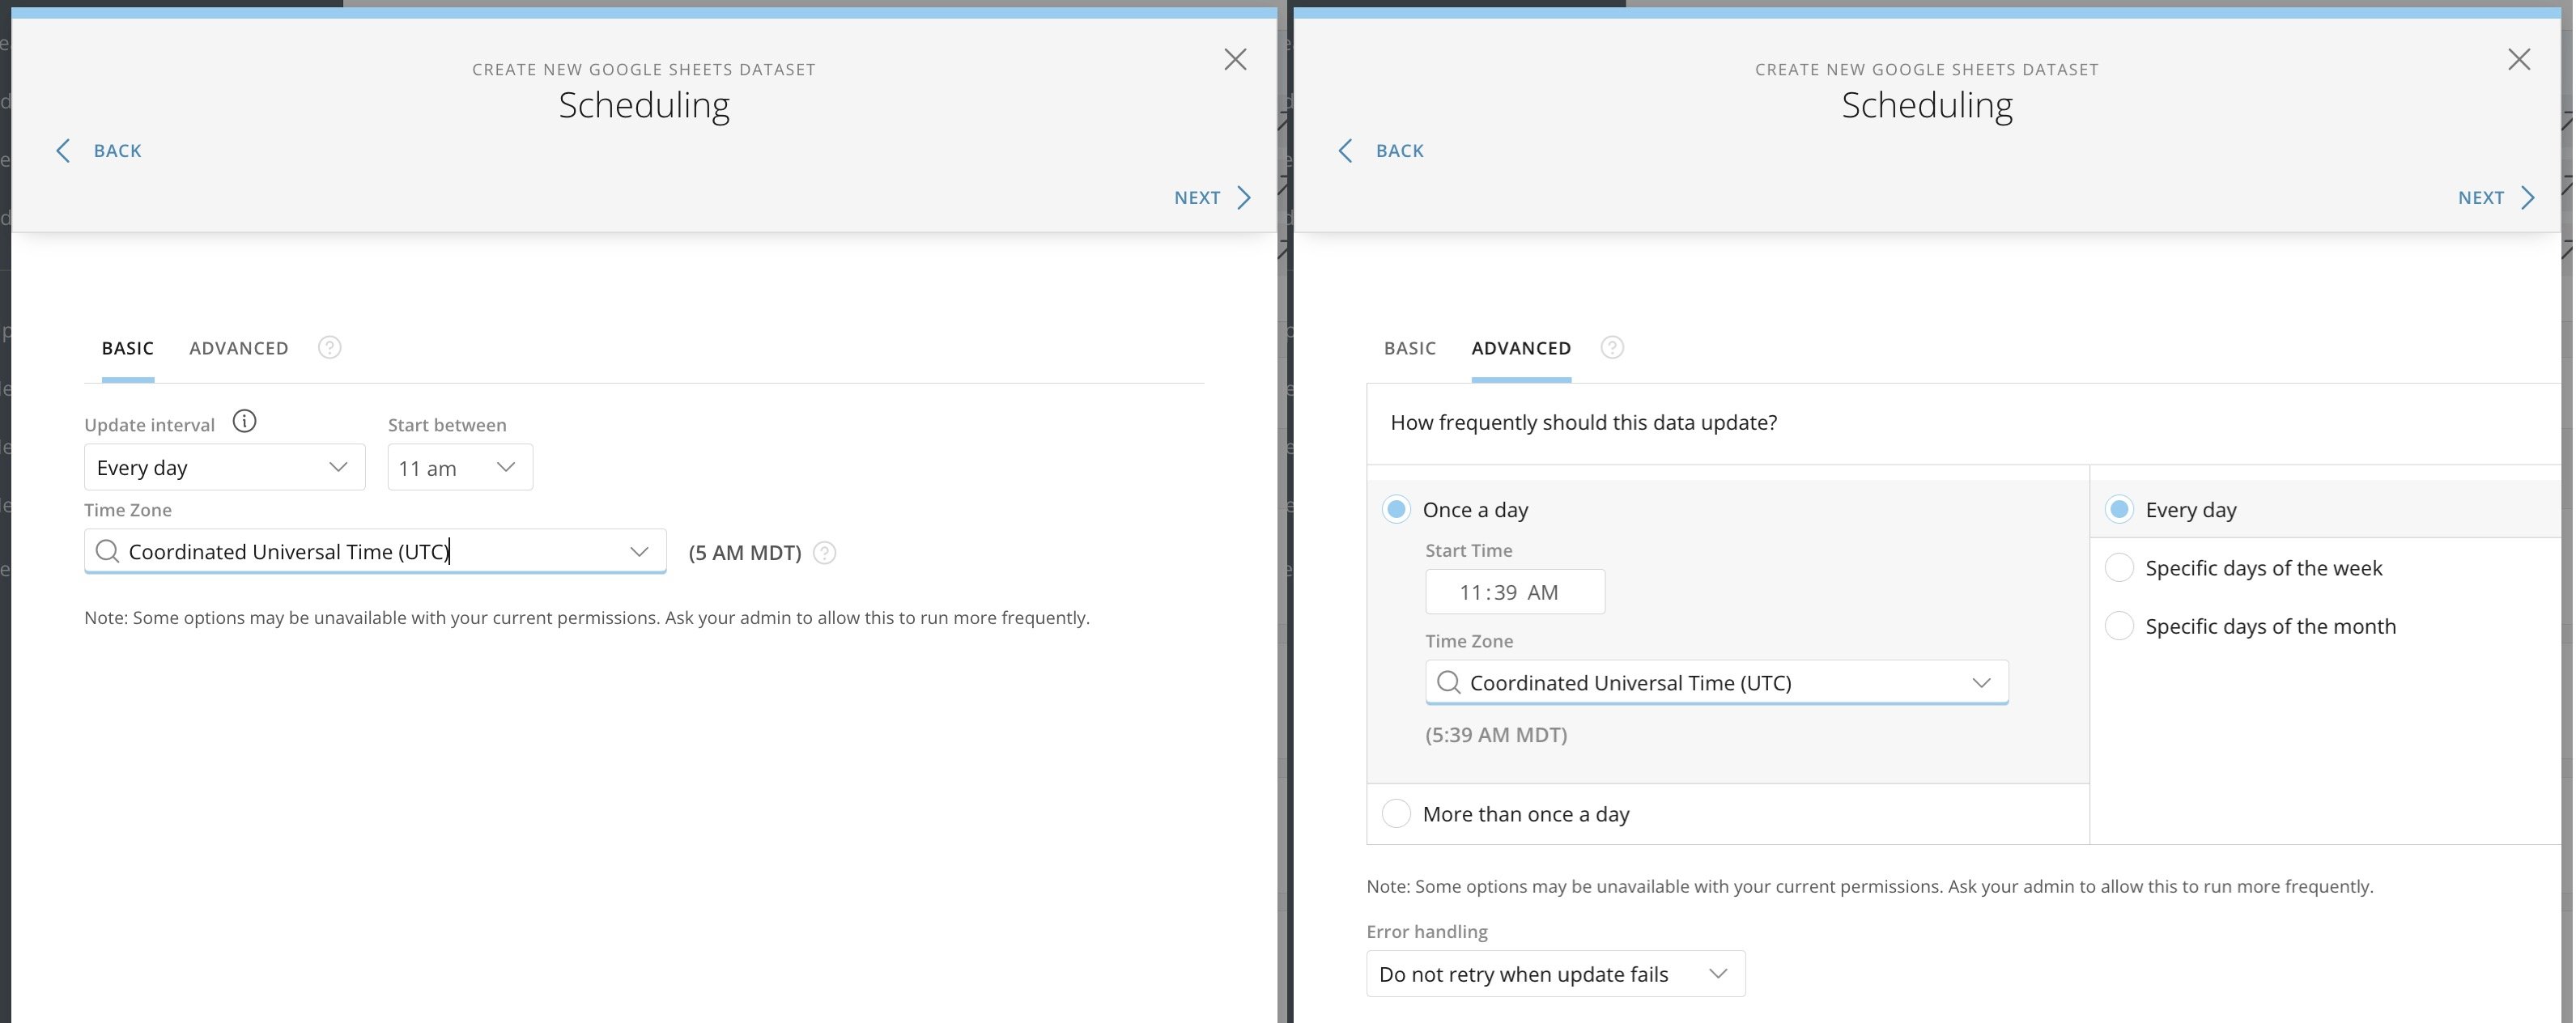
After connecting to your data, decide how frequently you want to update it. Remember, data pulls consume credits, so choose a frequency that balances need and resource consumption. The **Advanced** tab allows you choose to pull the data more than once a day or on specific days of the week or month.
7. Use the
**Basic** and **Advanced** tabs to set a schedule for data updates. Some options may be unavailable with your current permissions. You can ask your admin to allow the data to update more frequently. When ready, select **Next**.
**Schedule Updates**
After connecting to your data, decide how frequently you want to update it. Remember, data pulls consume credits, so choose a frequency that balances need and resource consumption. The **Advanced** tab allows you choose to pull the data more than once a day or on specific days of the week or month.
7. Use the
**Basic** and **Advanced** tabs to set a schedule for data updates. Some options may be unavailable with your current permissions. You can ask your admin to allow the data to update more frequently. When ready, select **Next**.
 **Finalize Your Connection**
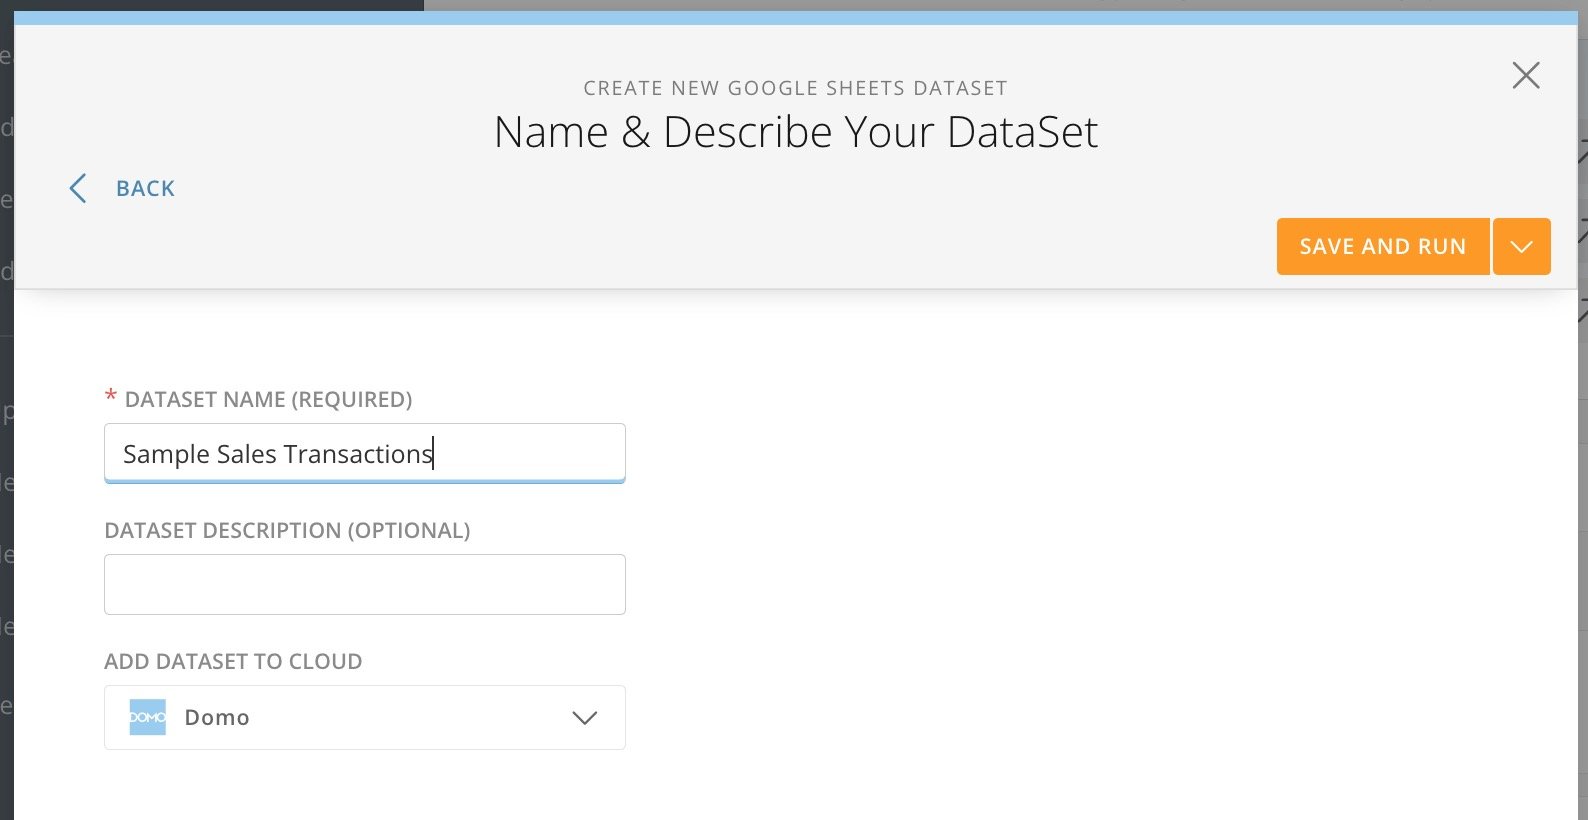
7. Give your DataSet a name and optional description so you can easily identify it later. Select
**Save and Run**.
**Finalize Your Connection**
7. Give your DataSet a name and optional description so you can easily identify it later. Select
**Save and Run**.
 8. Repeat these steps for the Marketing Data with the spreadsheet ID listed
[above](#prerequisites) .
You've successfully used the Google Sheets connector to add two DataSets to Domo!
### Build a Sample ETL
This guide provides step-by-step instructions for building an ETL (Extract, Transform, Load) process that connects sales data to zip codes and FIPS codes. This enriches the sales data with geographical details like city, state, and county, which are critical for location-based analytics.
**Note:**
It's not always necessary to join data sources and clean them in Domo, but this tutorial is good practice for how to join different systems.
# Prerequisites
Make sure you have the following:
* Access to Domo with necessary permissions.
* The Sales Data and ZIP-to-FIPS DataSets in Domo. If you haven't imported them, see the
[prerequisites](#prerequisites) and [Connect to Sample Google Sheets Data](#connect_to_google_sheets) sections above.
When you're ready, follow the steps below:
**Examine the Data**
1. Log into Domo and use the left navigation to go to
**Features** > **DataSets**.
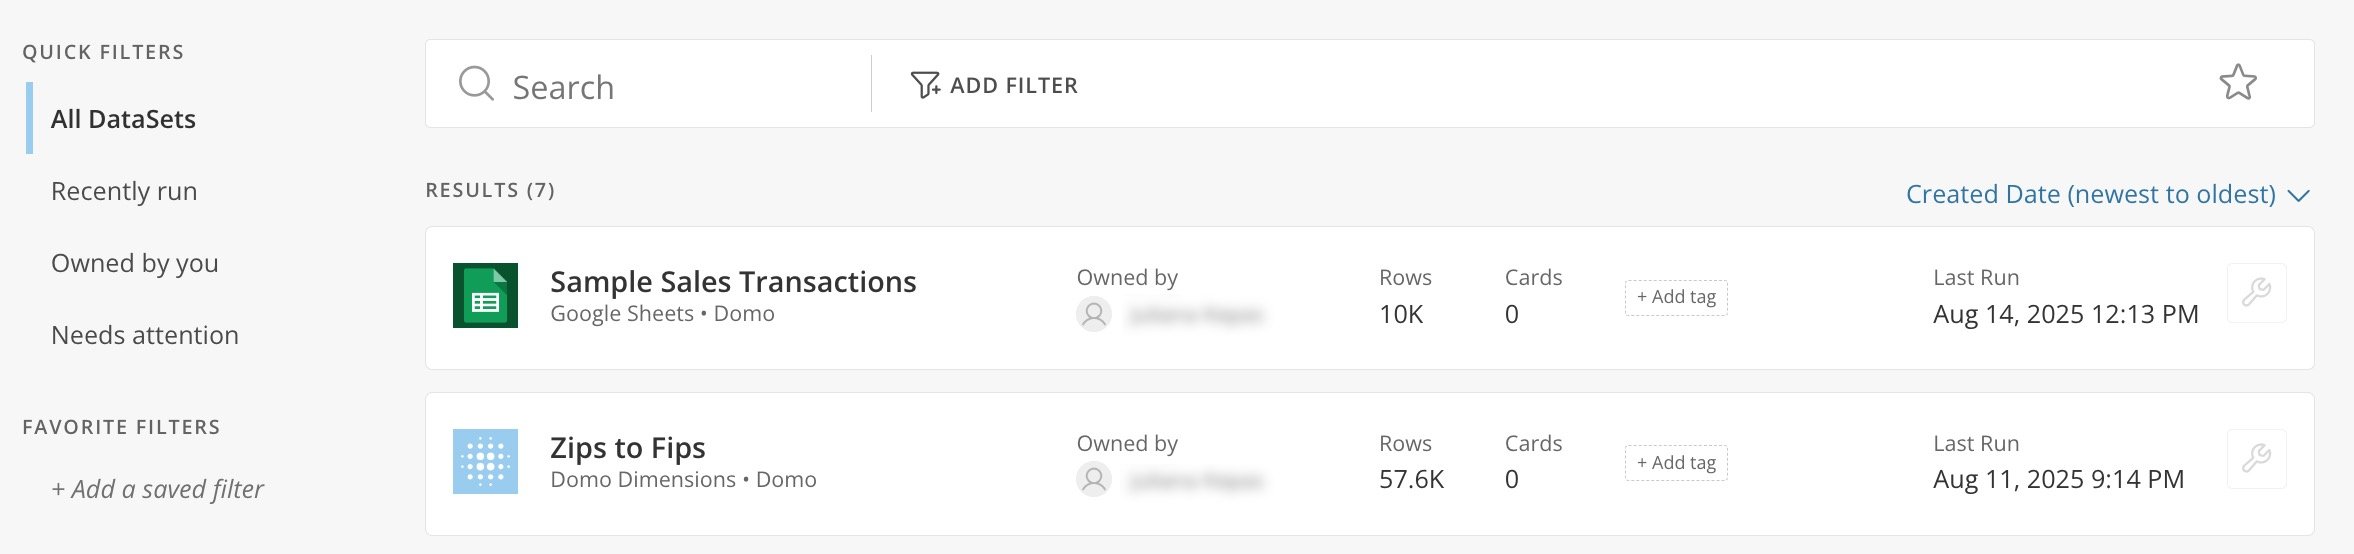
2. Make sure both the Samples Sales Transactions and Zips to Fips DataSets are available.
8. Repeat these steps for the Marketing Data with the spreadsheet ID listed
[above](#prerequisites) .
You've successfully used the Google Sheets connector to add two DataSets to Domo!
### Build a Sample ETL
This guide provides step-by-step instructions for building an ETL (Extract, Transform, Load) process that connects sales data to zip codes and FIPS codes. This enriches the sales data with geographical details like city, state, and county, which are critical for location-based analytics.
**Note:**
It's not always necessary to join data sources and clean them in Domo, but this tutorial is good practice for how to join different systems.
# Prerequisites
Make sure you have the following:
* Access to Domo with necessary permissions.
* The Sales Data and ZIP-to-FIPS DataSets in Domo. If you haven't imported them, see the
[prerequisites](#prerequisites) and [Connect to Sample Google Sheets Data](#connect_to_google_sheets) sections above.
When you're ready, follow the steps below:
**Examine the Data**
1. Log into Domo and use the left navigation to go to
**Features** > **DataSets**.
2. Make sure both the Samples Sales Transactions and Zips to Fips DataSets are available.
 3. Select
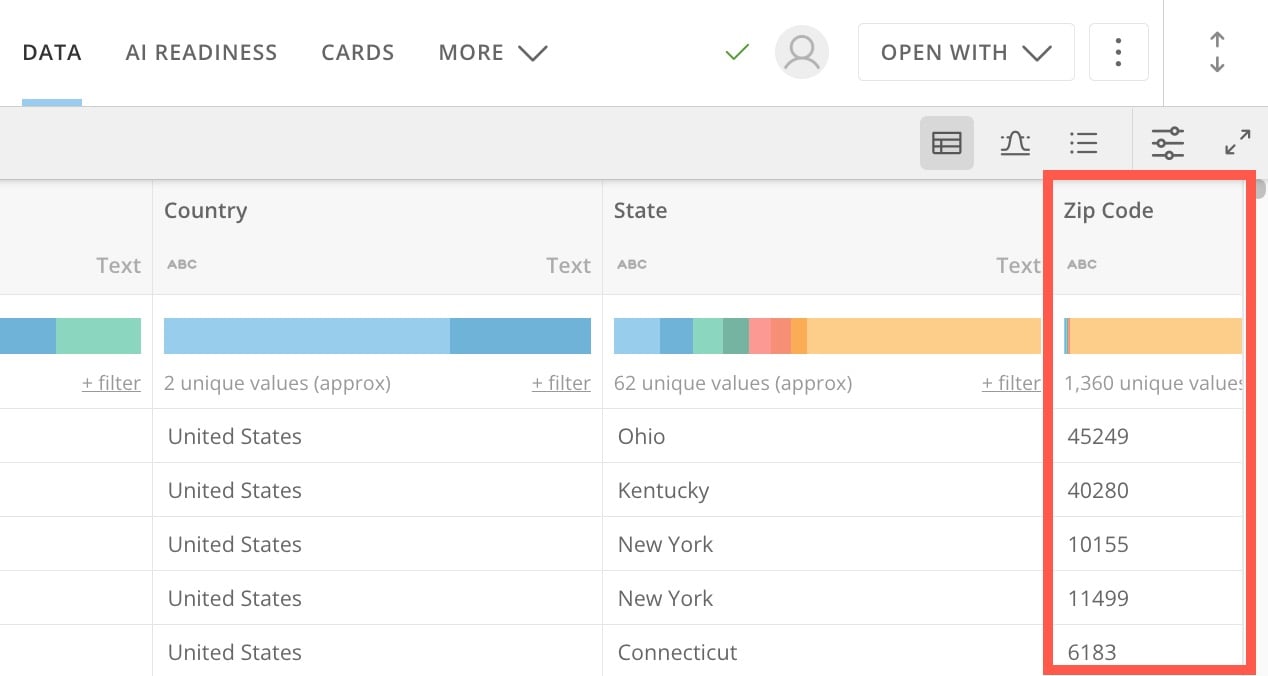
**Sample Sales Transactions** and look at the **Data** tab to understand its structure and identify the column it shares with the Zips to Fips data. in this case, the ZIP code. Here, the column is called `Zip Code.`
3. Select
**Sample Sales Transactions** and look at the **Data** tab to understand its structure and identify the column it shares with the Zips to Fips data. in this case, the ZIP code. Here, the column is called `Zip Code.`
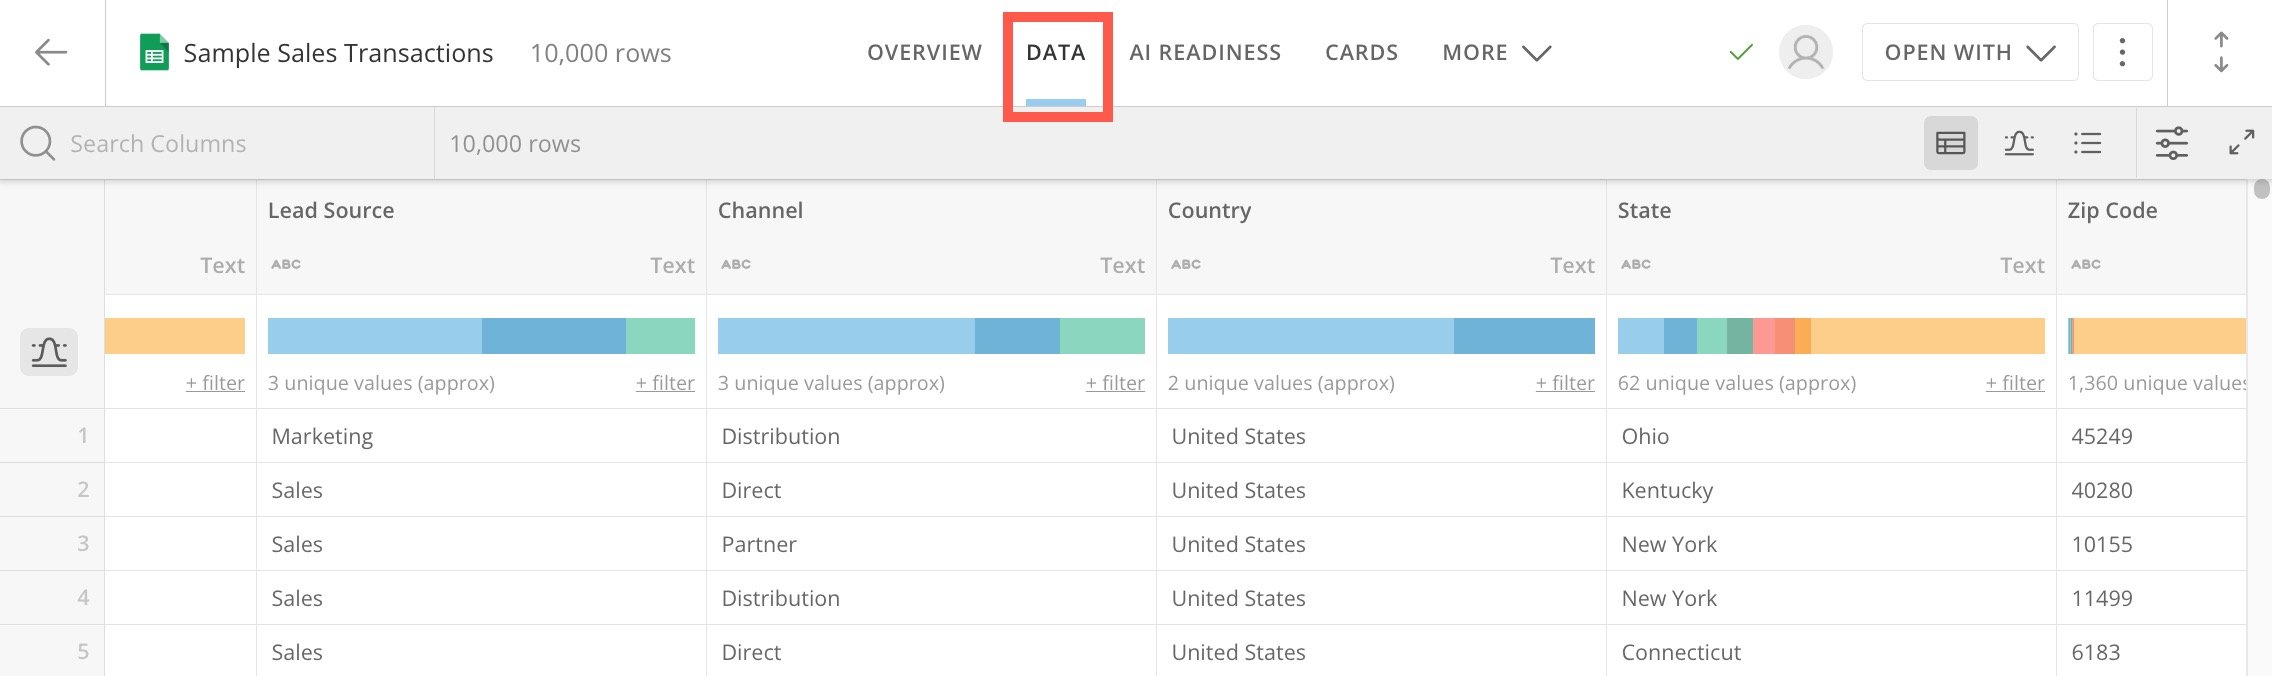 4. Make sure the `Zip Code` column is formatted correctly.
 5. Return to the DataSets interface and select
**Zips to Fips**.
6. In the
**Data** tab, use the search columns tool to find potential ZIP codes to match the sales data.
5. Return to the DataSets interface and select
**Zips to Fips**.
6. In the
**Data** tab, use the search columns tool to find potential ZIP codes to match the sales data.
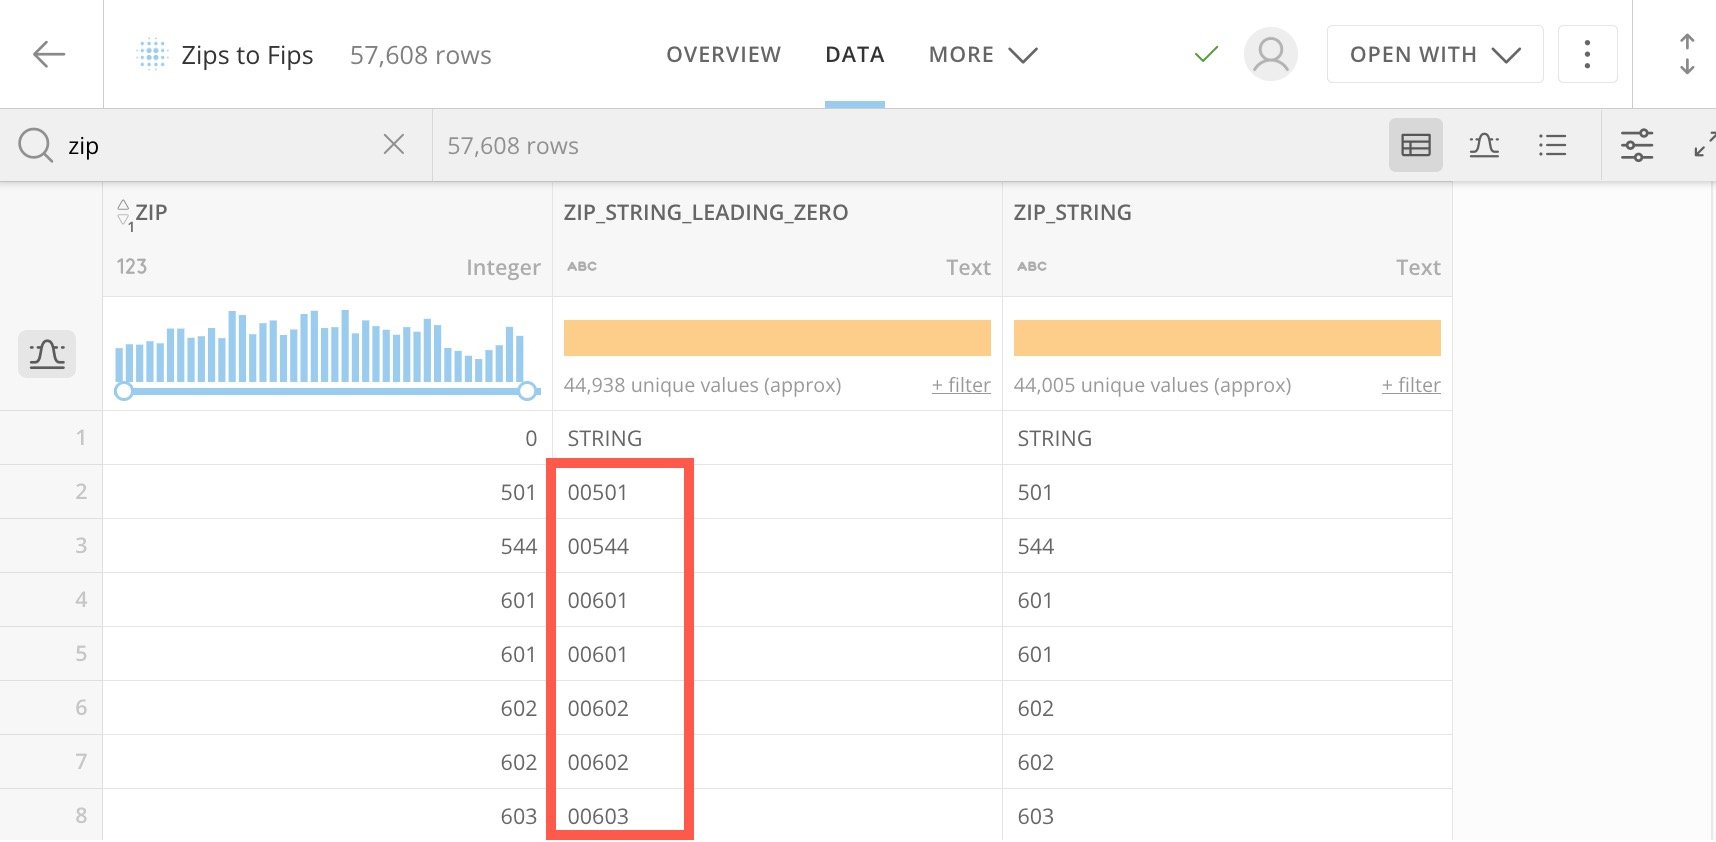
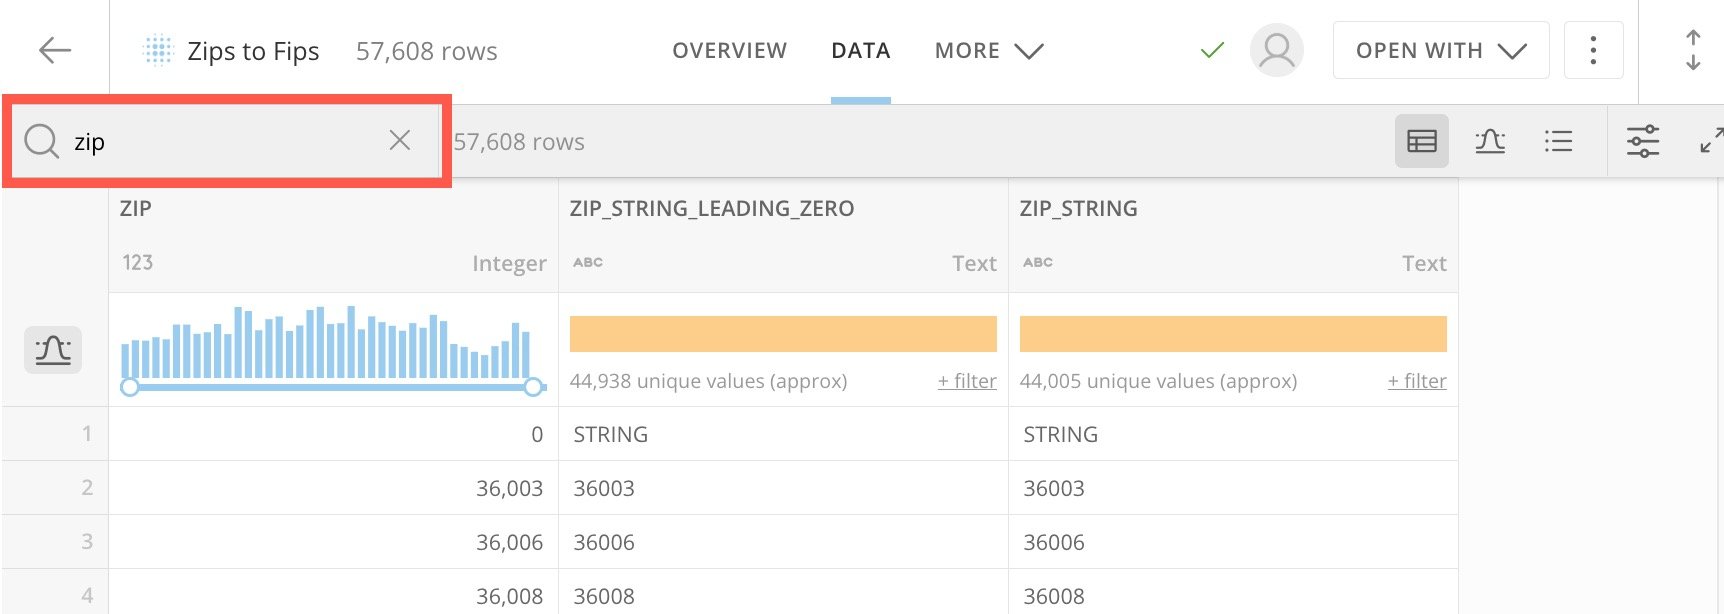 7. Three columns are returned as results. Note that the `ZIP` and `ZIP\_STRING` columns don't retain leading zeroes. We need the leading zeroes to match against our sales data, so we want to use the `ZIP\_STRING\_LEADING\_ZERO` column.
In this image, note the leading zeroes.
7. Three columns are returned as results. Note that the `ZIP` and `ZIP\_STRING` columns don't retain leading zeroes. We need the leading zeroes to match against our sales data, so we want to use the `ZIP\_STRING\_LEADING\_ZERO` column.
In this image, note the leading zeroes.
 You're now ready to create your first ETL.
**Open Magic ETL**
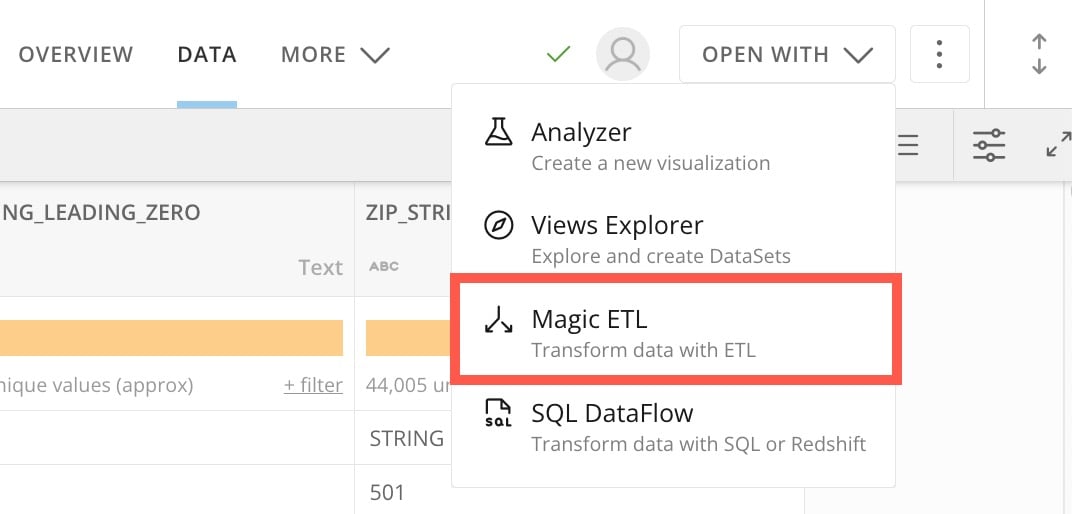
8. From the Zips to Fips data, select
**Open With** > **Magic ETL**.
You're now ready to create your first ETL.
**Open Magic ETL**
8. From the Zips to Fips data, select
**Open With** > **Magic ETL**.
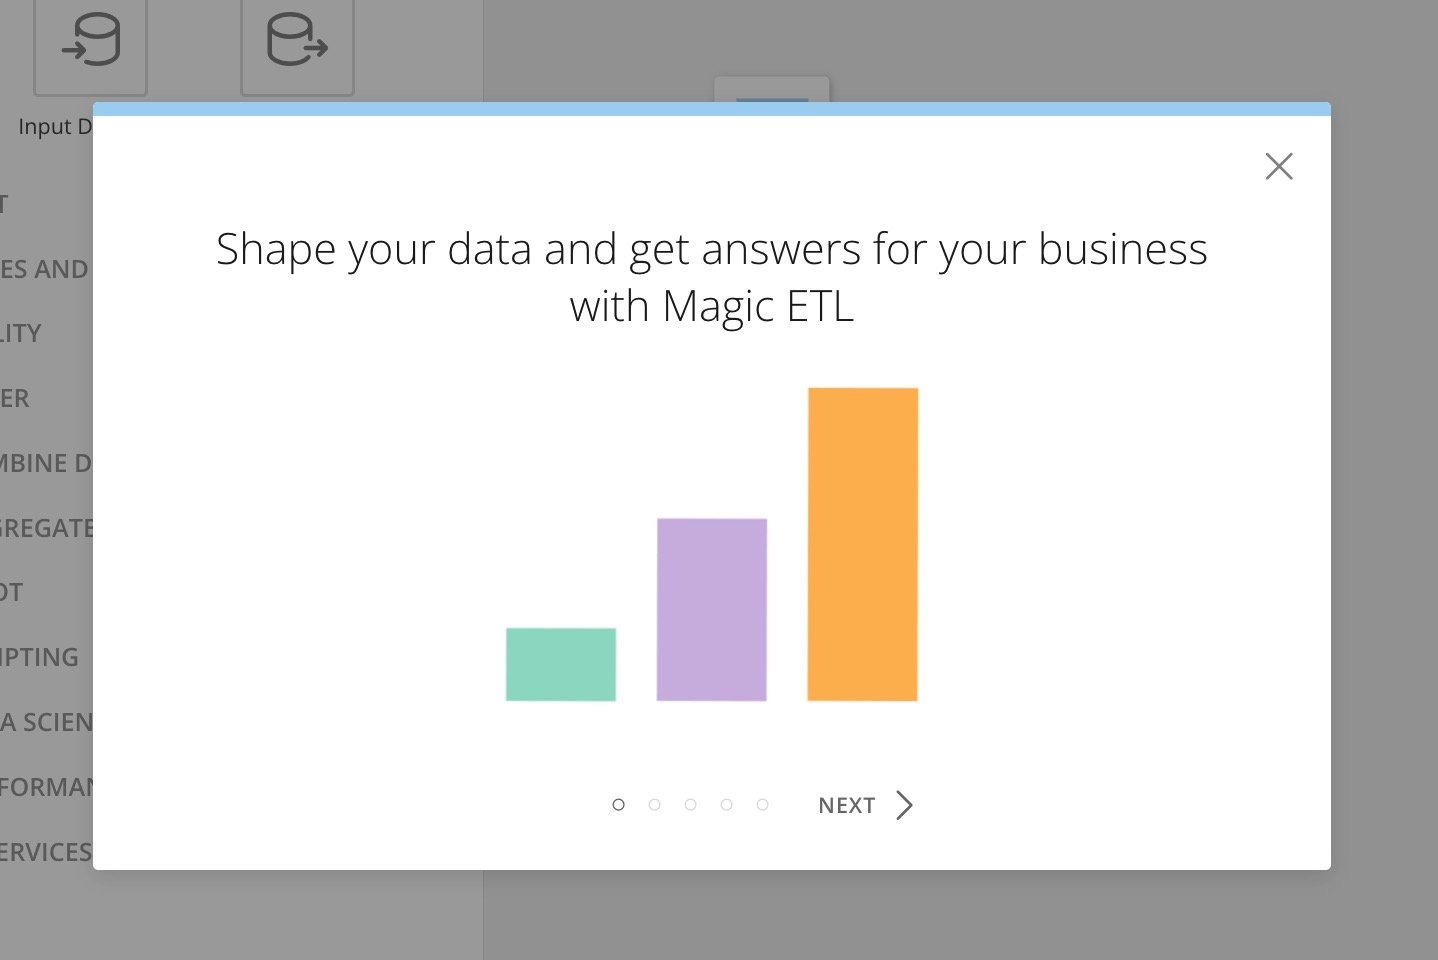
 9. Review the training pop-ups as needed, then close them.
 **Tip:**
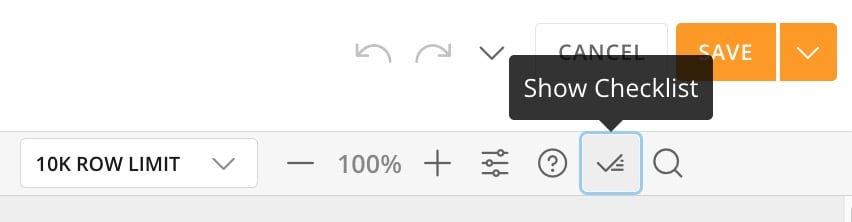
The Magic ETL checklist is great for making sure things are configured properly. Toggle the checklist by selecting
**Show Checklist**
(checkmark icon) in the toolbar above the Magic ETL canvas.
**Tip:**
The Magic ETL checklist is great for making sure things are configured properly. Toggle the checklist by selecting
**Show Checklist**
(checkmark icon) in the toolbar above the Magic ETL canvas.
 **Configure ETL Inputs**
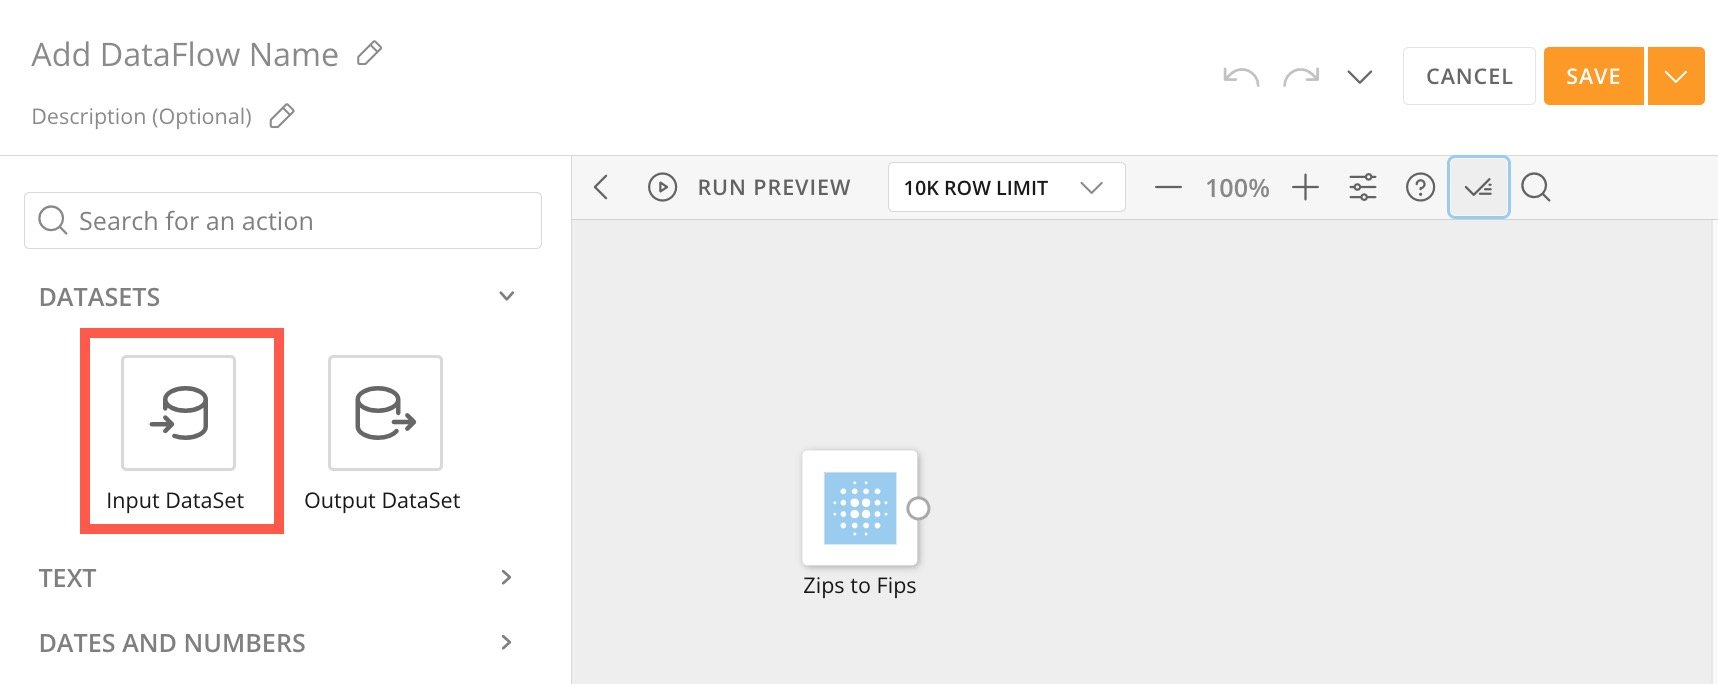
10. From the panel to the left of the canvas under
**DataSets** , drag an **Input DataSet** tile to the canvas.
**Configure ETL Inputs**
10. From the panel to the left of the canvas under
**DataSets** , drag an **Input DataSet** tile to the canvas.
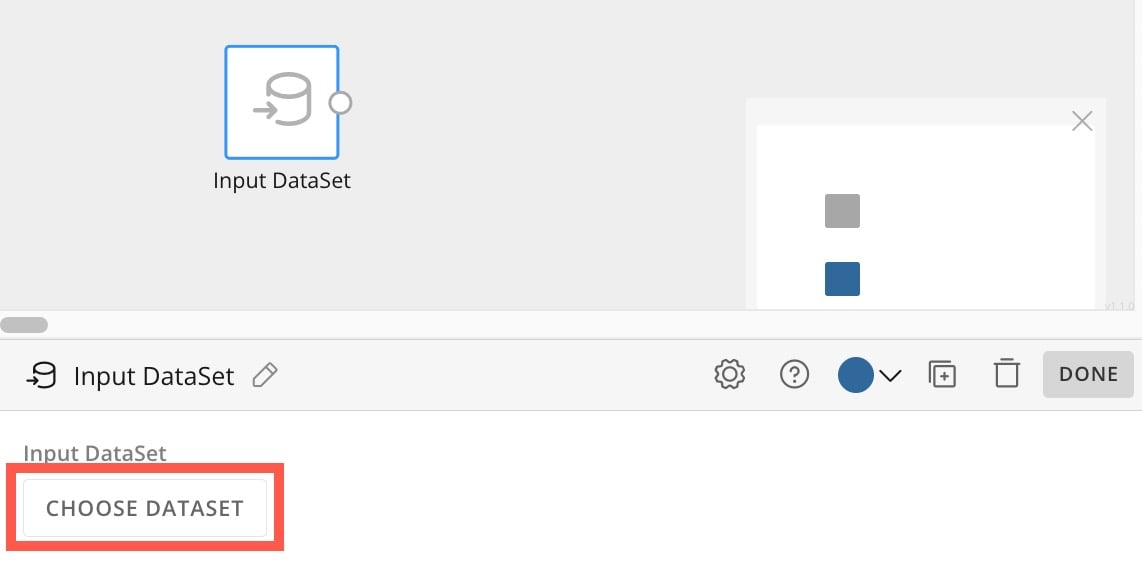
 11. In the tile configuration area below the canvas, select
**Choose DataSet** to open the data selection modal.
11. In the tile configuration area below the canvas, select
**Choose DataSet** to open the data selection modal.
 12. Find and select `Sample Sales Transactions` and select
**Choose DataSet** to return to the canvas.
12. Find and select `Sample Sales Transactions` and select
**Choose DataSet** to return to the canvas.
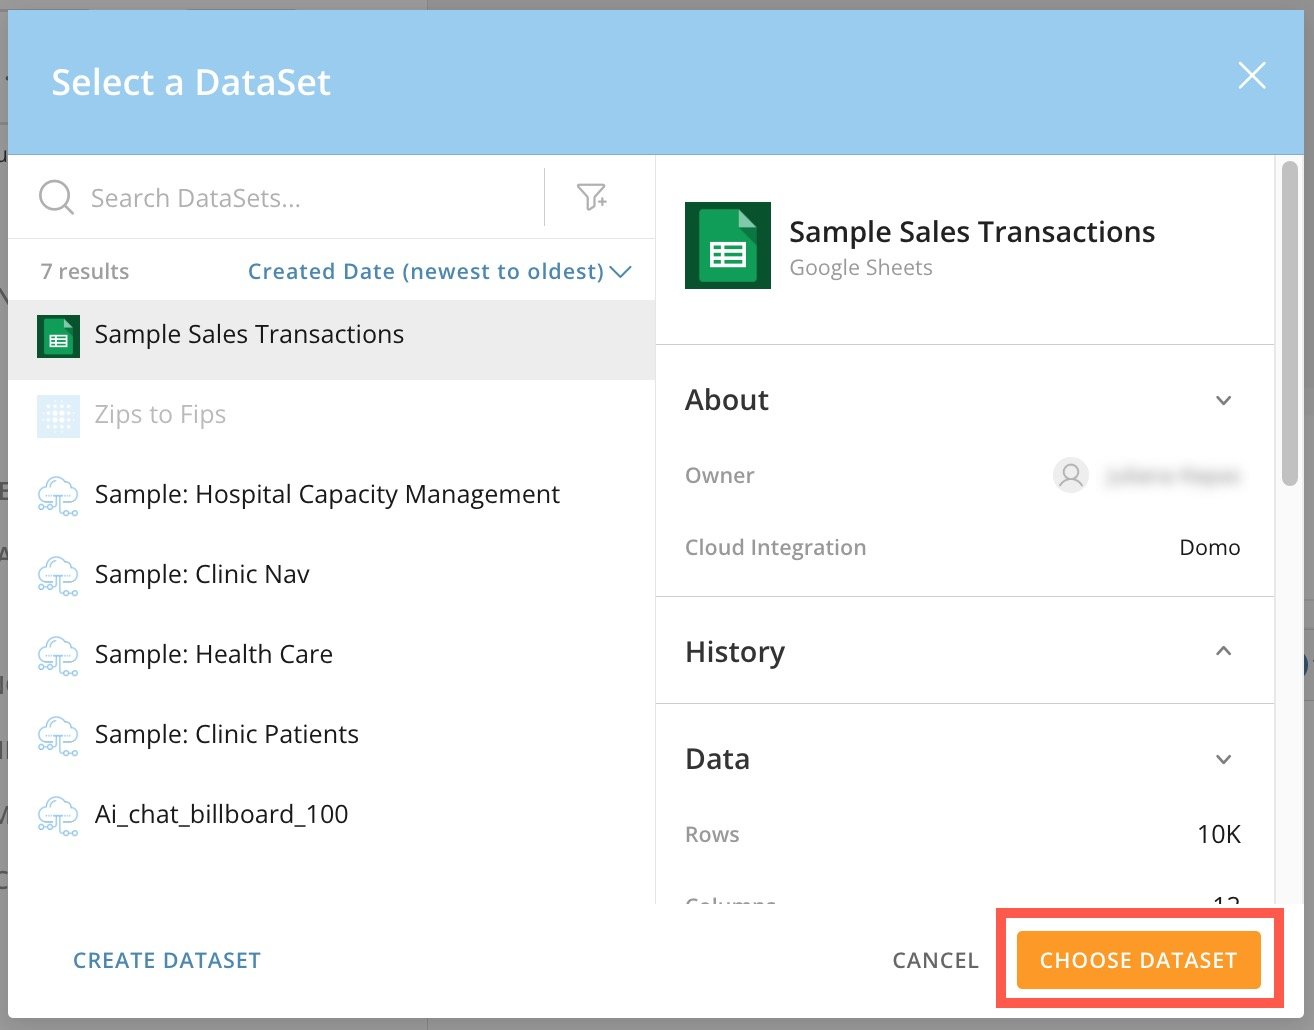 With the data brought into Magic ETL, we're now ready to transform it.
**Add Transform Tiles**
13. From the left panel under
**Utility** , drag a Select Columns tile to the canvas and connect the node for the Sample Sales Transactions data to it by clicking and dragging.
With the data brought into Magic ETL, we're now ready to transform it.
**Add Transform Tiles**
13. From the left panel under
**Utility** , drag a Select Columns tile to the canvas and connect the node for the Sample Sales Transactions data to it by clicking and dragging.
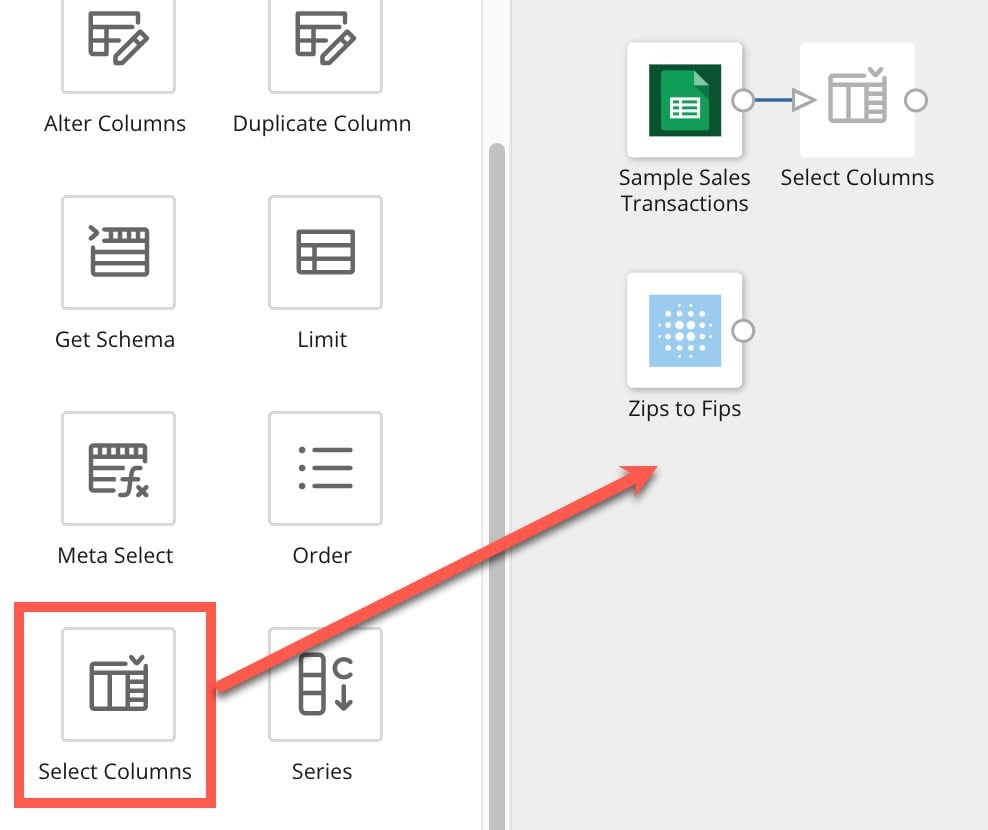
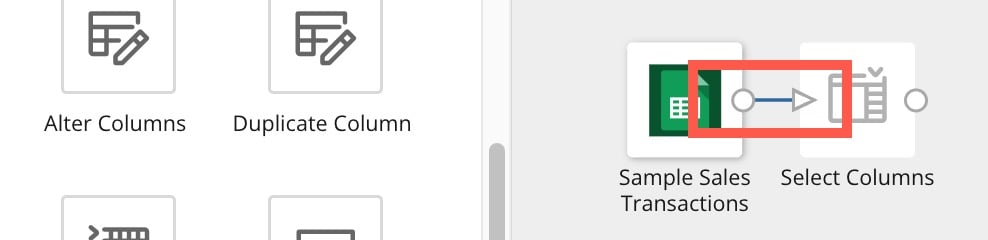 14. Add a second Select Columns tile and connect it to the Zips to Fips data.
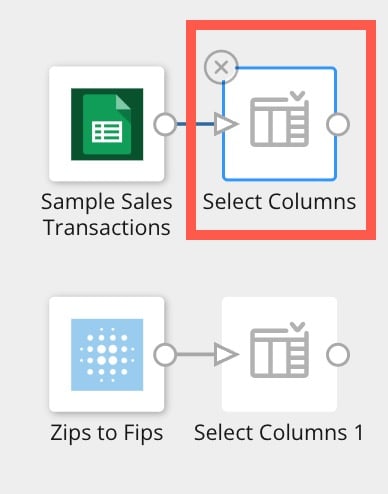
 15. Choose the Select Columns tile connected to the sales data to open the tile configuration area.
 16. Select
**Add All**
**Columns**
.
16. Select
**Add All**
**Columns**
.
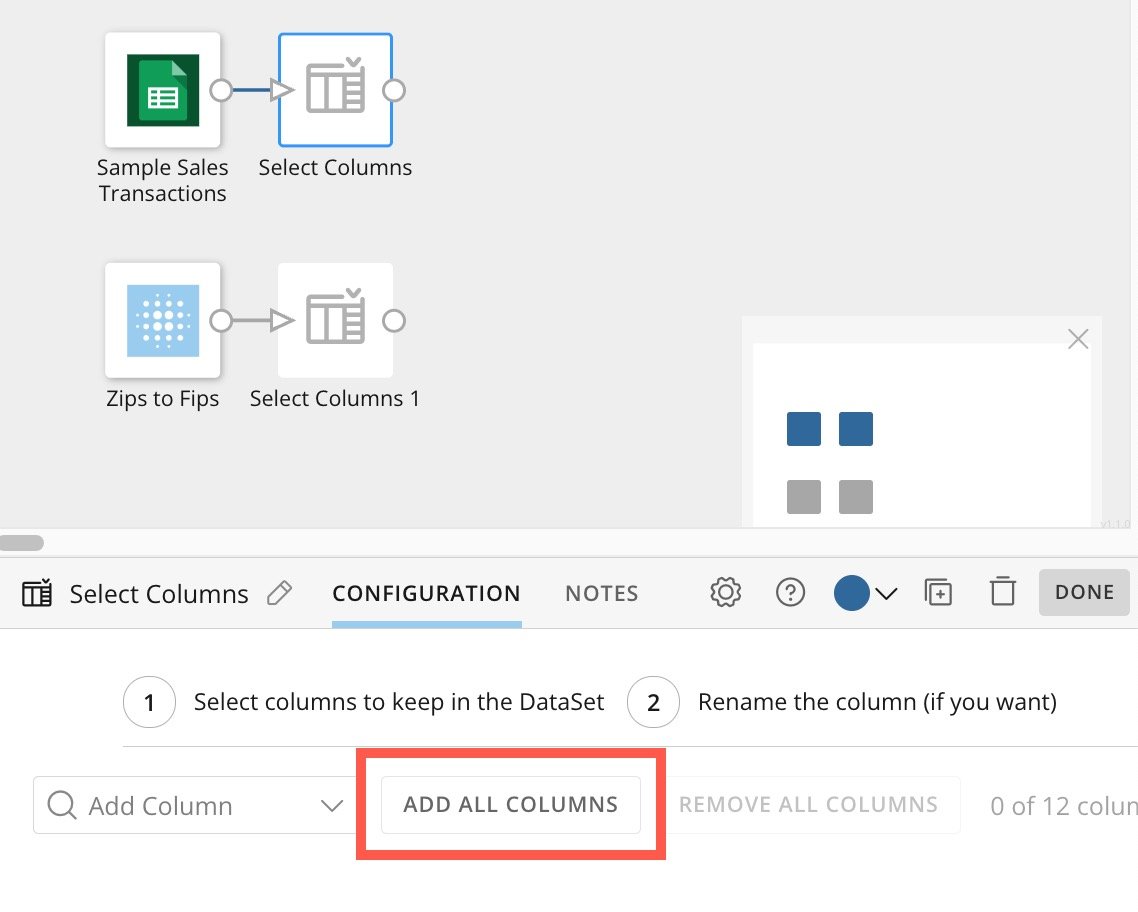 17. Repeat these steps to add all columns for the Zips to Fips data. Although we know we only want one of the ZIP code columns, it can be easiest to add all columns at first and then remove the ones we don't want.
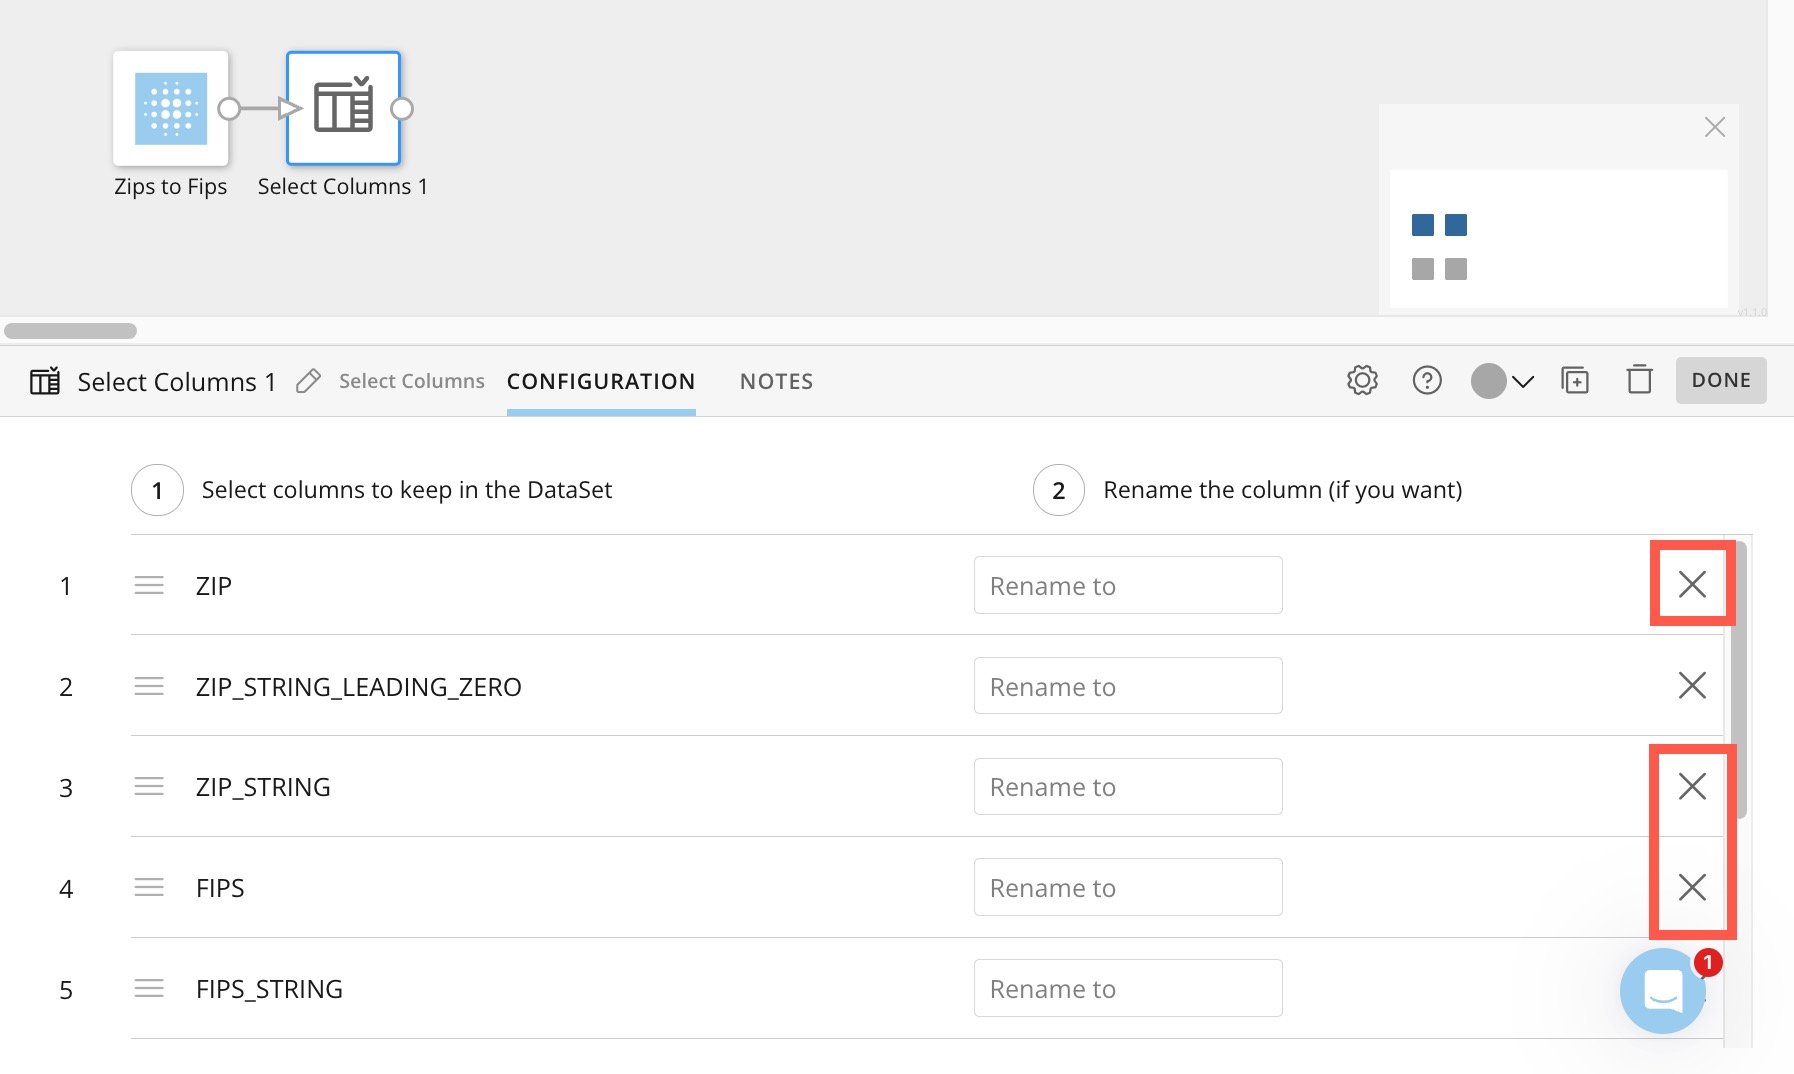
18. Now we can remove the ZIP columns we don't need by using the remove options (X icon) at the far right of every column row in the tile configuration tab.
17. Repeat these steps to add all columns for the Zips to Fips data. Although we know we only want one of the ZIP code columns, it can be easiest to add all columns at first and then remove the ones we don't want.
18. Now we can remove the ZIP columns we don't need by using the remove options (X icon) at the far right of every column row in the tile configuration tab.
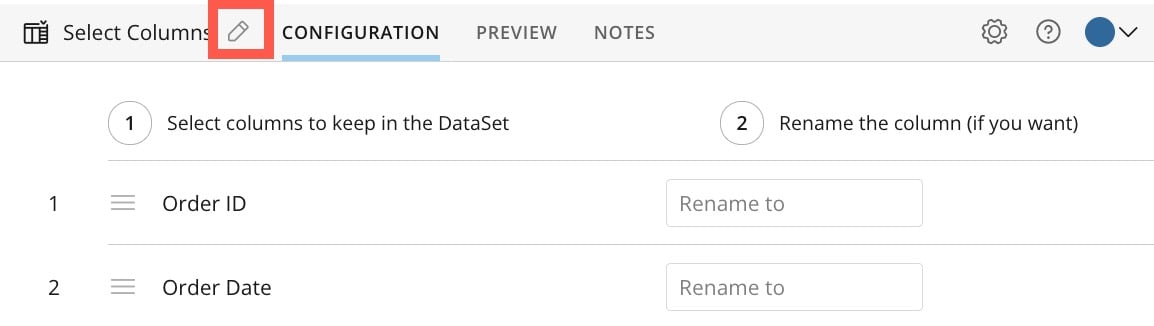
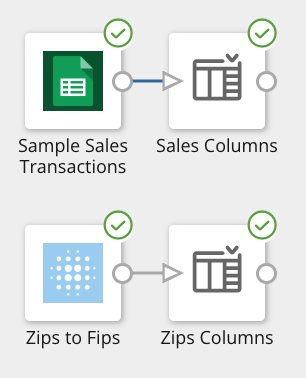
 19. (Recommended) To make your DataFlow easier to configure, we recommend renaming your Select Columns tiles. In this example, we rename the first Select Columns tile to Sales Columns. Select the column to view the tile's configuration. Then use the
**Edit** option (pencil icon) to rename the tile. We'll rename the other Select Columns tile to Zips Columns.
19. (Recommended) To make your DataFlow easier to configure, we recommend renaming your Select Columns tiles. In this example, we rename the first Select Columns tile to Sales Columns. Select the column to view the tile's configuration. Then use the
**Edit** option (pencil icon) to rename the tile. We'll rename the other Select Columns tile to Zips Columns.
 **Tip:**
Running a preview is a great way to be confident in your data configuration. After the green checks are present, we can inspect the data.
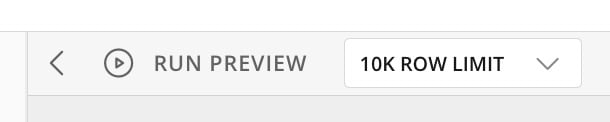
20. (Optional) Select
**Run Preview** at the top of the canvas. If the preview is successful, green checkmarks display for each tile.
**Tip:**
Running a preview is a great way to be confident in your data configuration. After the green checks are present, we can inspect the data.
20. (Optional) Select
**Run Preview** at the top of the canvas. If the preview is successful, green checkmarks display for each tile.
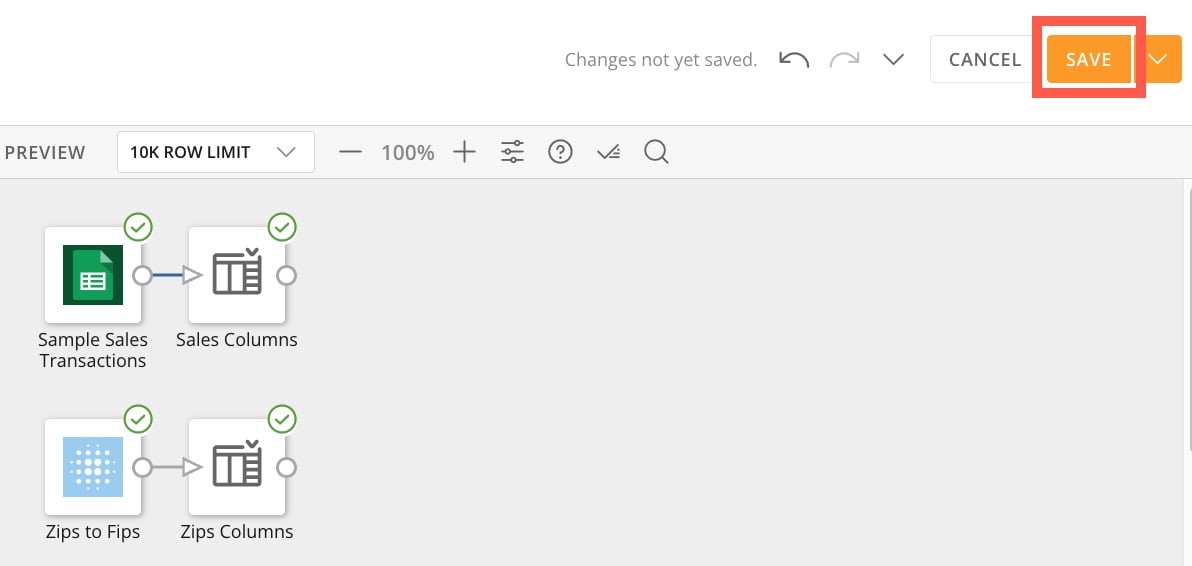
 21. Use the
**Save** option in the top right corner of the canvas often to preserve your DataFlow. You can make notes about the version or simply save.
21. Use the
**Save** option in the top right corner of the canvas often to preserve your DataFlow. You can make notes about the version or simply save.
 **Create a Join**
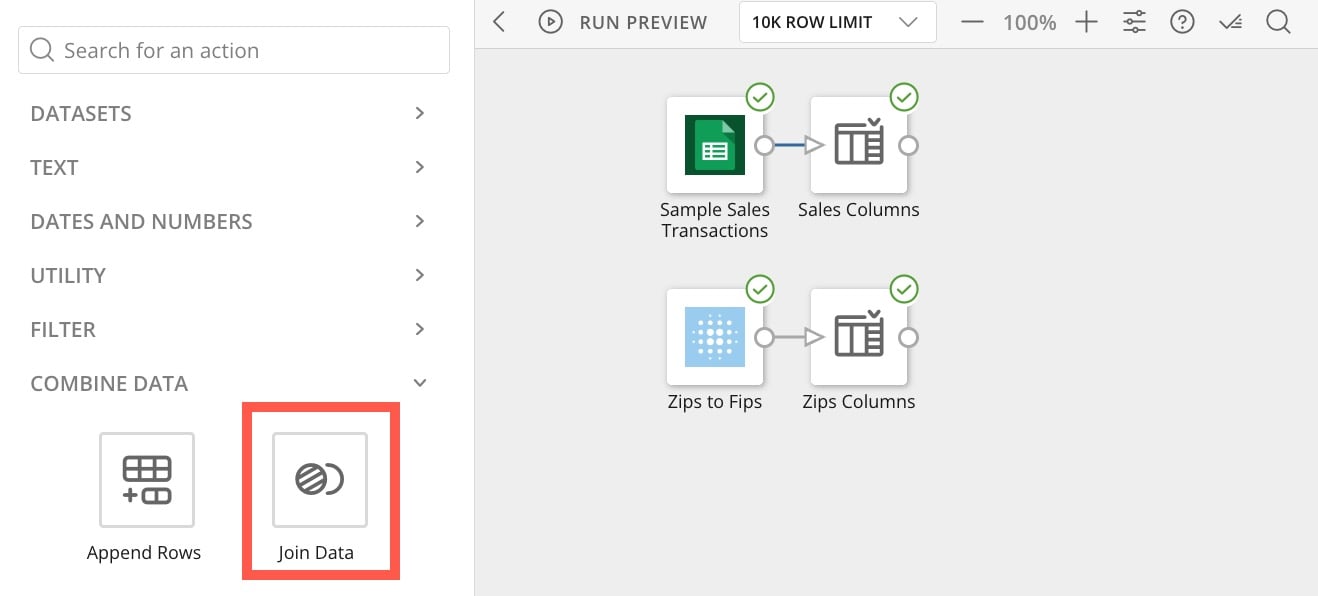
22. From the left panel under
**Combine Data** , drag a Join Data tile to the canvas.
**Create a Join**
22. From the left panel under
**Combine Data** , drag a Join Data tile to the canvas.
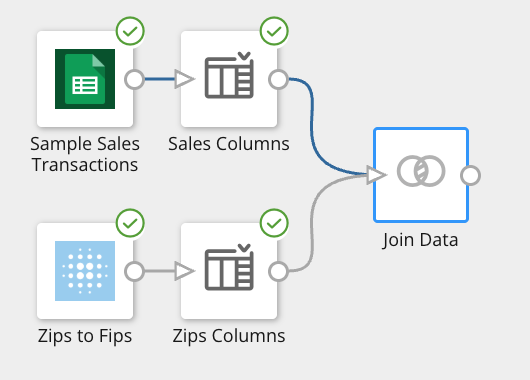
 23. Drag the right node from the Sales Columns tile to the triangle on the Join Data tile to connect them. Repeat for the Zips Columns tile.
 **Configure the Join**
24. Select the Join Data tile to open the tile configuration area.
25. Use the
**Join Type** dropdown to choose a Left Outer join.
**Configure the Join**
24. Select the Join Data tile to open the tile configuration area.
25. Use the
**Join Type** dropdown to choose a Left Outer join.
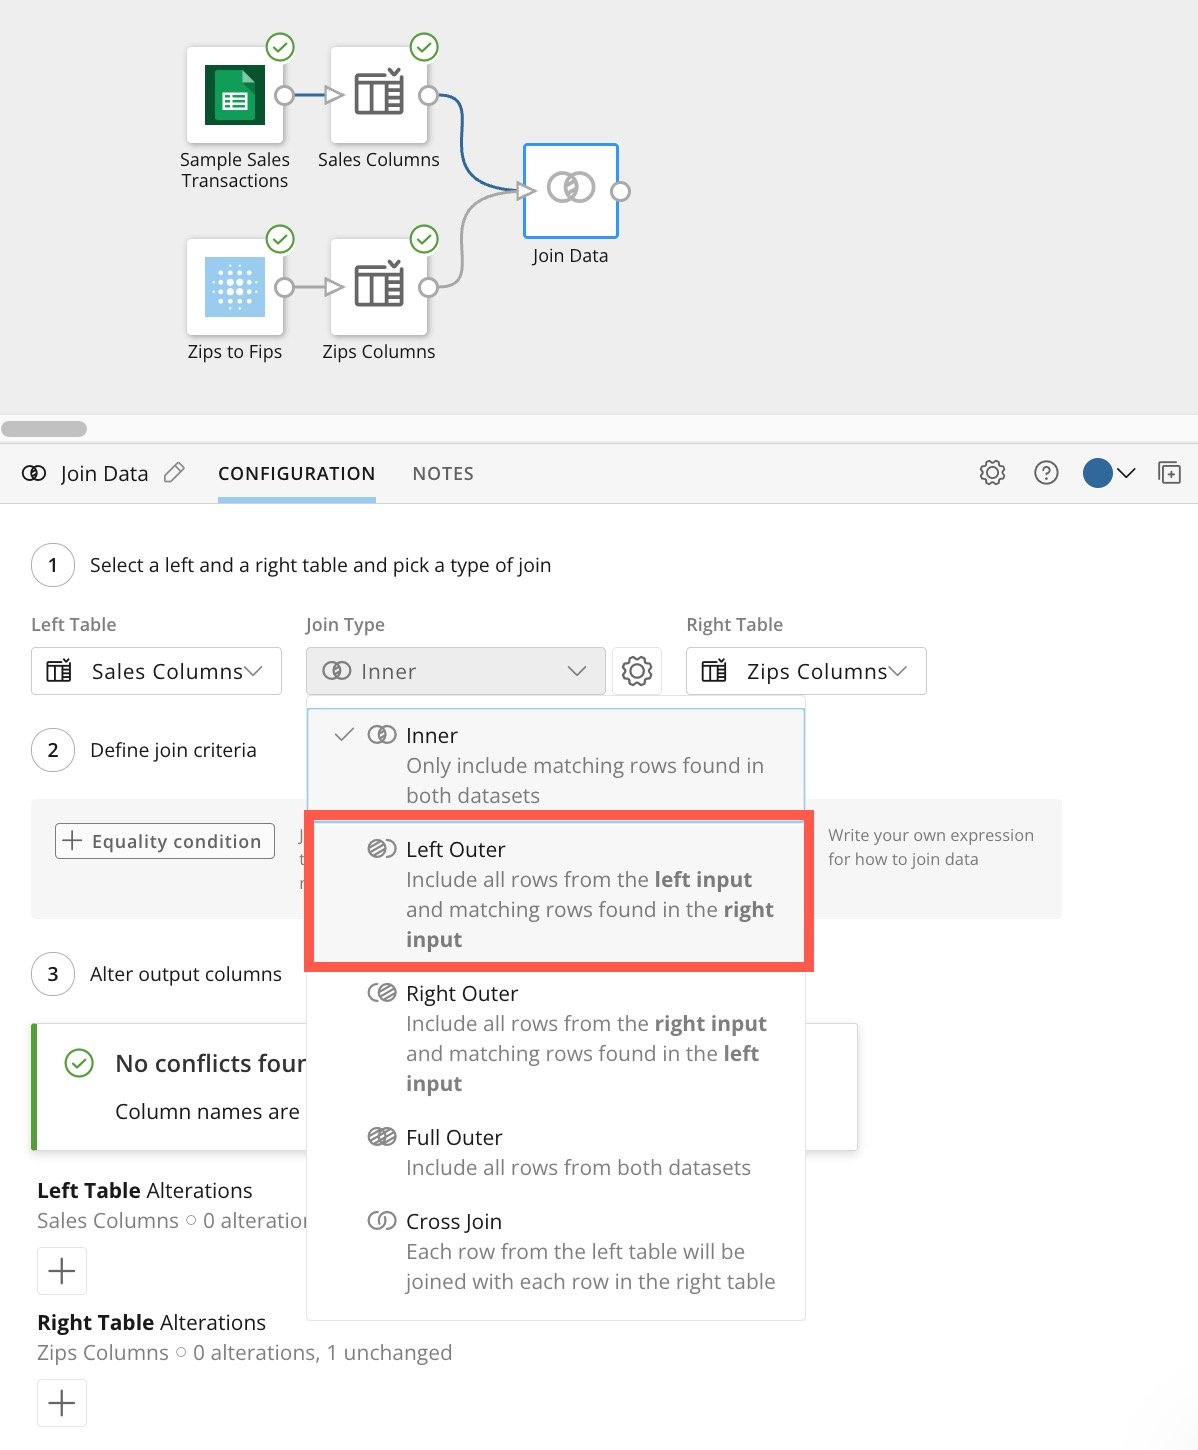 Now we will select our first Key. Keys are columns that we match across DataSets to bring data together.
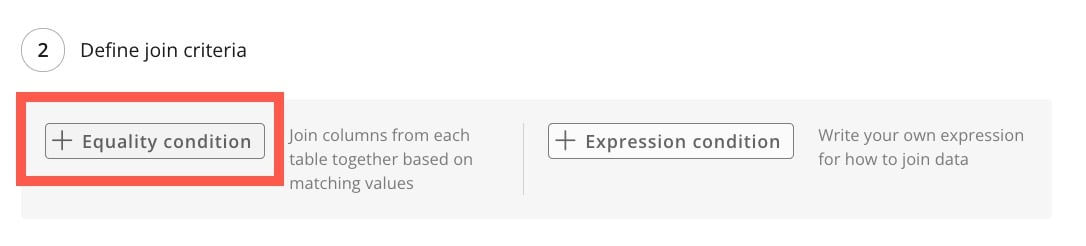
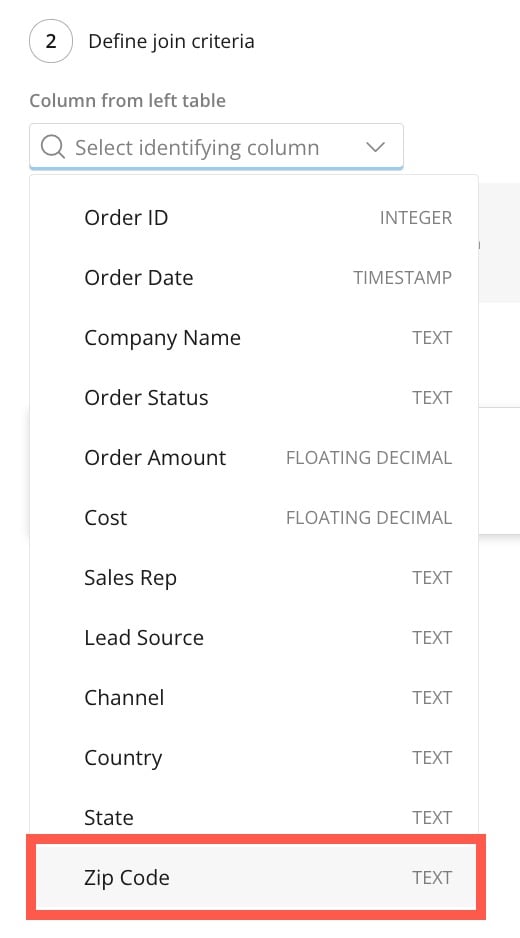
26\. Choose
**+ Equality condition** and choose the `Zip Code` column in the **Column from left table** dropdown.
Now we will select our first Key. Keys are columns that we match across DataSets to bring data together.
26\. Choose
**+ Equality condition** and choose the `Zip Code` column in the **Column from left table** dropdown.
 27. In the
**Column from right table** dropdown, choose the `ZIP\_STRING\_LEADING\_ZERO.`
28. Select
**Done** in the top right corner of the tile configuration area.
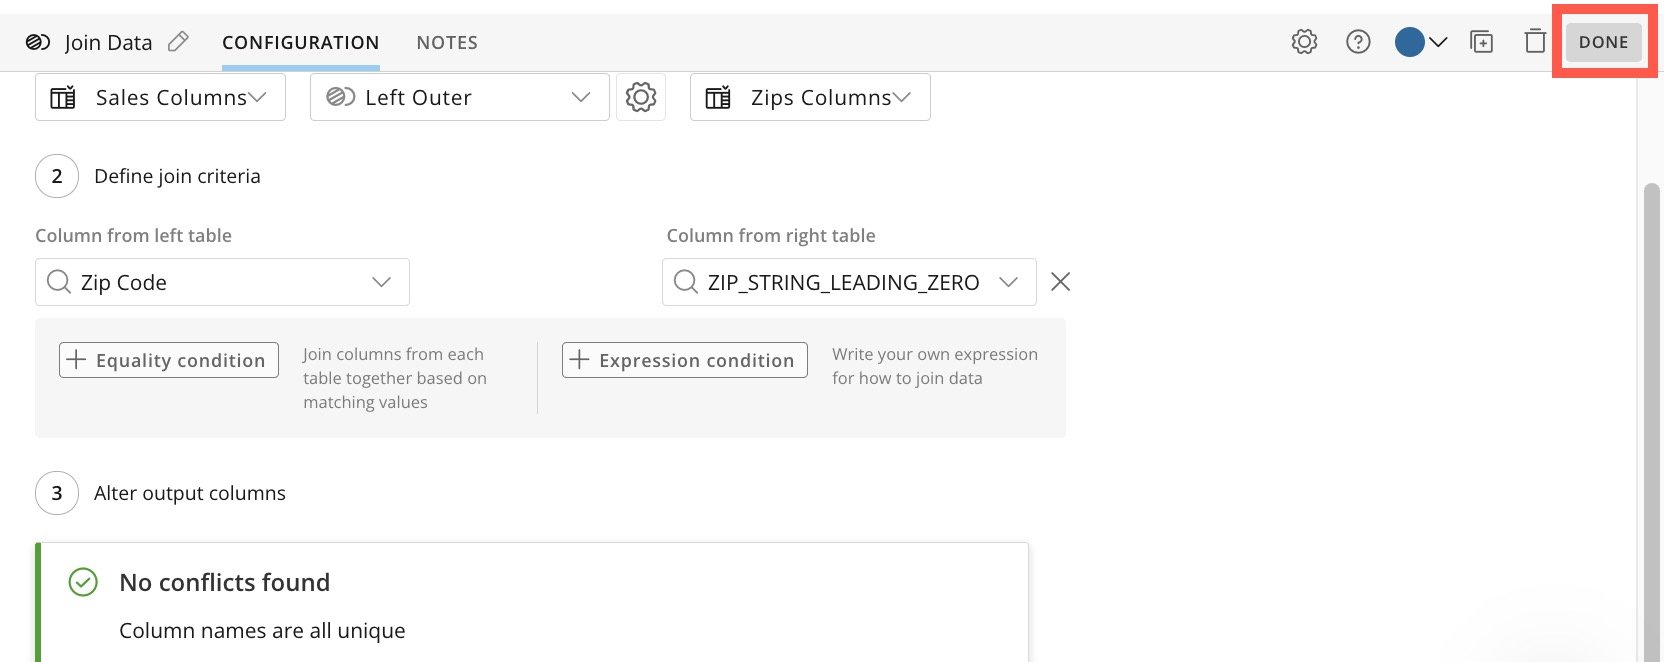
27. In the
**Column from right table** dropdown, choose the `ZIP\_STRING\_LEADING\_ZERO.`
28. Select
**Done** in the top right corner of the tile configuration area.
 **Build an Output**
29. From the left panel under
**DataSets** , select an Output DataSet tile and drag it to the canvas.
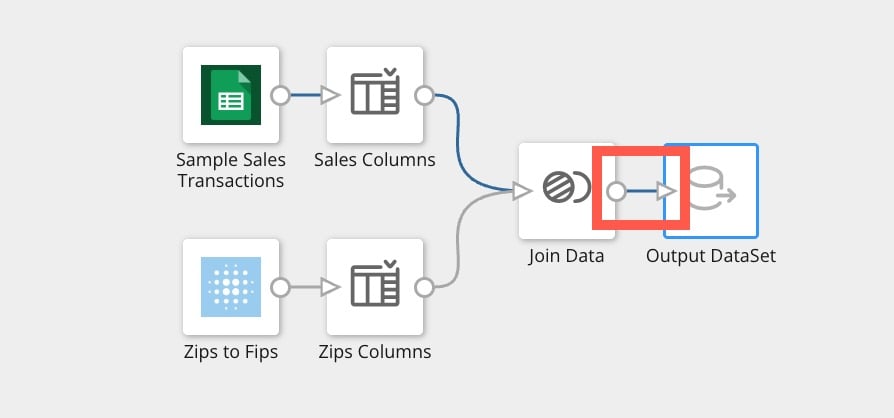
30. Connect the Join Data tile to the Output DataSet tile.
**Build an Output**
29. From the left panel under
**DataSets** , select an Output DataSet tile and drag it to the canvas.
30. Connect the Join Data tile to the Output DataSet tile.
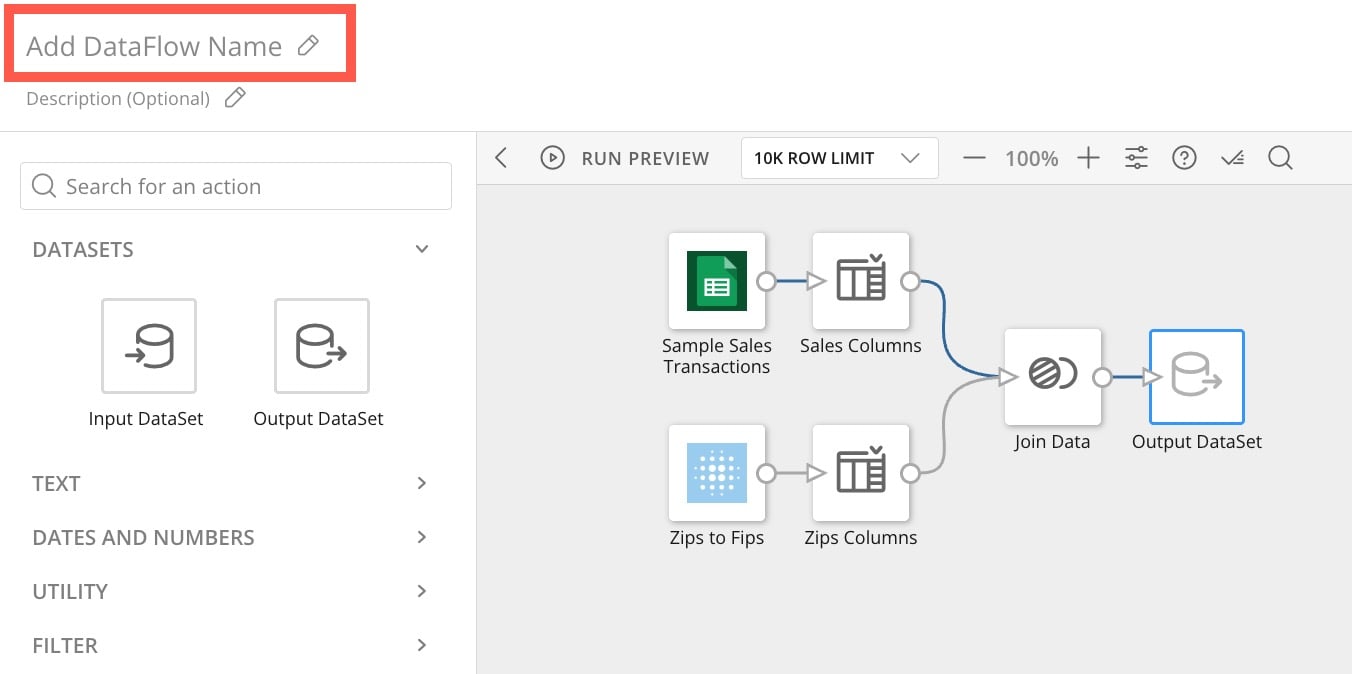
 31. Name your DataFlow at the top of the canvas by selecting the name field and entering a name. We recommend naming all your DataFlows and DataSets according to a convention that will help you catalog and manage what you create.
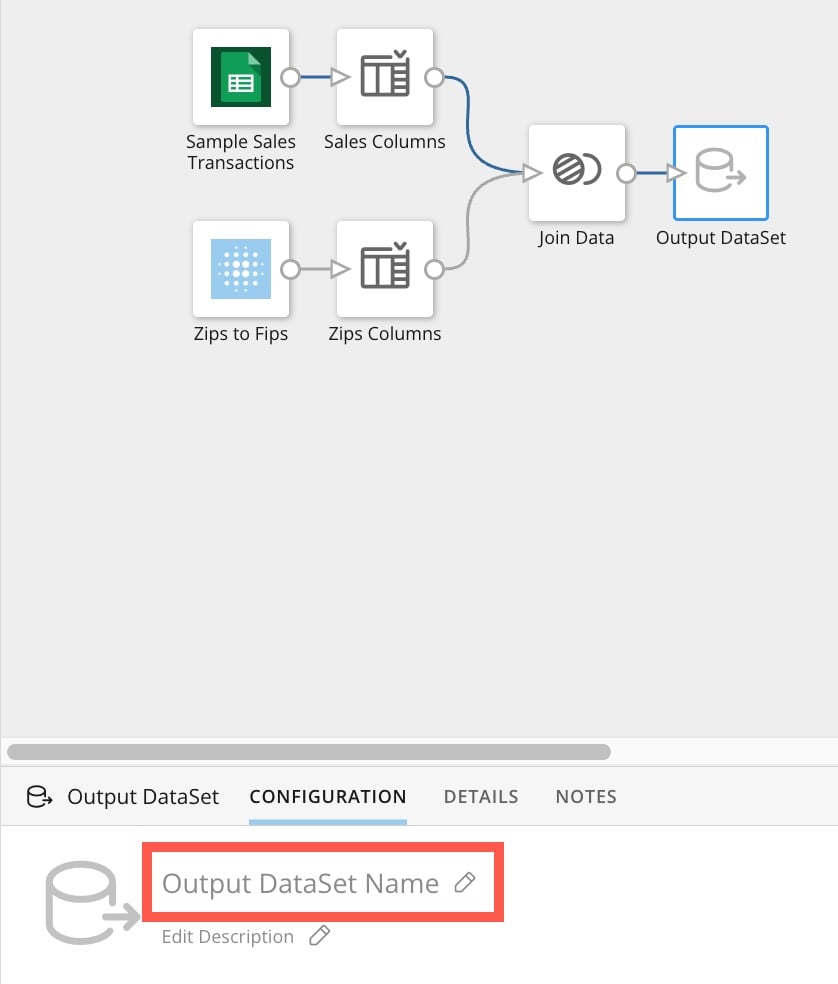
 32. Select the Output DataSet tile to open the configuration area and name your Output DataSet tile. We recommend naming the DataSet in a way that describes the data it contains.
 33. Select
**Done** in the tile configuration area.
33. Select
**Done** in the tile configuration area.
 You've completed the hardest part! Now it's time to schedule how often the DataFlow updates.
**Schedule Your DataFlow**
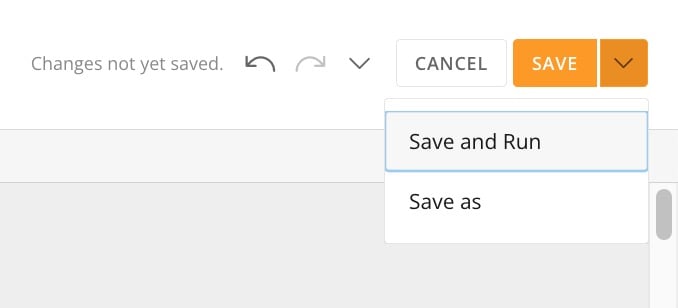
34. Select the dropdown beside
**Save** at the top of the canvas and choose **Save and Run**.
You've completed the hardest part! Now it's time to schedule how often the DataFlow updates.
**Schedule Your DataFlow**
34. Select the dropdown beside
**Save** at the top of the canvas and choose **Save and Run**.
 35. We recommend leaving notes in the version description field to give helpful context for the future.
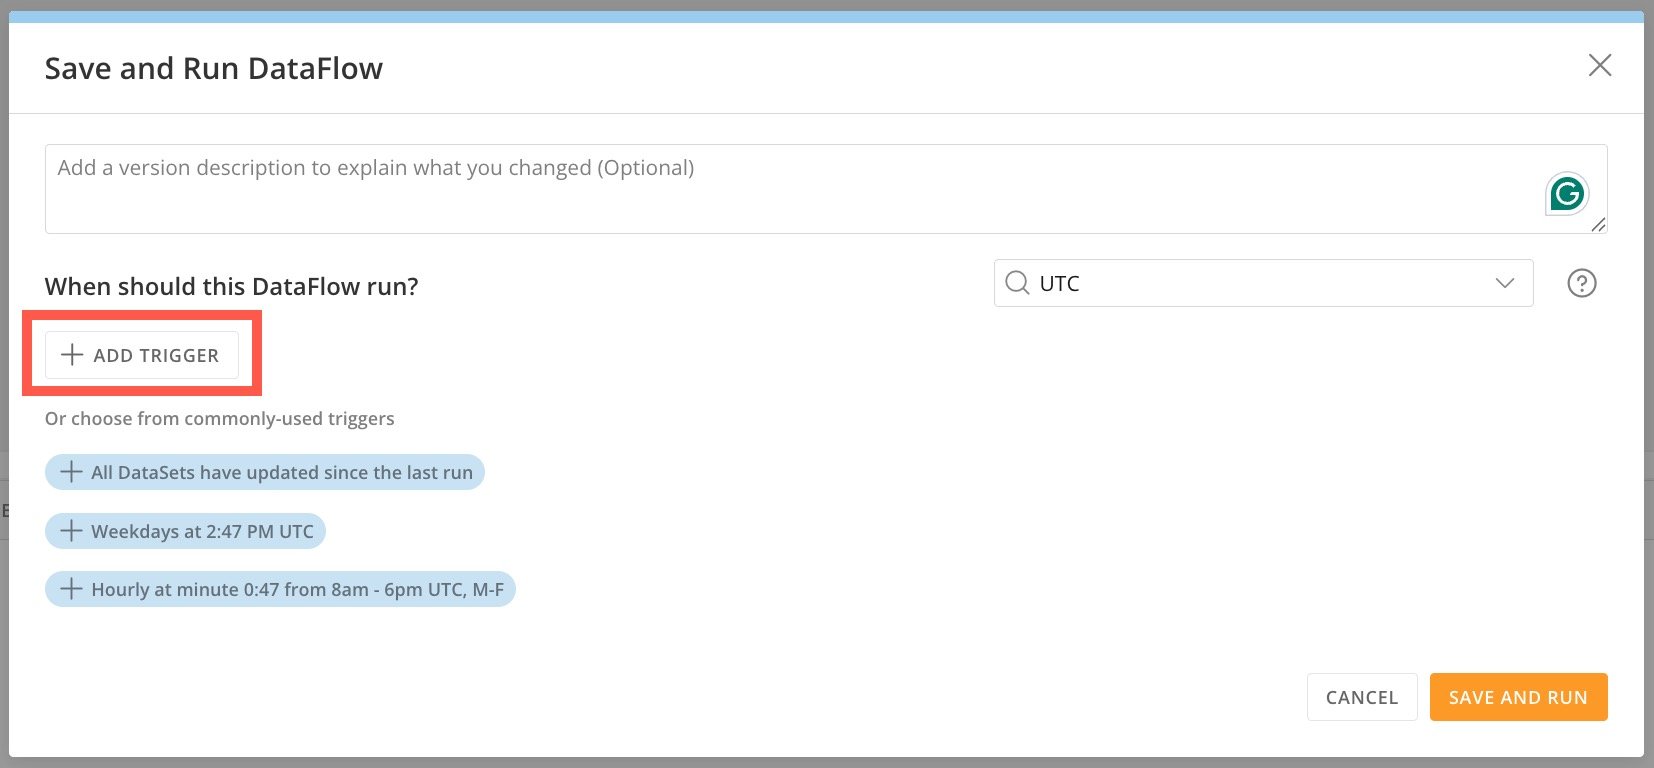
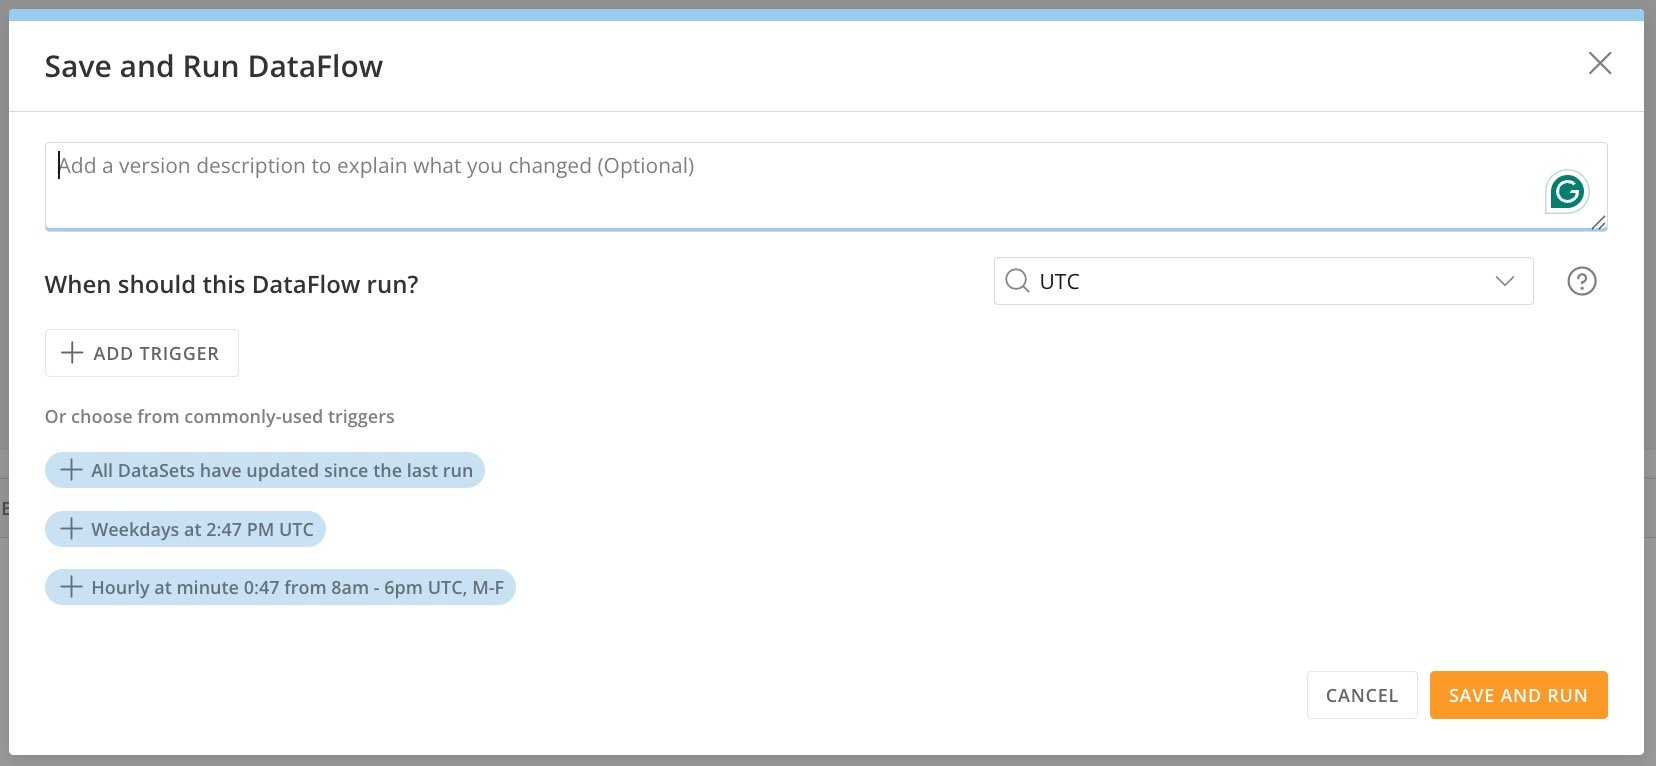 36. (Optional) To add a trigger that will execute your DataFlow, select
**Add Trigger**.
36. (Optional) To add a trigger that will execute your DataFlow, select
**Add Trigger**.
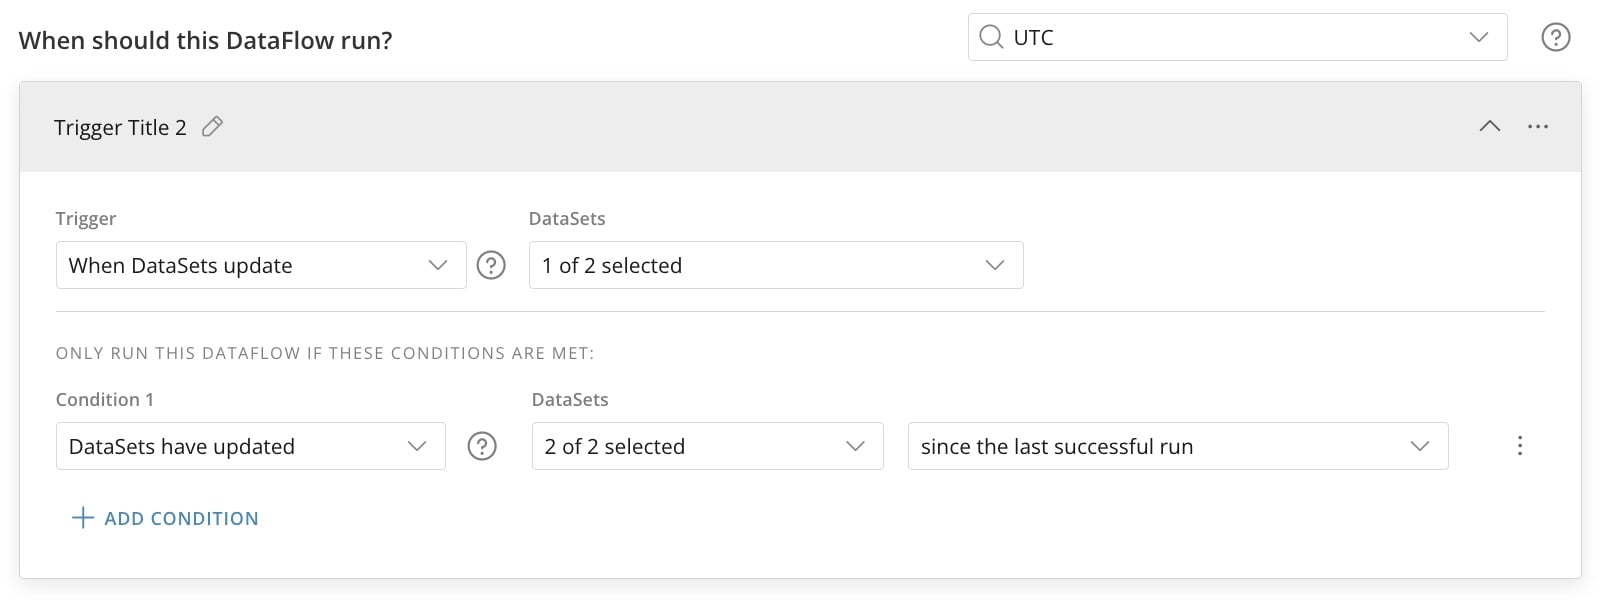
 37. Choose the trigger condition and select to which of the available DataSets the trigger should apply.
Repeat for as many triggers as you want to add.
37. Choose the trigger condition and select to which of the available DataSets the trigger should apply.
Repeat for as many triggers as you want to add.
 38. When finished, select
**Save and Run**. Wait while the DataFlow runs and opens in the **History** tab of the DataFlow details.
38. When finished, select
**Save and Run**. Wait while the DataFlow runs and opens in the **History** tab of the DataFlow details.
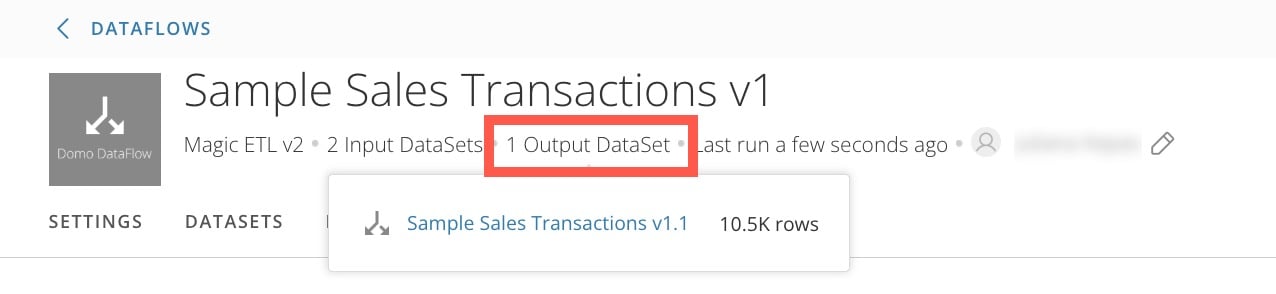
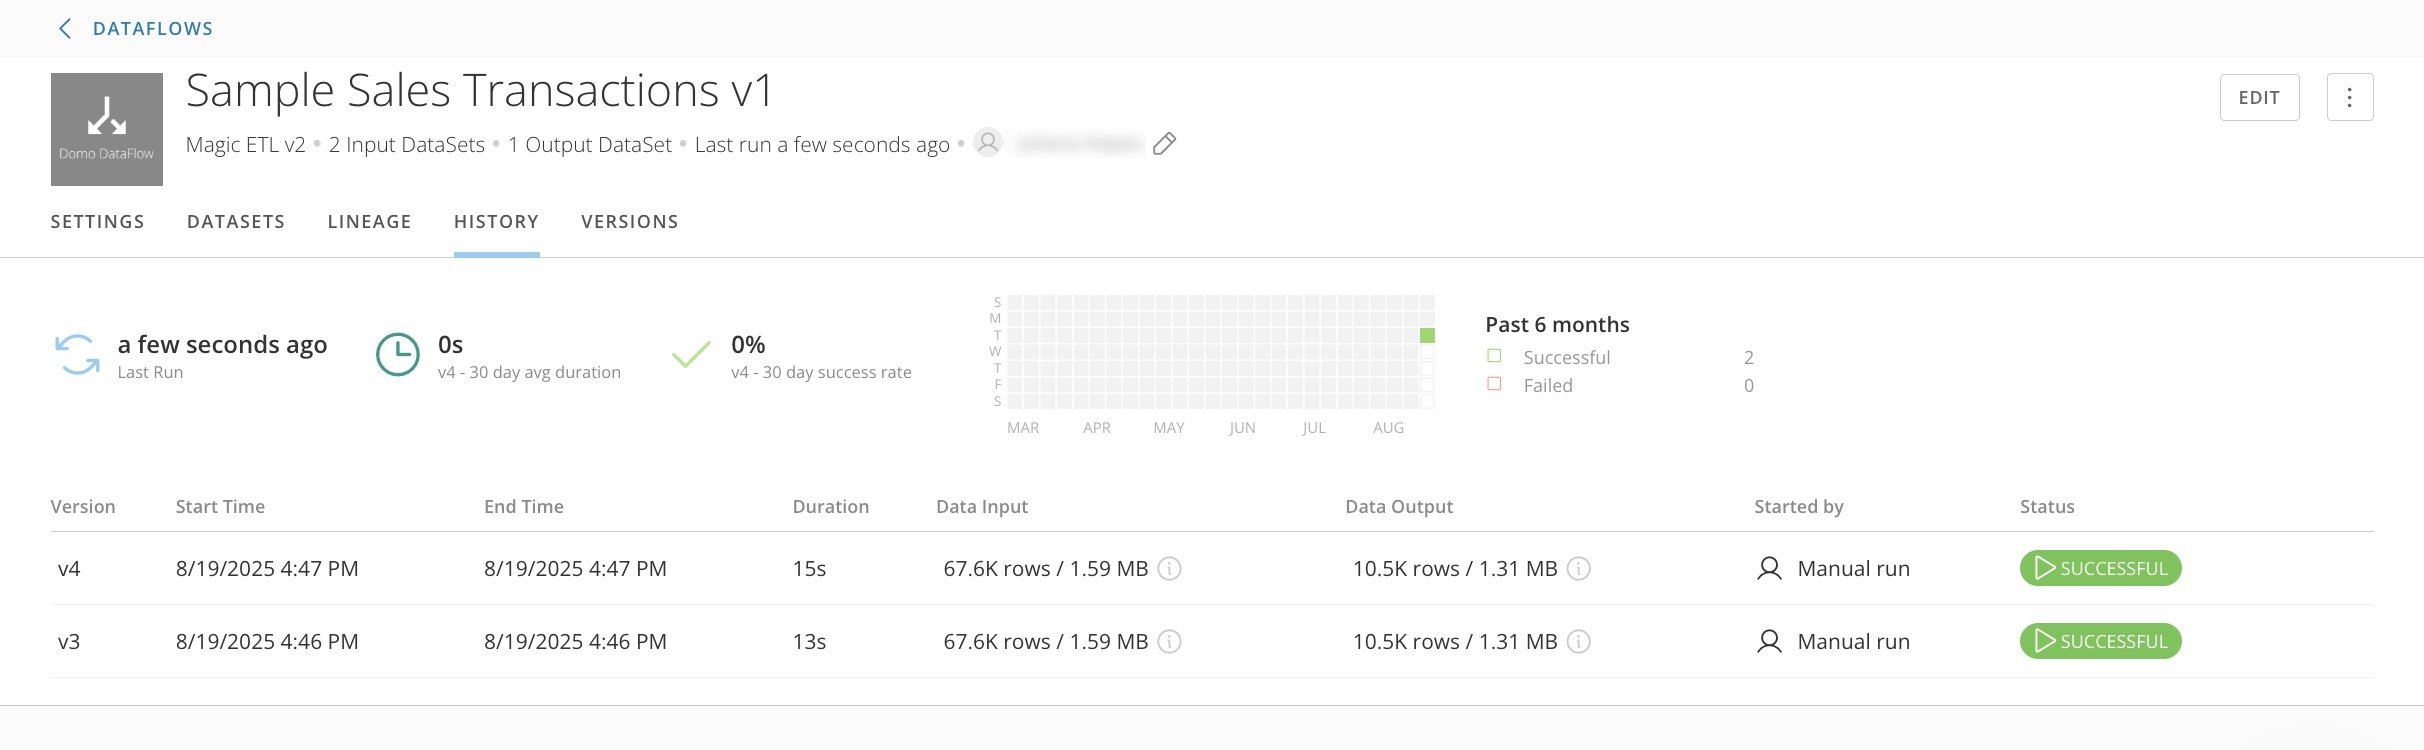 39. Hover over the
**1 Output DataSet** heading under the DataFlow name to see a link to the DataSet you created. You can use this DataSet to make the cards in the next section of this tutorial.
39. Hover over the
**1 Output DataSet** heading under the DataFlow name to see a link to the DataSet you created. You can use this DataSet to make the cards in the next section of this tutorial.
 You have successfully connected your sales data with geographical details, unlocking new insights for location-based analysis. To best use Domo's powerful transformation tools, it's important to understand and carefully prepare your data.
### Build Cards and a Dashboard
Creating insightful and interactive Domo dashboards can be a crucial part of your data strategy. This guide provides step-by-step instructions on how to build cards and a dashboard using our sample data. We'll also cover adding a link card and implementing a page filter to get more from your dashboard.
There are different ways to access Analyzer, where cards are made. In this tutorial, we'll access it by first building a dashboard.
**Create a Dashboard**
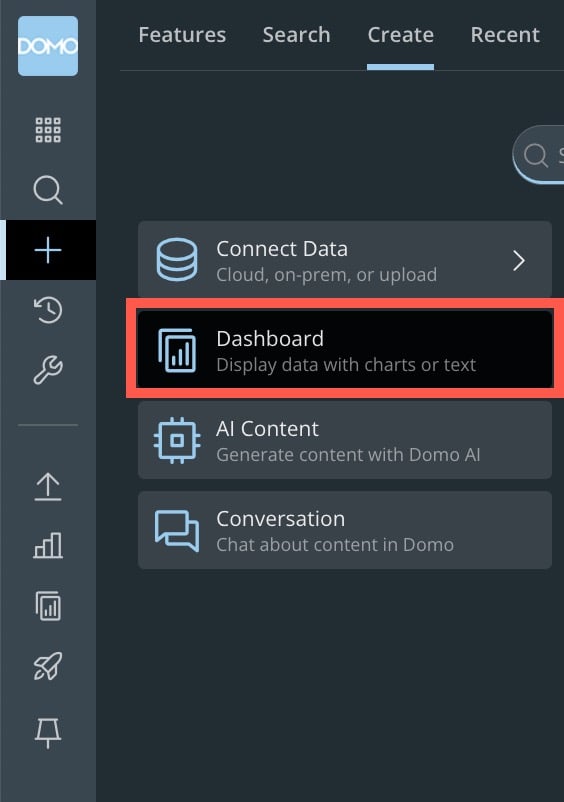
1. In the left navigation, select
**Add** (plus icon) > **Dashboard**.
You have successfully connected your sales data with geographical details, unlocking new insights for location-based analysis. To best use Domo's powerful transformation tools, it's important to understand and carefully prepare your data.
### Build Cards and a Dashboard
Creating insightful and interactive Domo dashboards can be a crucial part of your data strategy. This guide provides step-by-step instructions on how to build cards and a dashboard using our sample data. We'll also cover adding a link card and implementing a page filter to get more from your dashboard.
There are different ways to access Analyzer, where cards are made. In this tutorial, we'll access it by first building a dashboard.
**Create a Dashboard**
1. In the left navigation, select
**Add** (plus icon) > **Dashboard**.
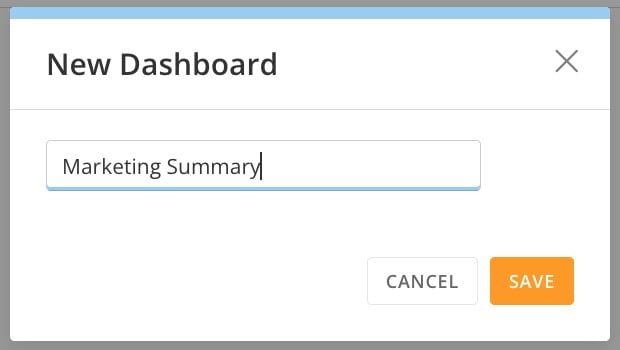
 2. Give your dashboard a name. Choose a name that relates to the department, business area, or subject matter. Then select
**Save**.
2. Give your dashboard a name. Choose a name that relates to the department, business area, or subject matter. Then select
**Save**.
 **Note:**
After saving your new dashboard, you can find it by going to
**Features** > **Dashboards**
in the left navigation.
**Create Cards**
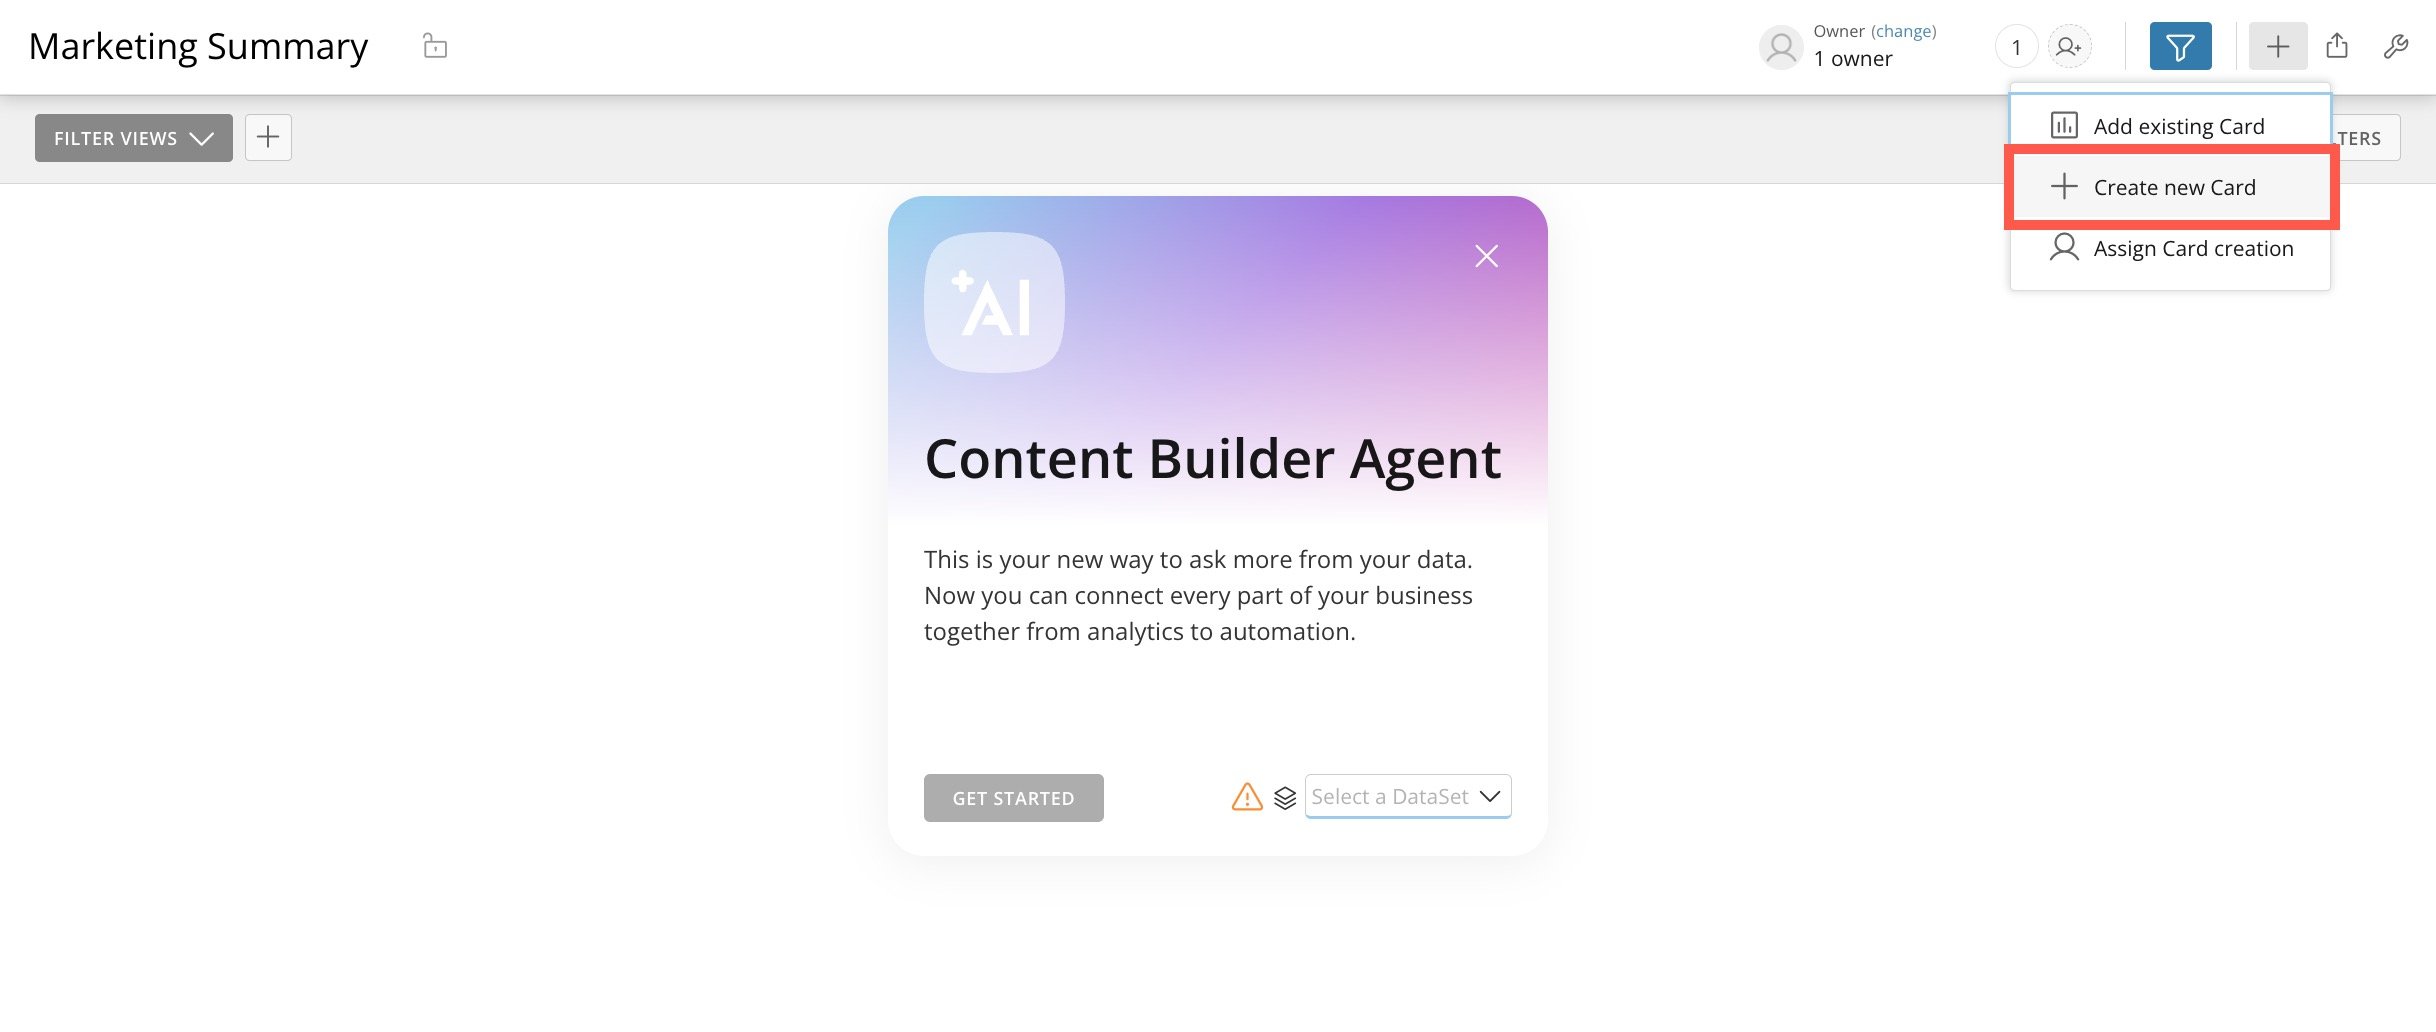
3. Go to your new dashboard and select
**Add** (plus icon) > **Create new Card**.
**Note:**
After saving your new dashboard, you can find it by going to
**Features** > **Dashboards**
in the left navigation.
**Create Cards**
3. Go to your new dashboard and select
**Add** (plus icon) > **Create new Card**.
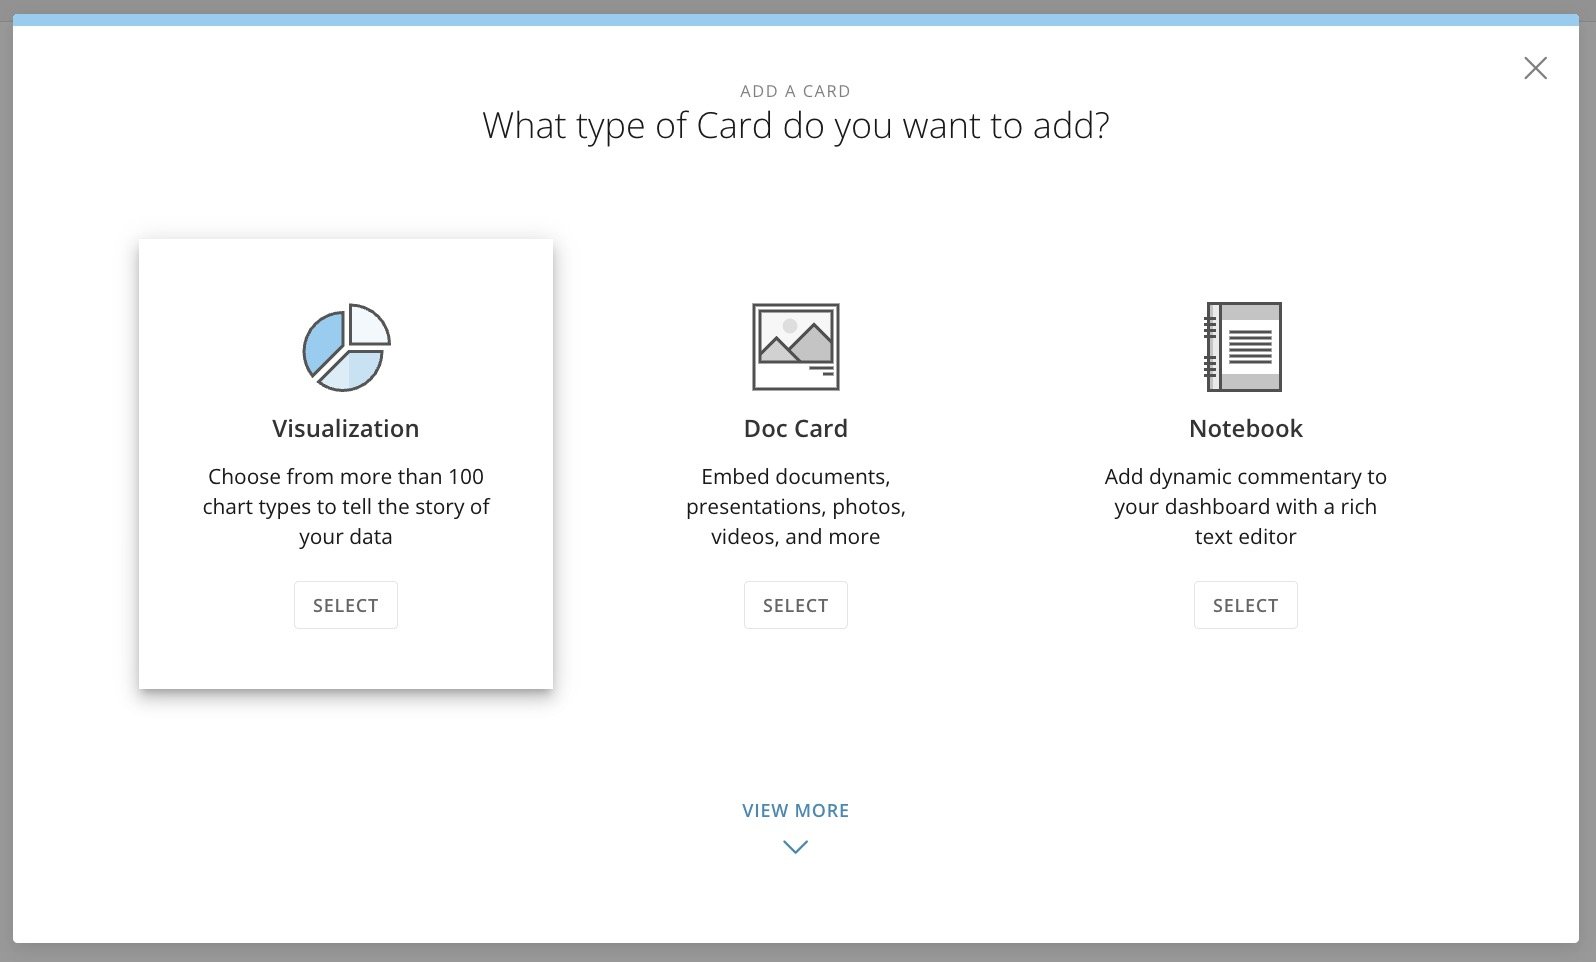
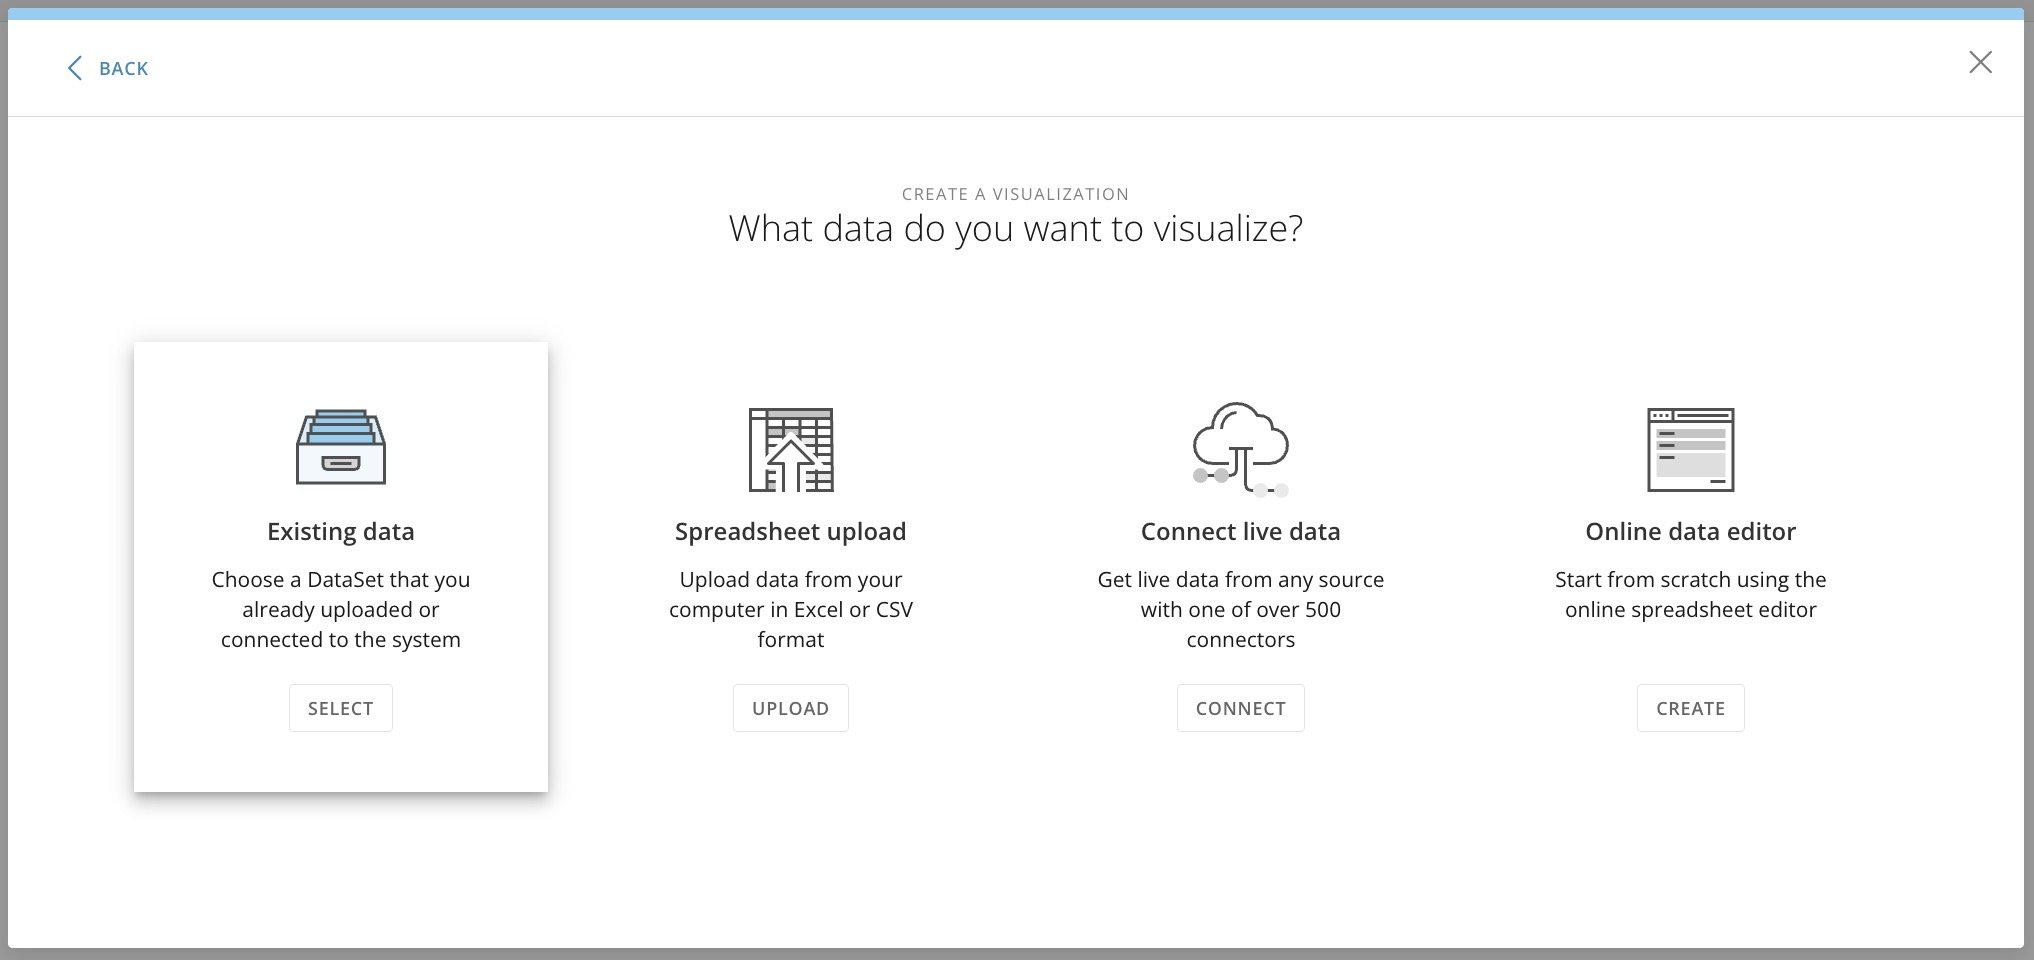
 4. In the card type modal, select
**Visualization** , then **Existing data**.
4. In the card type modal, select
**Visualization** , then **Existing data**.
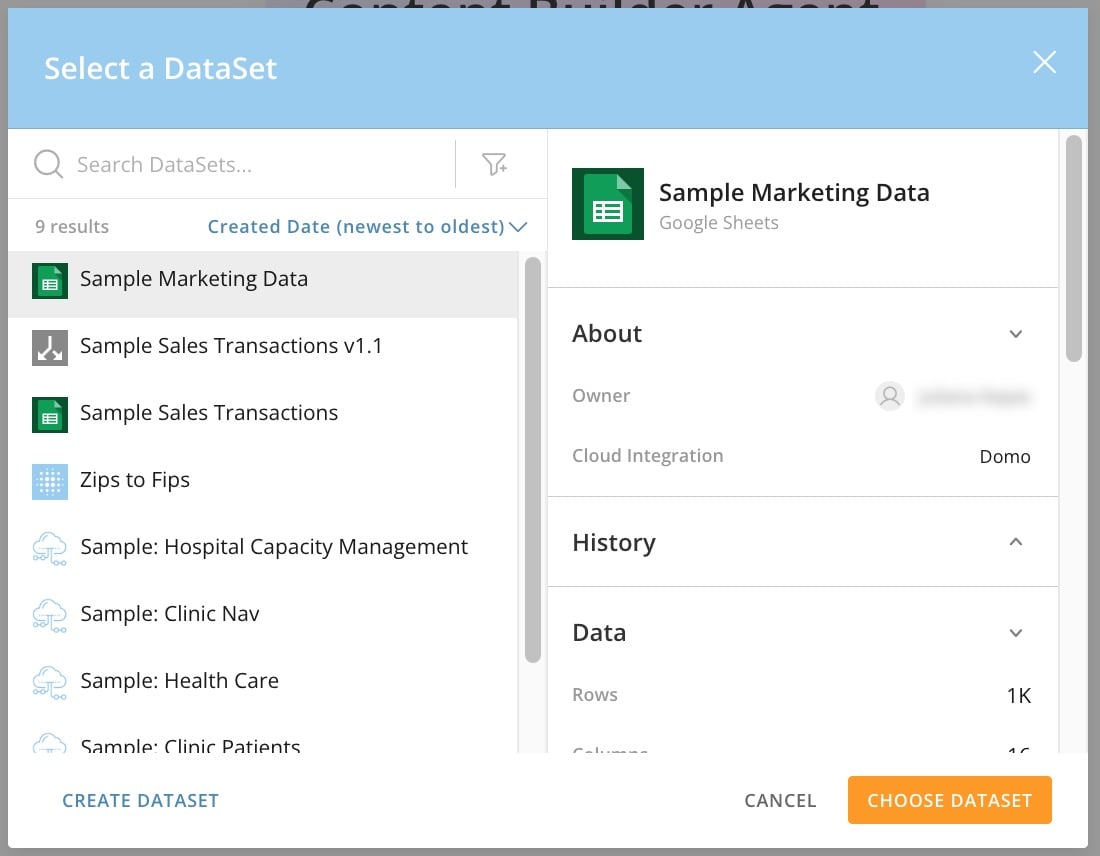
 5. Choose the marketing DataSet you created
[above](#connect_to_google_sheets) .
5. Choose the marketing DataSet you created
[above](#connect_to_google_sheets) .
 Your DataSet opens in Analyzer. Watch or close the tour pop-up that displays.
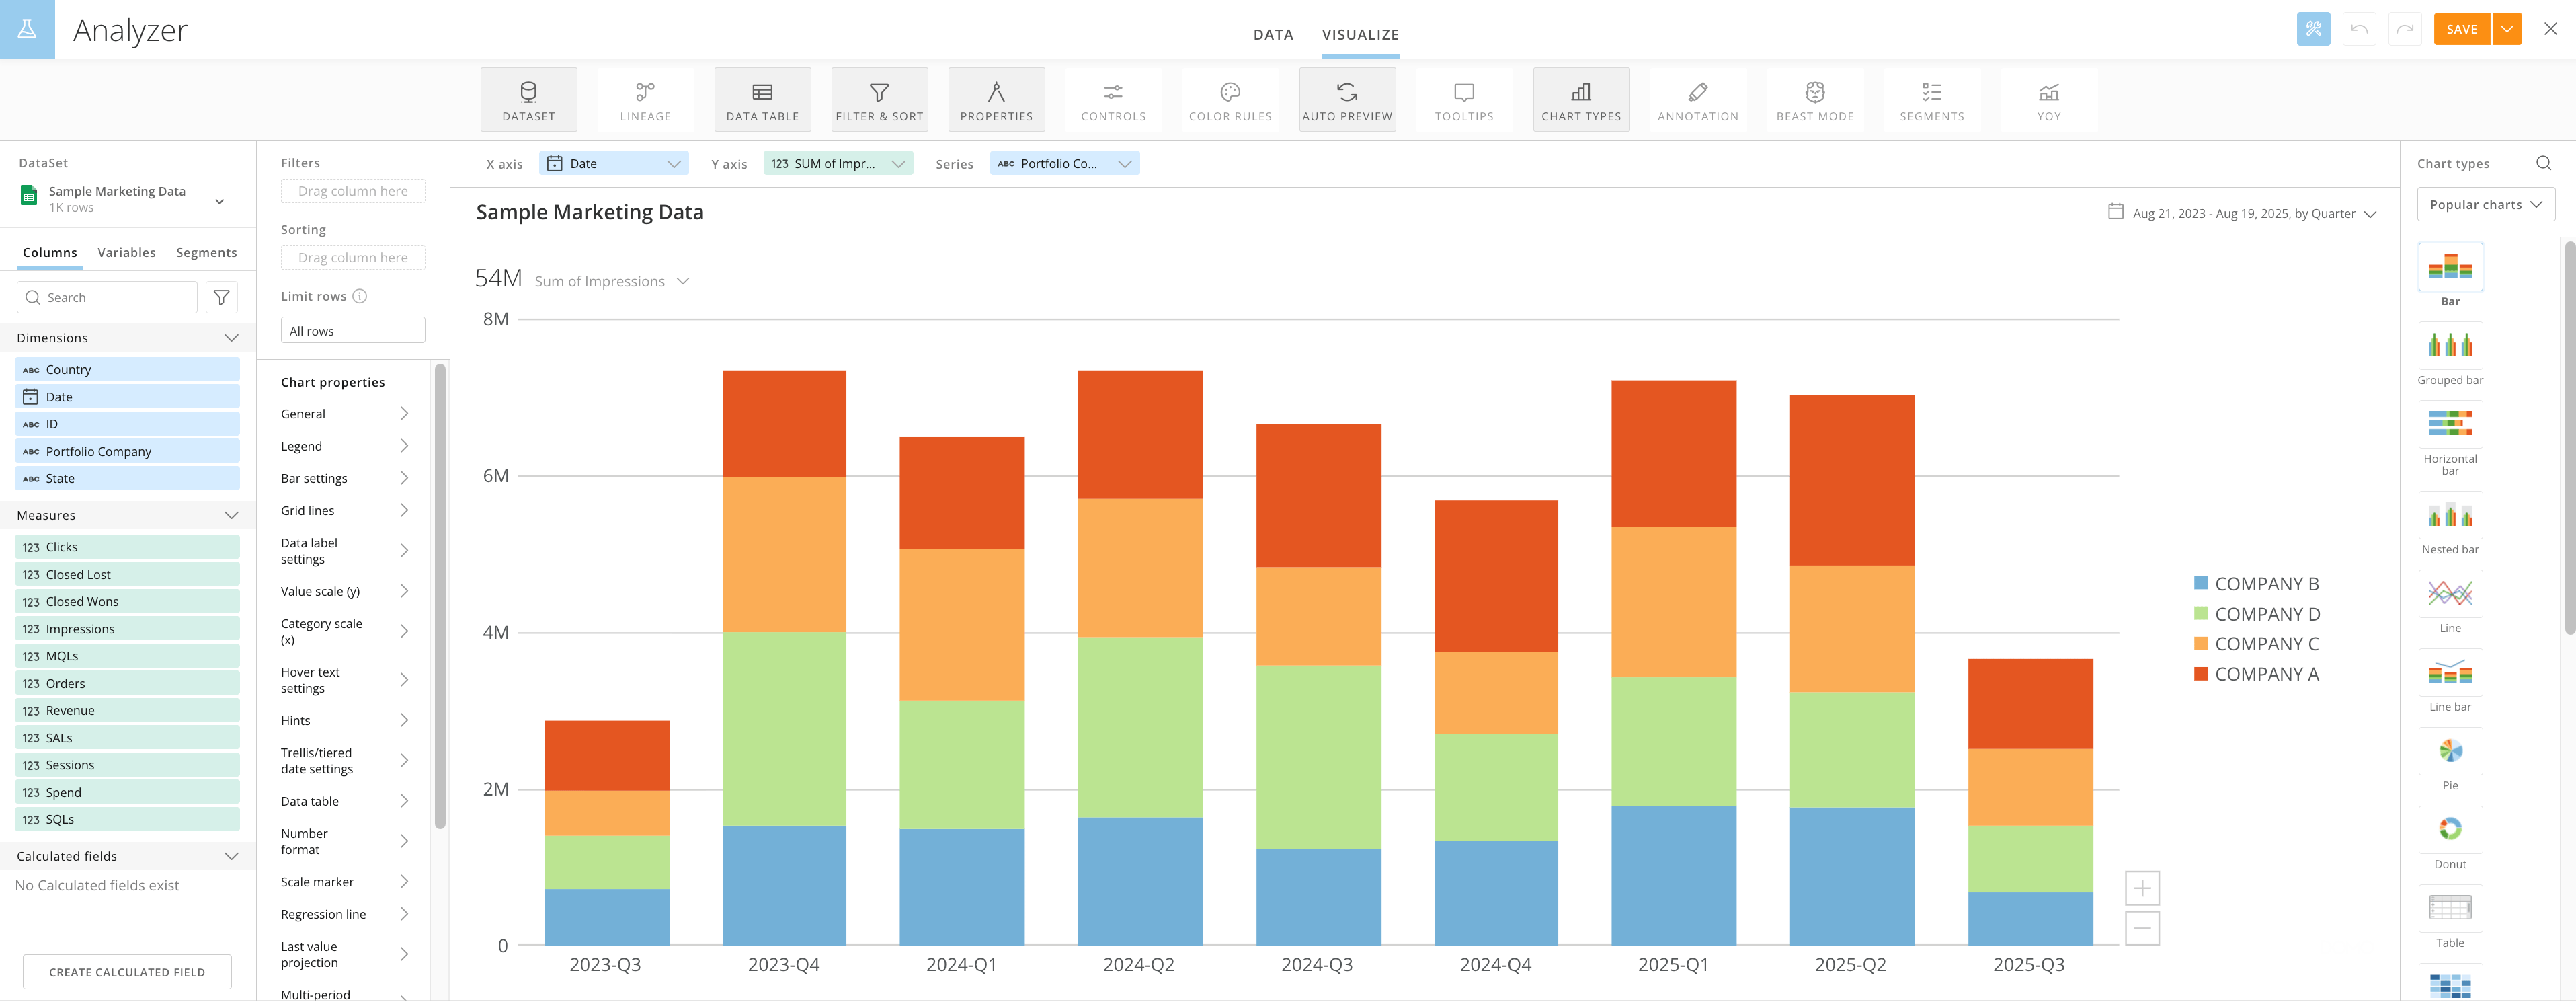 6. In the
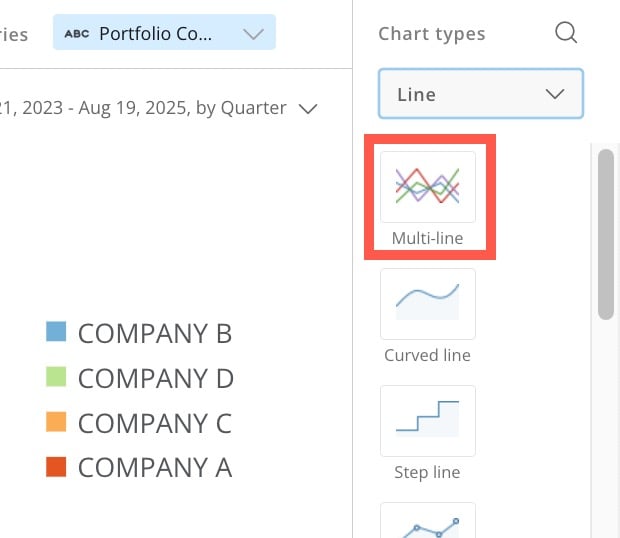
**Chart types** panel on the right side of the screen, use the dropdown to go to **Line** > **Multi-line**.
6. In the
**Chart types** panel on the right side of the screen, use the dropdown to go to **Line** > **Multi-line**.
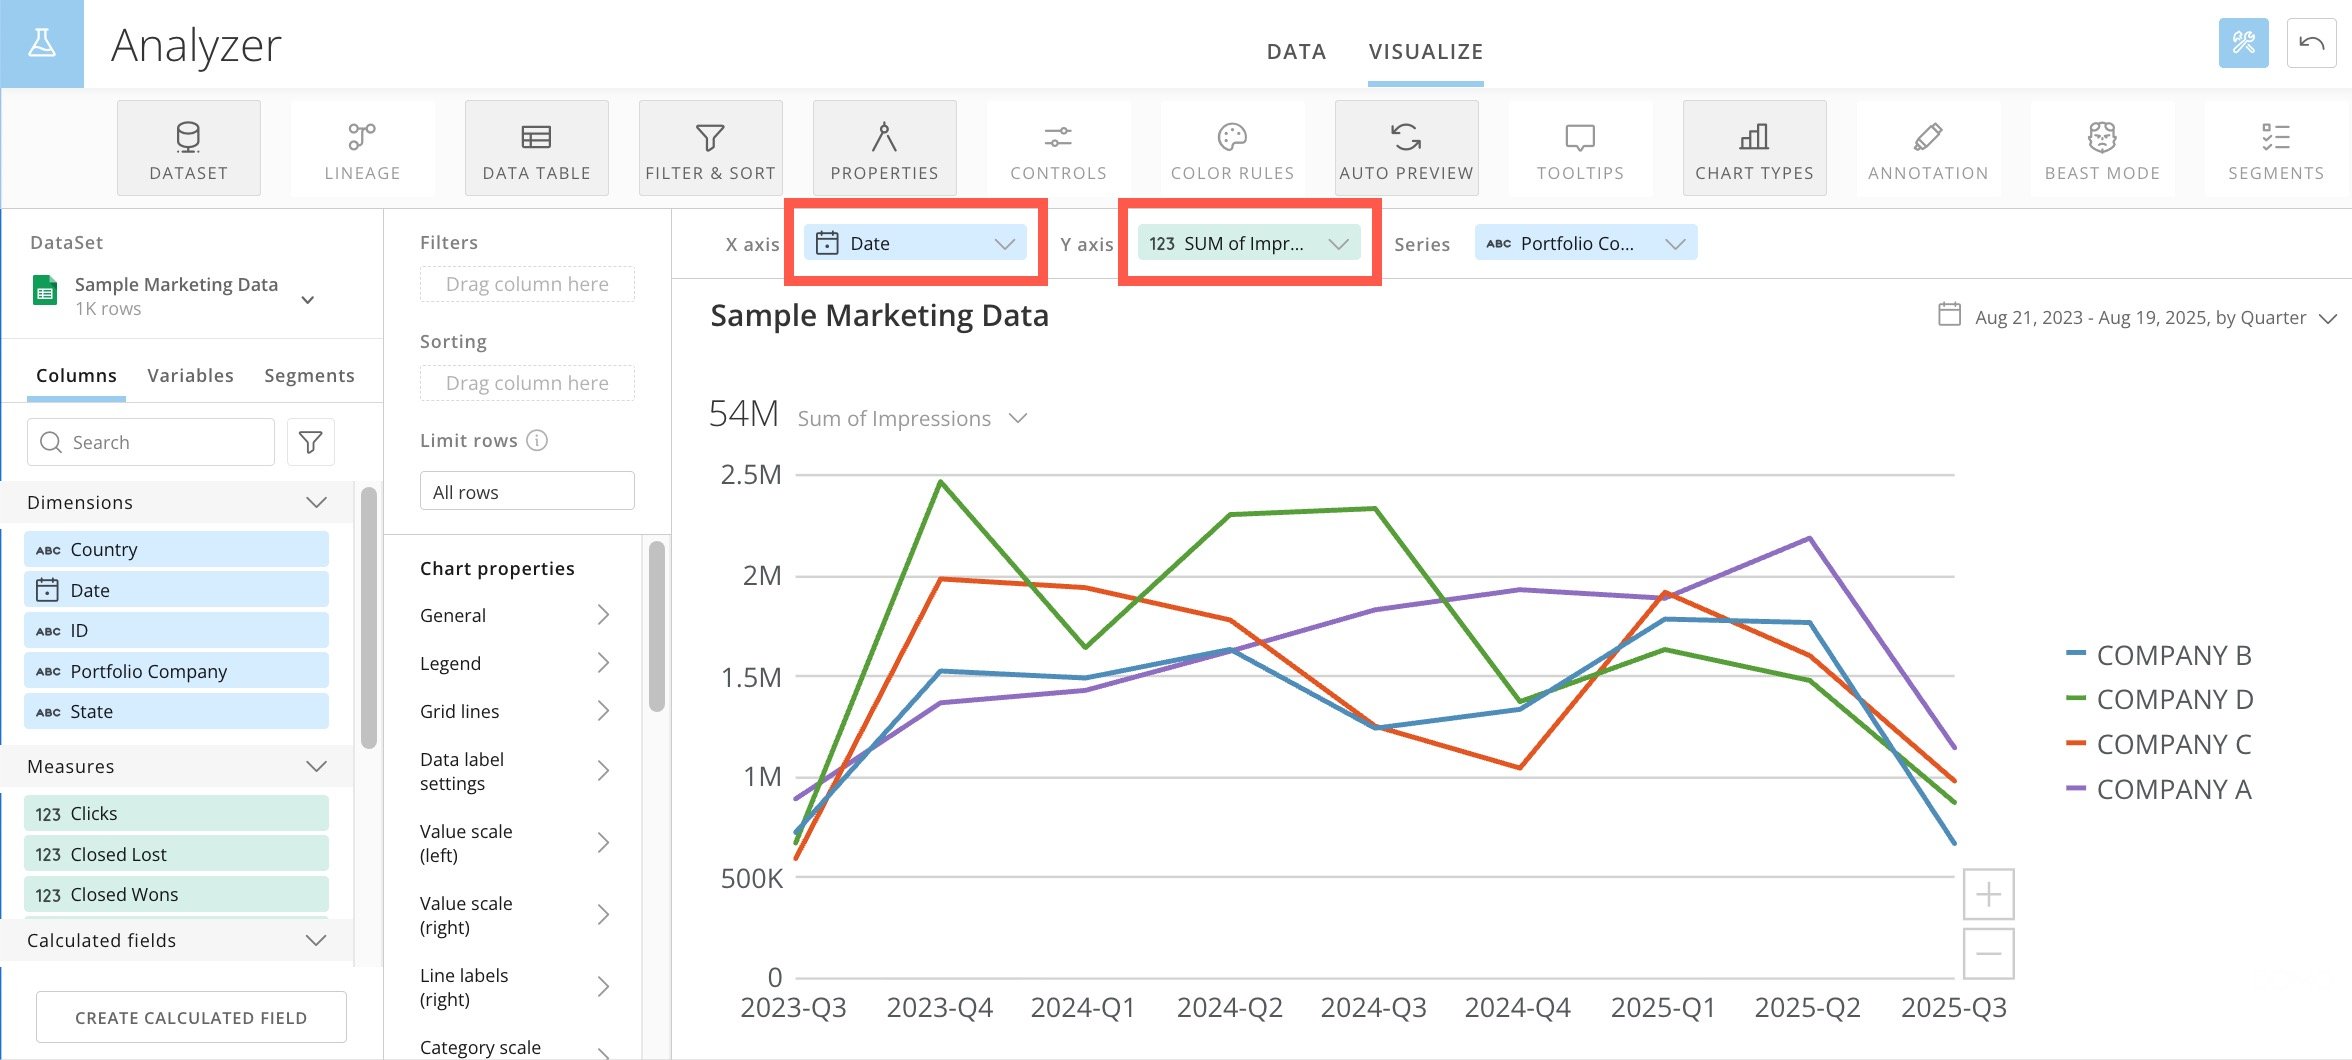
 When creating a card, Domo fills in the chart with suggested columns from your data. In this example, the `Date` and `Impression` columns are used.
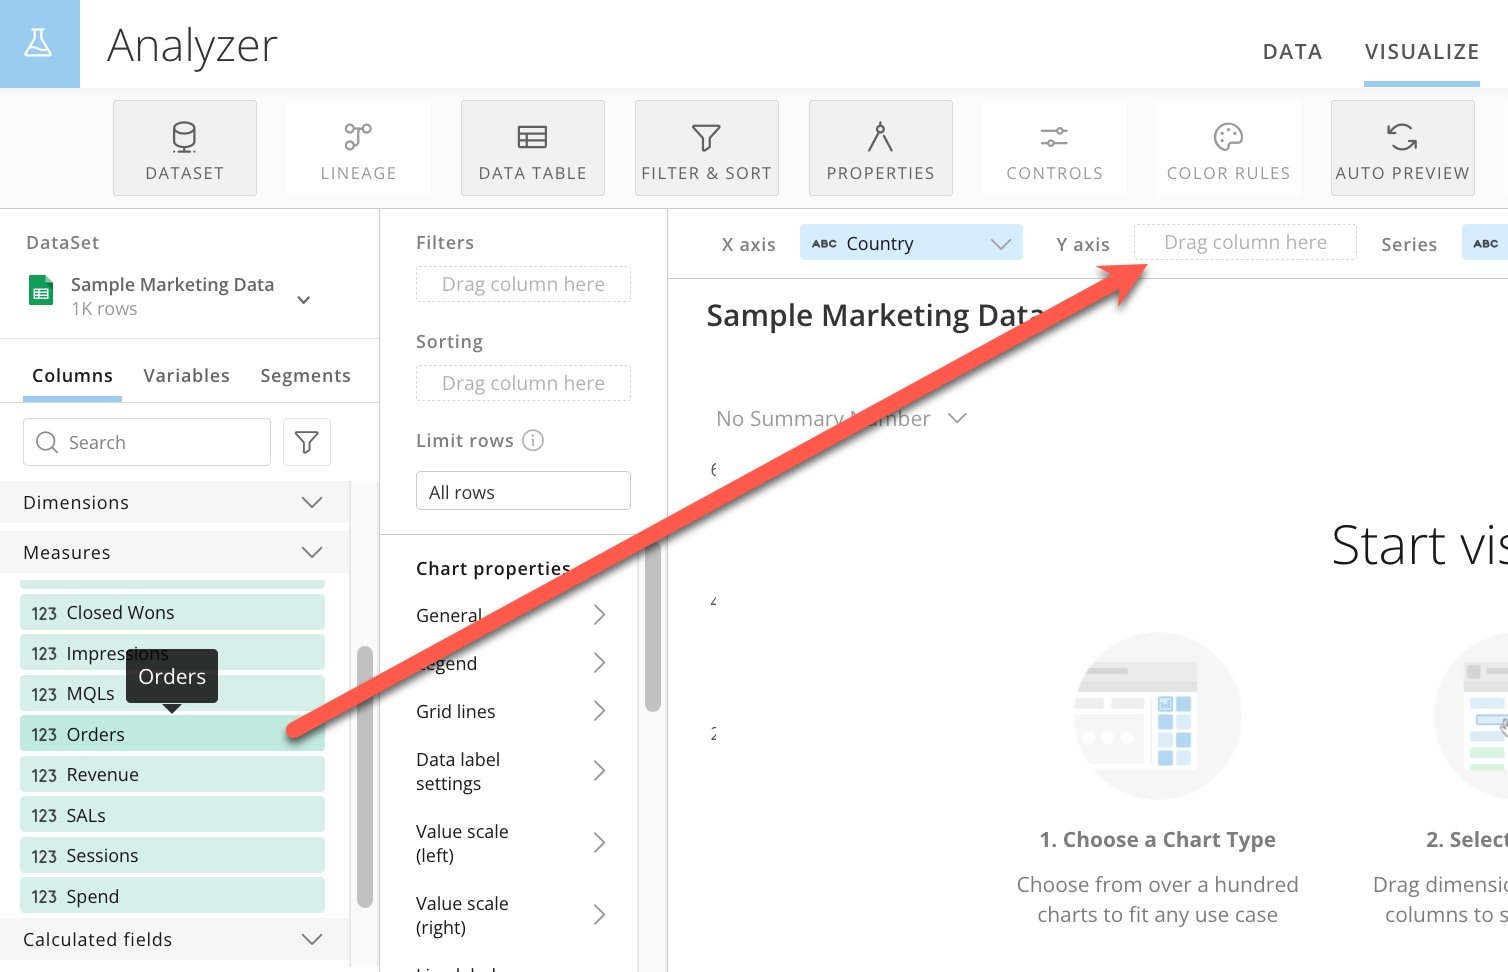
 To use different columns, you'll need to drag them from the **Columns** tab on the left side of the screen to the appropriate areas above the chart.
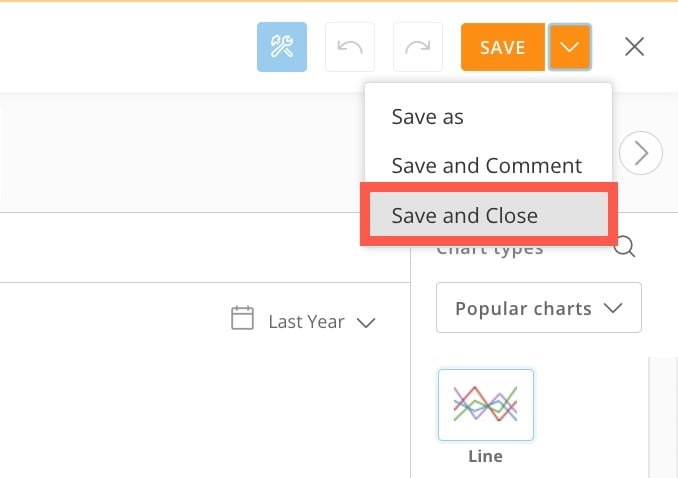
 7. When finished creating the card, we select the dropdown next to
**Save** and choose **Save and Close**.
Your dashboard displays, with your card in the dashboard's **Appendix**.
7. When finished creating the card, we select the dropdown next to
**Save** and choose **Save and Close**.
Your dashboard displays, with your card in the dashboard's **Appendix**.
 * Upon completion, select the wrench, edit your dashboard, and drag your new card from the Appendix into position. Then, hit save.
**Create a Spend vs Revenue Card (Easy)**
8. In the
**Chart types** panel on the right side of the screen, use the dropdown to go to **Vertical b**
**ar** > **Grouped bar**.
* Upon completion, select the wrench, edit your dashboard, and drag your new card from the Appendix into position. Then, hit save.
**Create a Spend vs Revenue Card (Easy)**
8. In the
**Chart types** panel on the right side of the screen, use the dropdown to go to **Vertical b**
**ar** > **Grouped bar**.
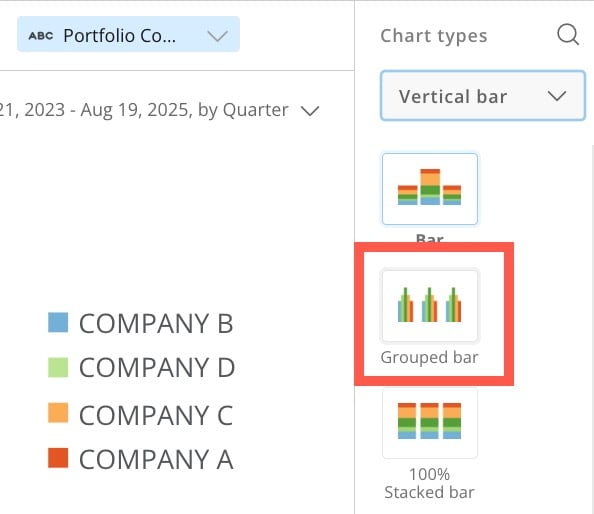 9. From the
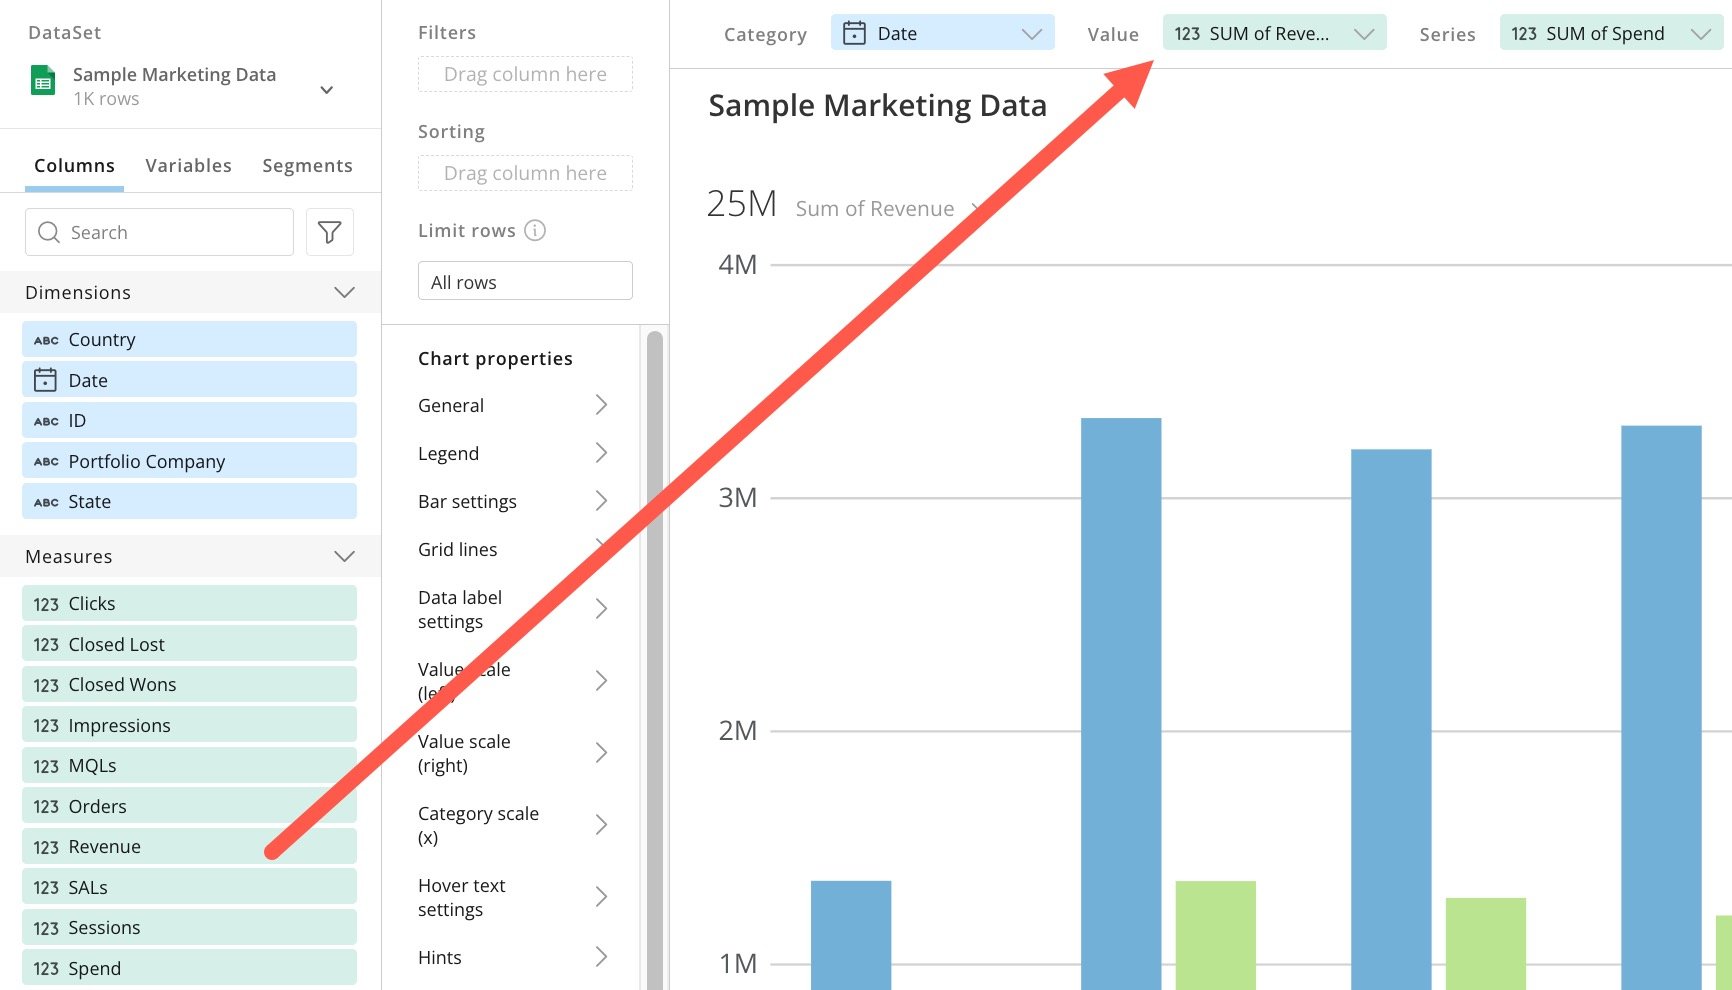
**Columns** tab on the left side of the screen, drag `Revenue` to the **Value** area above the chart and `Spend` to the **Series** area above the chart.
By default, the `Date` column is already placed in the **Category** area above the chart, and both the `Revenue` and `Spend` columns are aggregated as a sum.
9. From the
**Columns** tab on the left side of the screen, drag `Revenue` to the **Value** area above the chart and `Spend` to the **Series** area above the chart.
By default, the `Date` column is already placed in the **Category** area above the chart, and both the `Revenue` and `Spend` columns are aggregated as a sum.
 10. Select
**Save and Close**.
**Map (Medium)**
Now we'll make a map card using our Samples Sales Transaction DataSet, the output of our Magic ETL DataFlow.
11. Begin by adding a card to your dashboard, as described
above
. When you choose an existing DataSet, choose `Sample Sales Transactions v1.1` and select **Choose DataSet** to open the data in Analyzer.
10. Select
**Save and Close**.
**Map (Medium)**
Now we'll make a map card using our Samples Sales Transaction DataSet, the output of our Magic ETL DataFlow.
11. Begin by adding a card to your dashboard, as described
above
. When you choose an existing DataSet, choose `Sample Sales Transactions v1.1` and select **Choose DataSet** to open the data in Analyzer.
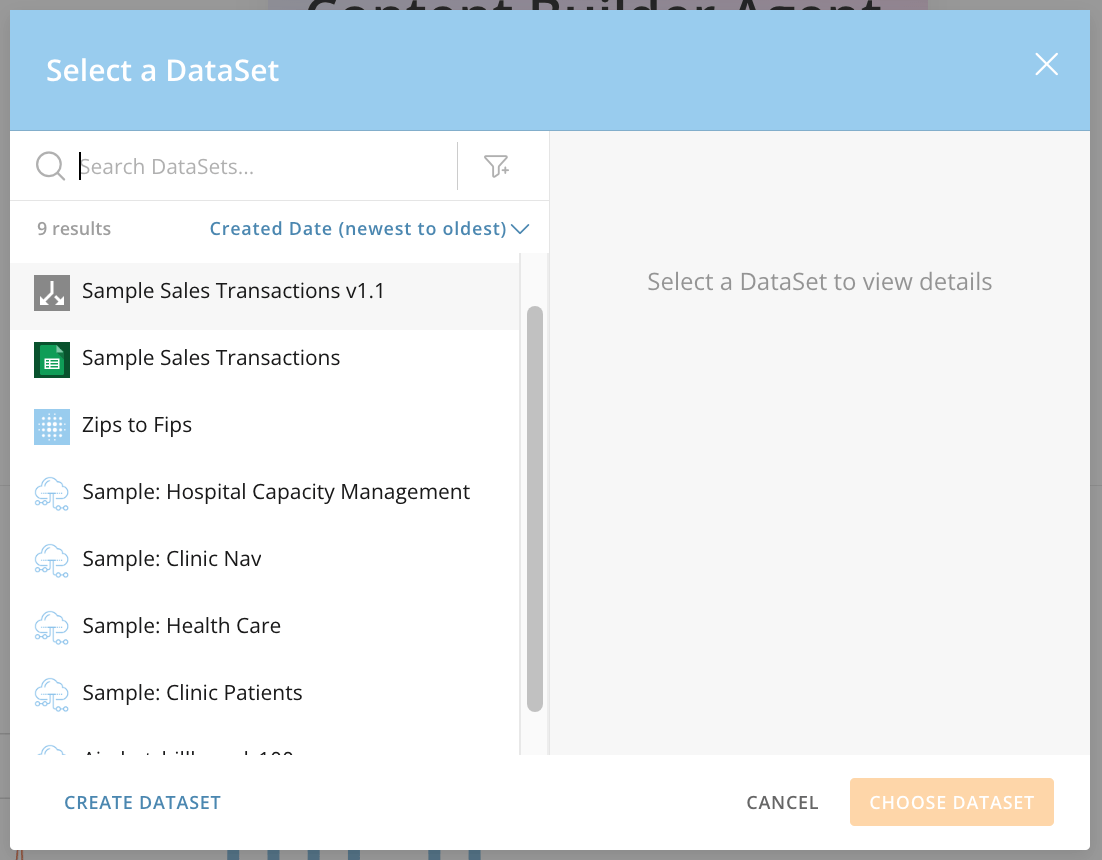 12. Use the
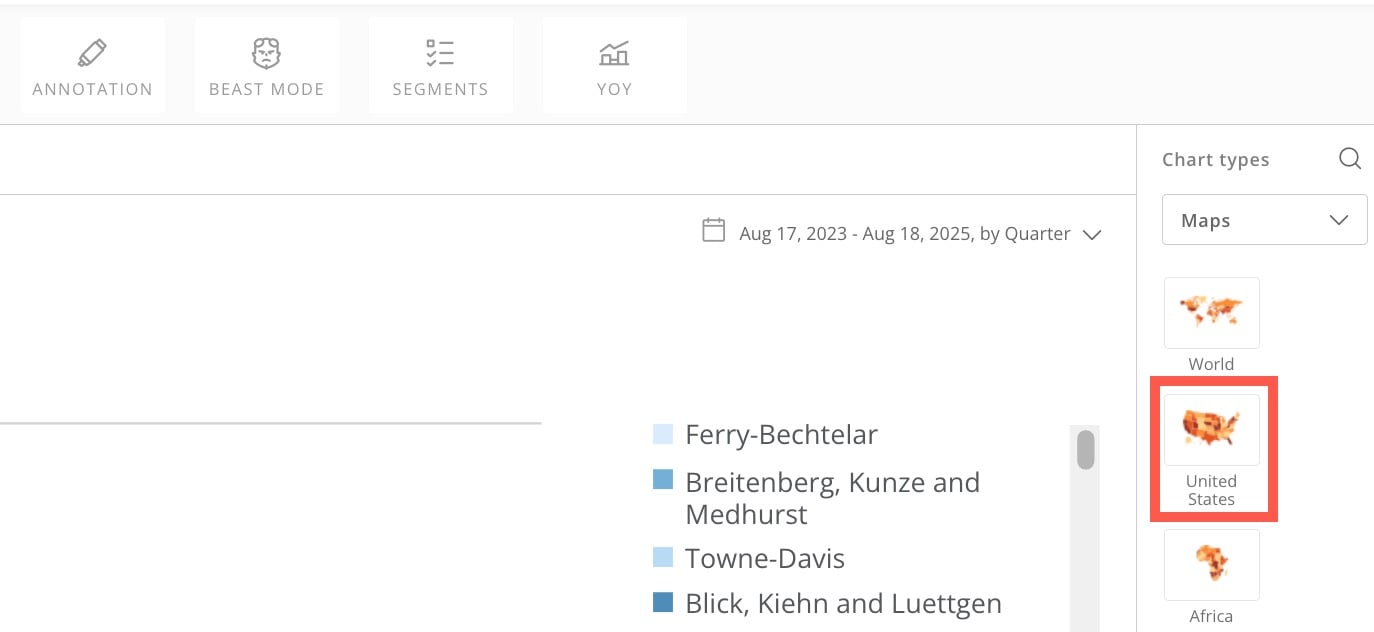
**Chart types** dropdown to choose **Maps** > **United States**.
12. Use the
**Chart types** dropdown to choose **Maps** > **United States**.
 13. From the
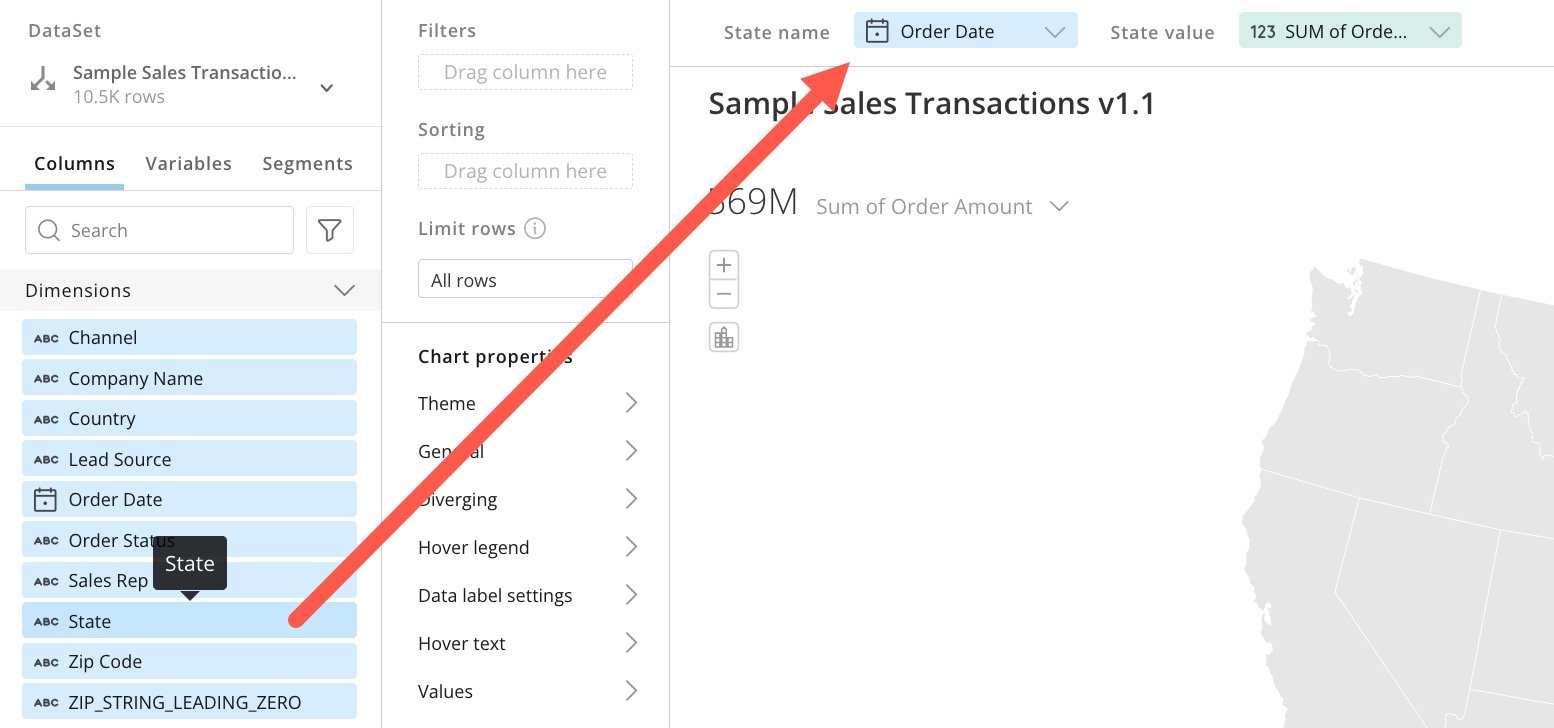
**Columns** tab on the left side of the screen, drag the `State` column to the **State name** field above the chart.
13. From the
**Columns** tab on the left side of the screen, drag the `State` column to the **State name** field above the chart.
 14. Under
**Chart properties** , to the left of the map, select **General** and check the box for **Balanced distribution**.
14. Under
**Chart properties** , to the left of the map, select **General** and check the box for **Balanced distribution**.
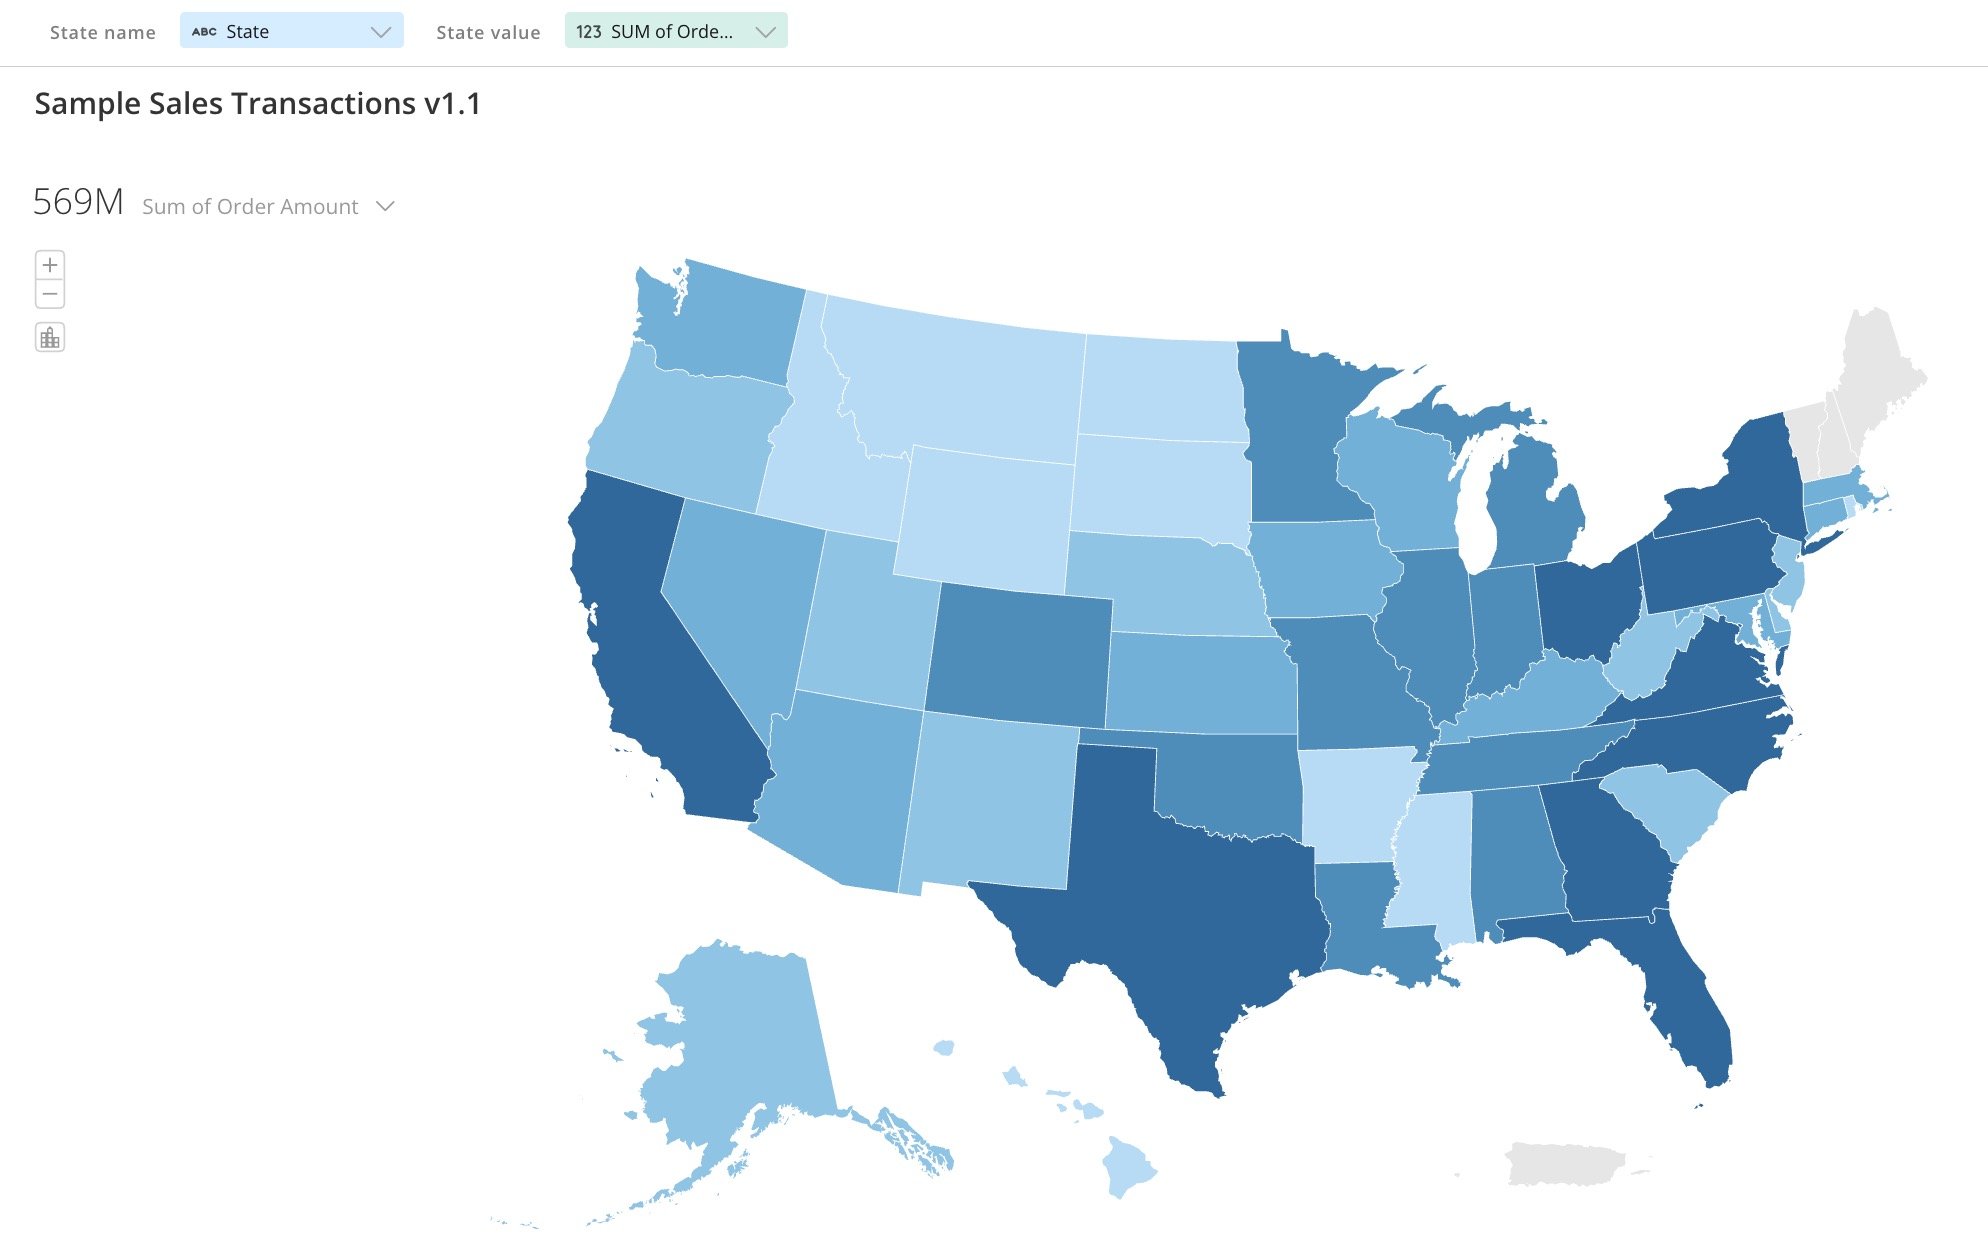
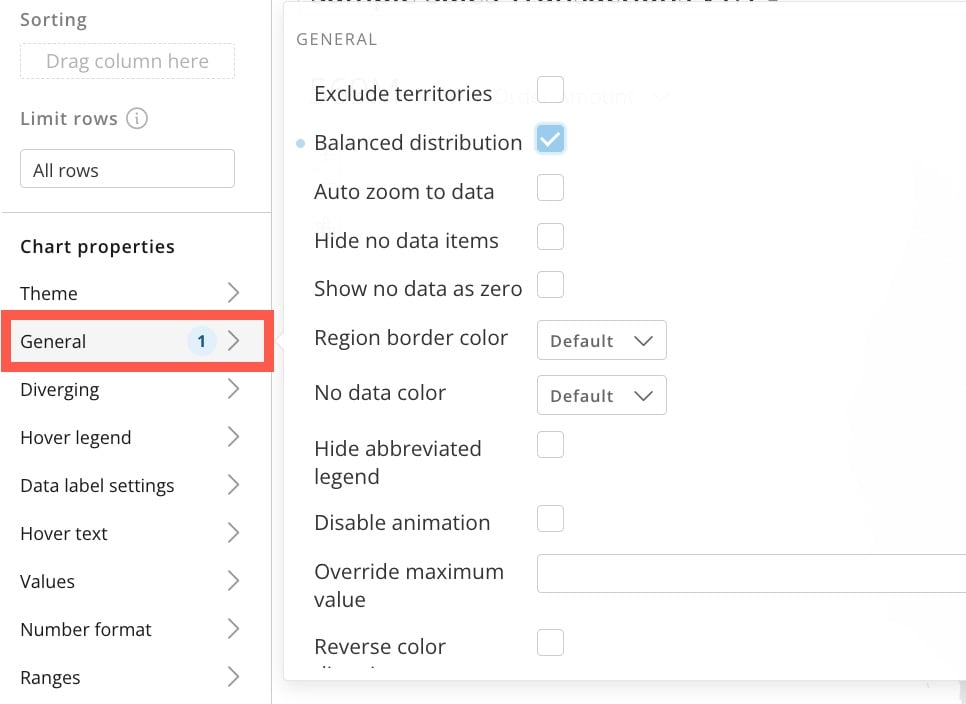 This places our values in equal-colored buckets, making our Map Chart tell a more straightforward story.
 15. Select
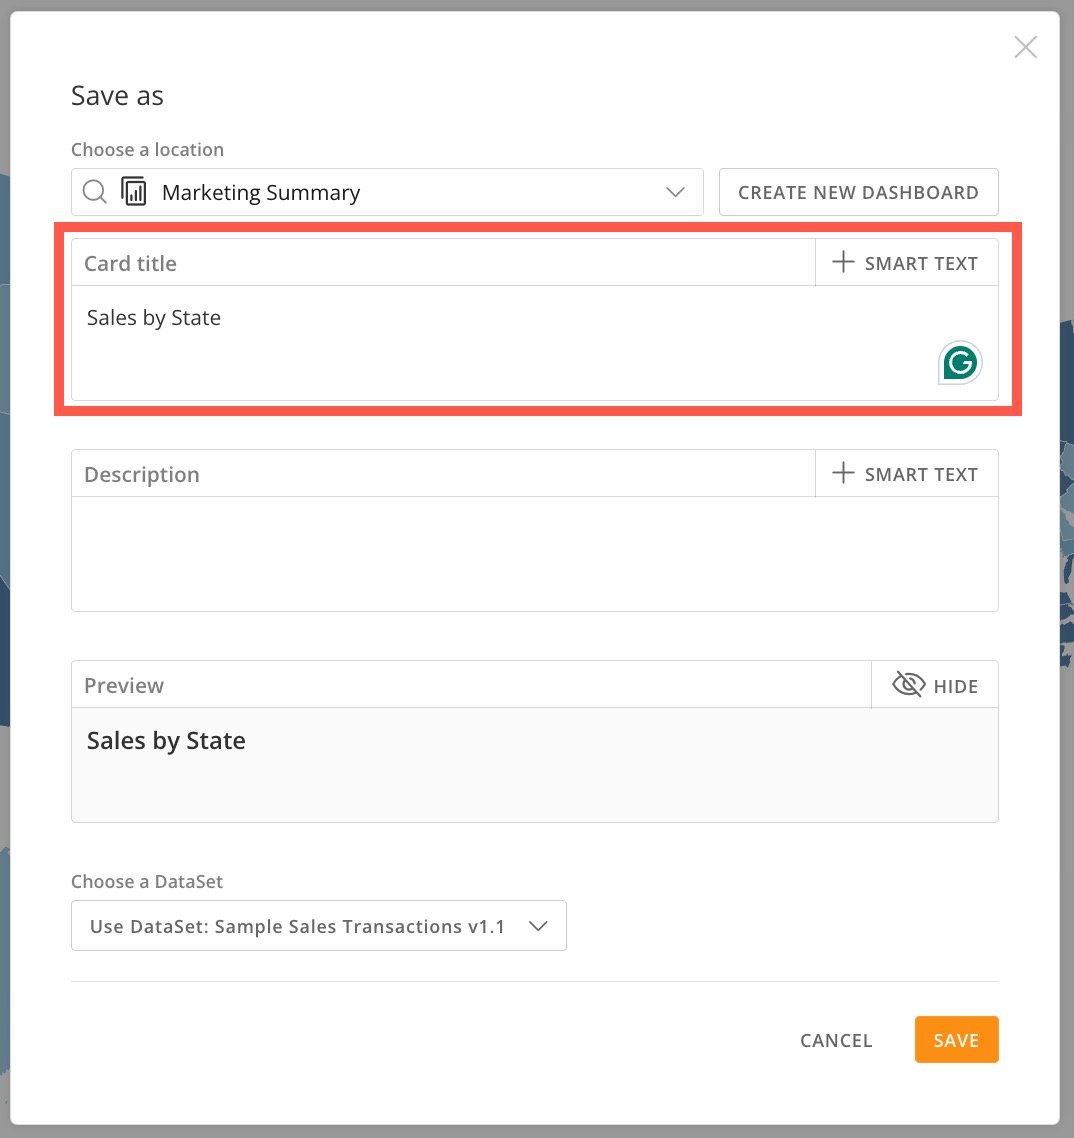
**Save as** and give the card a descriptive name. Then select **Save** to return to Analyzer.
15. Select
**Save as** and give the card a descriptive name. Then select **Save** to return to Analyzer.
 16. Close Analyzer to return to the dashboard.
17. At the top right of the dashboard, select
**Settings menu** (wrench icon) > **Edit Dashboard**.
16. Close Analyzer to return to the dashboard.
17. At the top right of the dashboard, select
**Settings menu** (wrench icon) > **Edit Dashboard**.
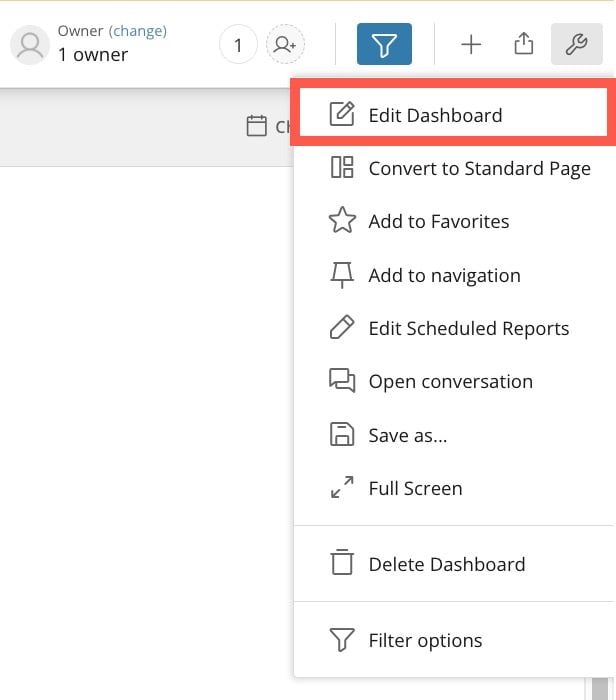 18. Drag the `Sales by State` card to the dashboard area. This adds a content frame.
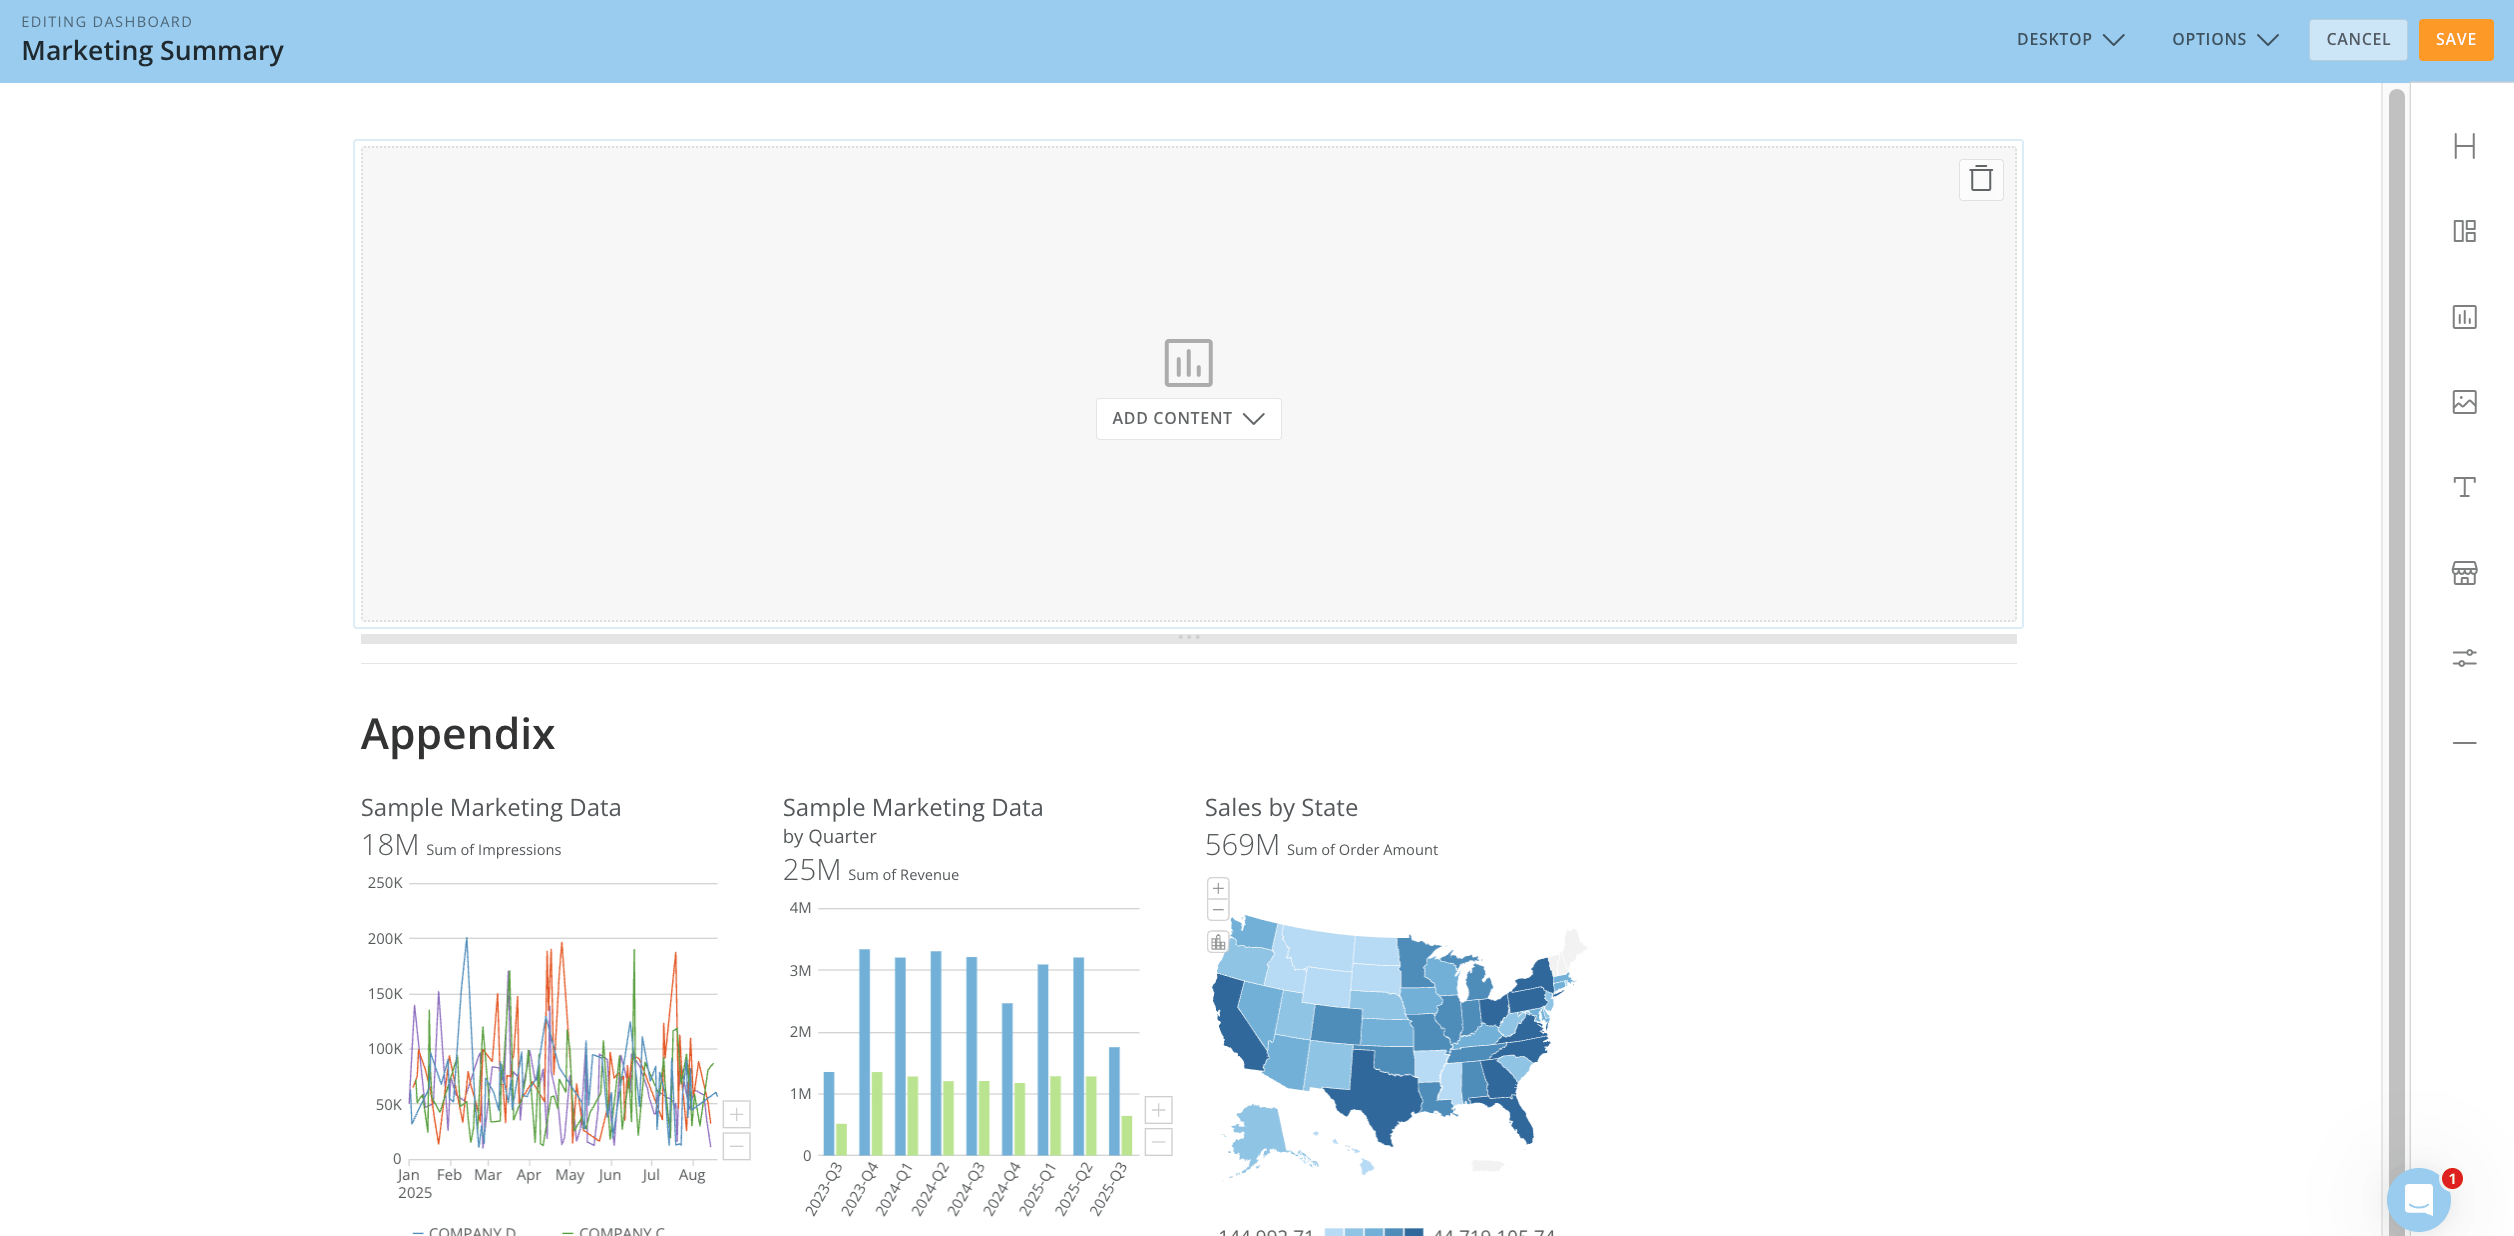 19. Drag the card to the dashboard again to add it to the content frame.
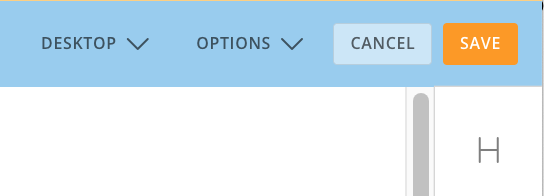
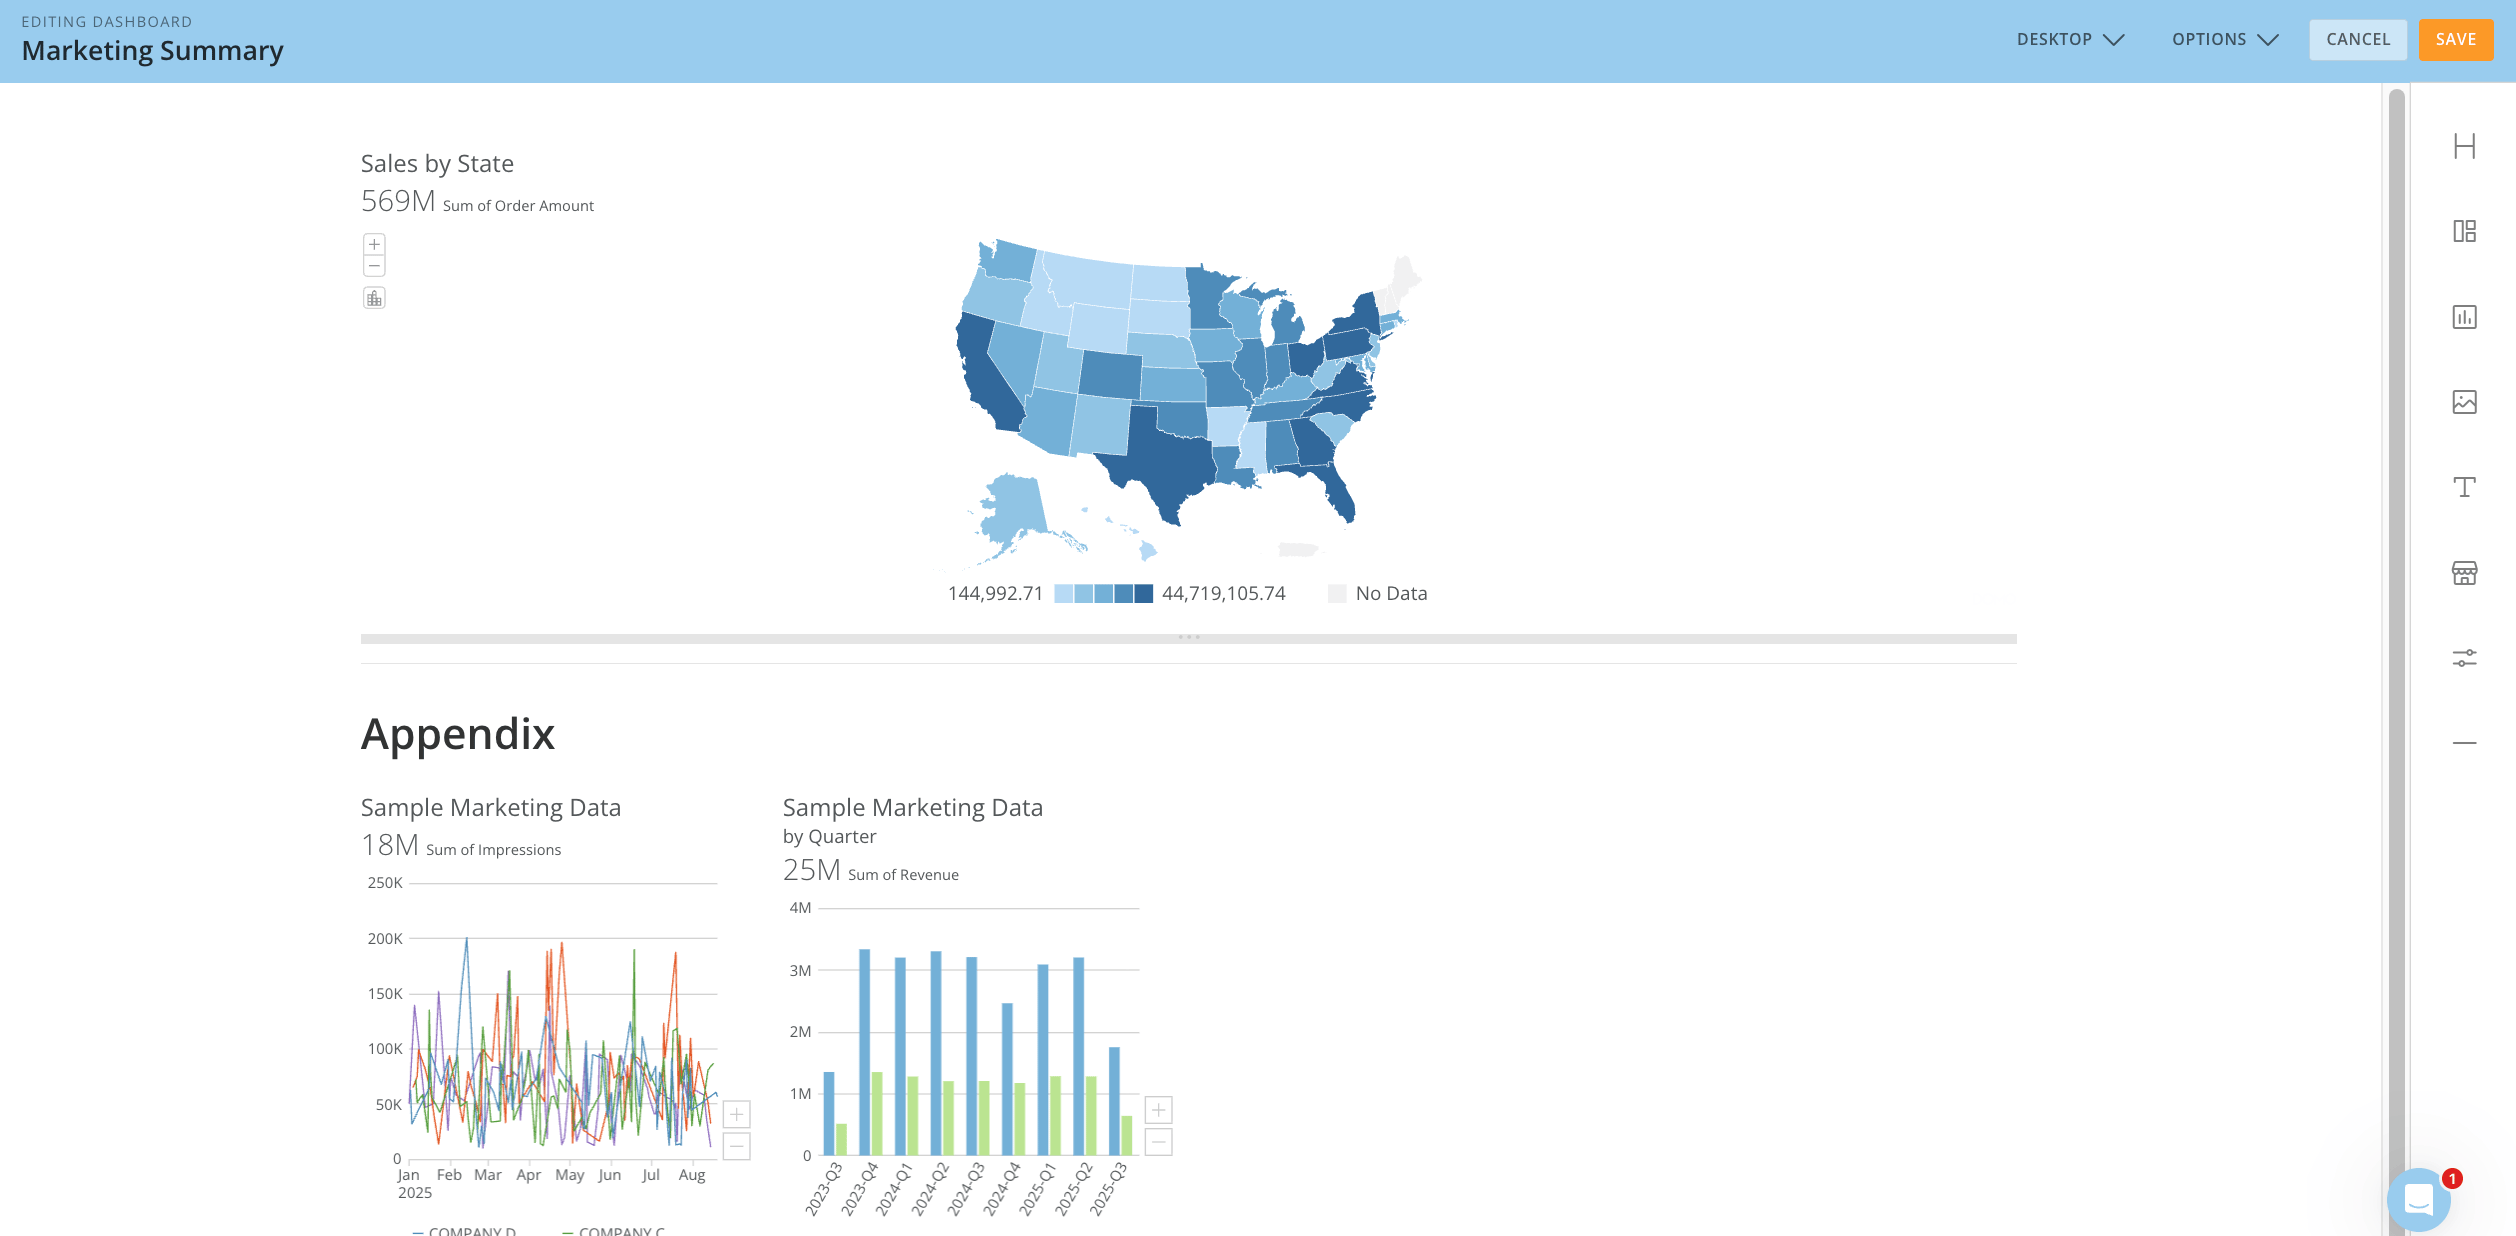 20. Select
**Save** to close the dashboard editor.
20. Select
**Save** to close the dashboard editor.
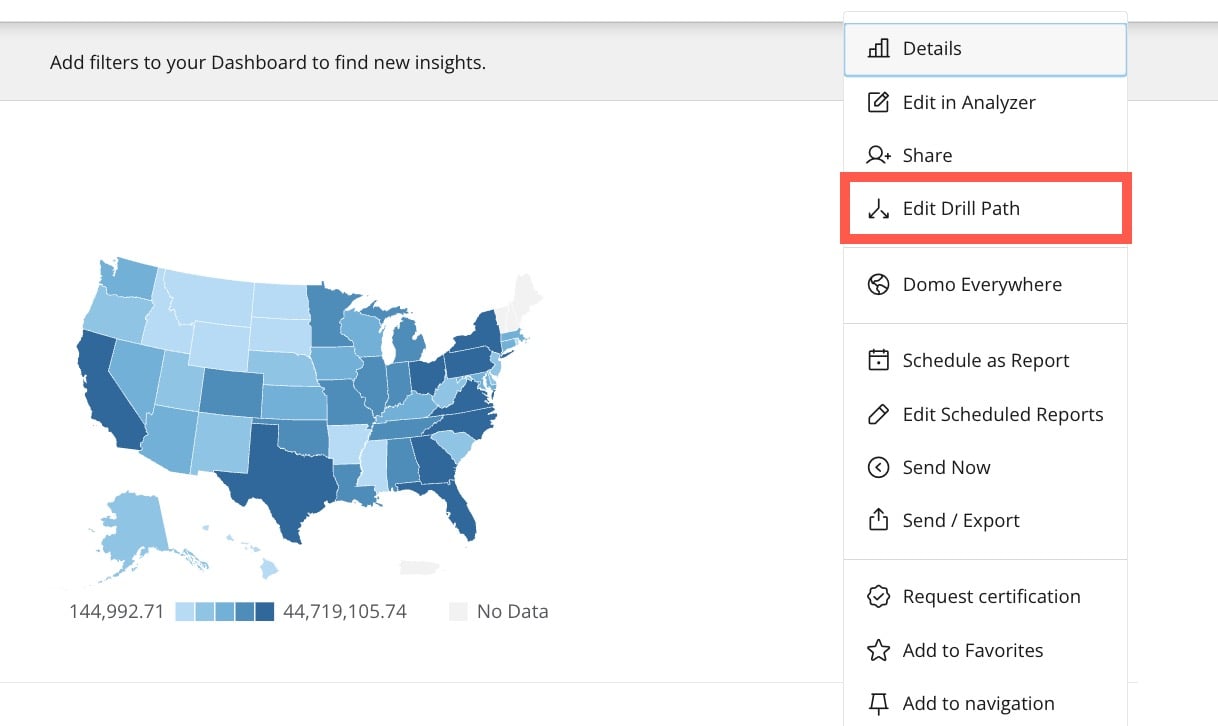
 21. On the dashboard, hover over the `Sales by State` card and select
**Card options** (wrench icon) > **Edit Drill Path**.
21. On the dashboard, hover over the `Sales by State` card and select
**Card options** (wrench icon) > **Edit Drill Path**.
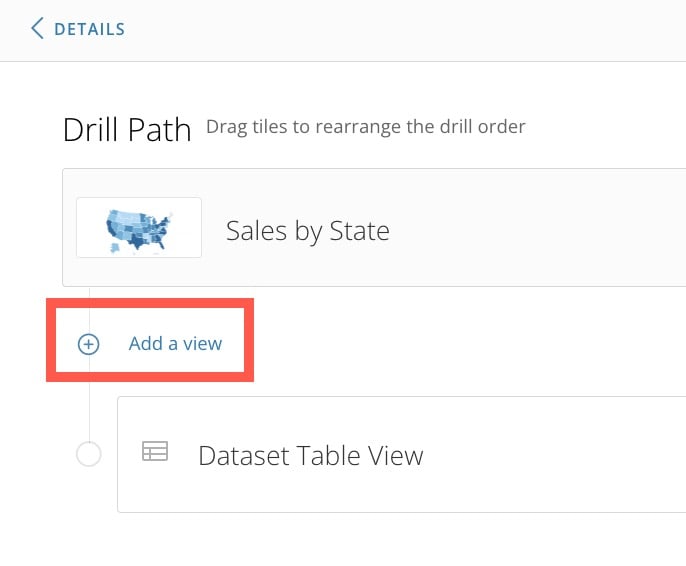
 22. Select
**Add a view** to create a layer below the original card. This brings us back into Analyzer.
22. Select
**Add a view** to create a layer below the original card. This brings us back into Analyzer.
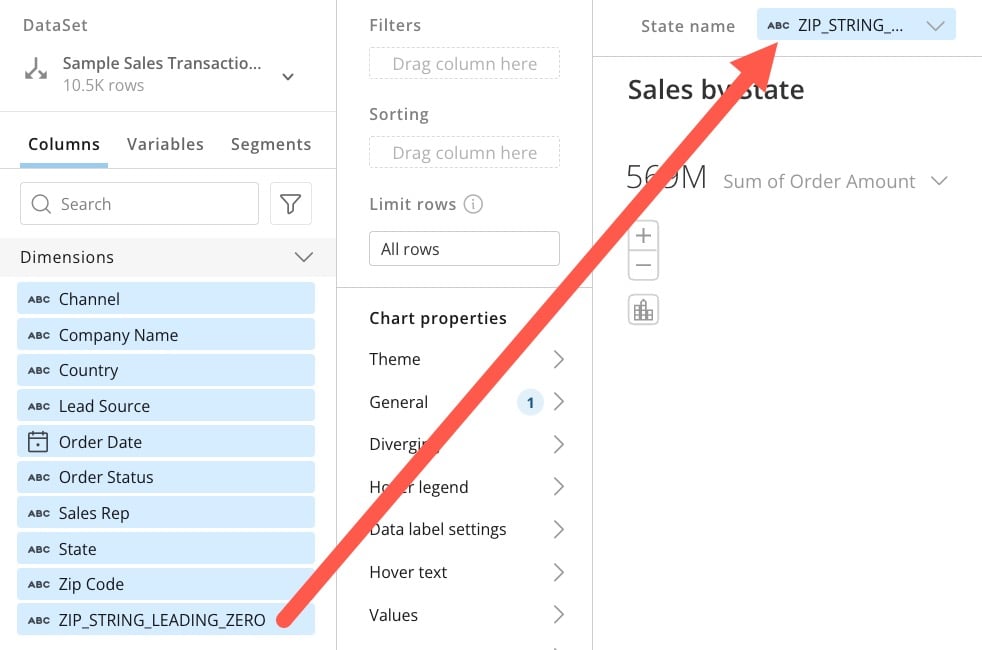
 23. This time, drag the `ZIP\_STRING\_LEADING\_ZERO` column to the
**State name** field.
23. This time, drag the `ZIP\_STRING\_LEADING\_ZERO` column to the
**State name** field.
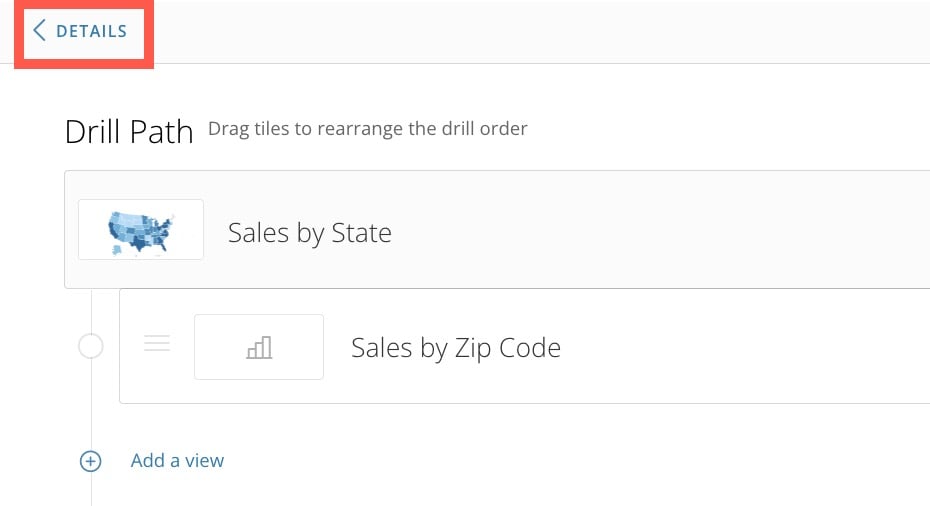
 24. Change the card's name to `Sales by Zip Code,` then save and close the card.
25. From the
**Drill Path** view, return to **Details**.
24. Change the card's name to `Sales by Zip Code,` then save and close the card.
25. From the
**Drill Path** view, return to **Details**.
 26. Select a state.
27. See its ZIP codes.
26. Select a state.
27. See its ZIP codes.
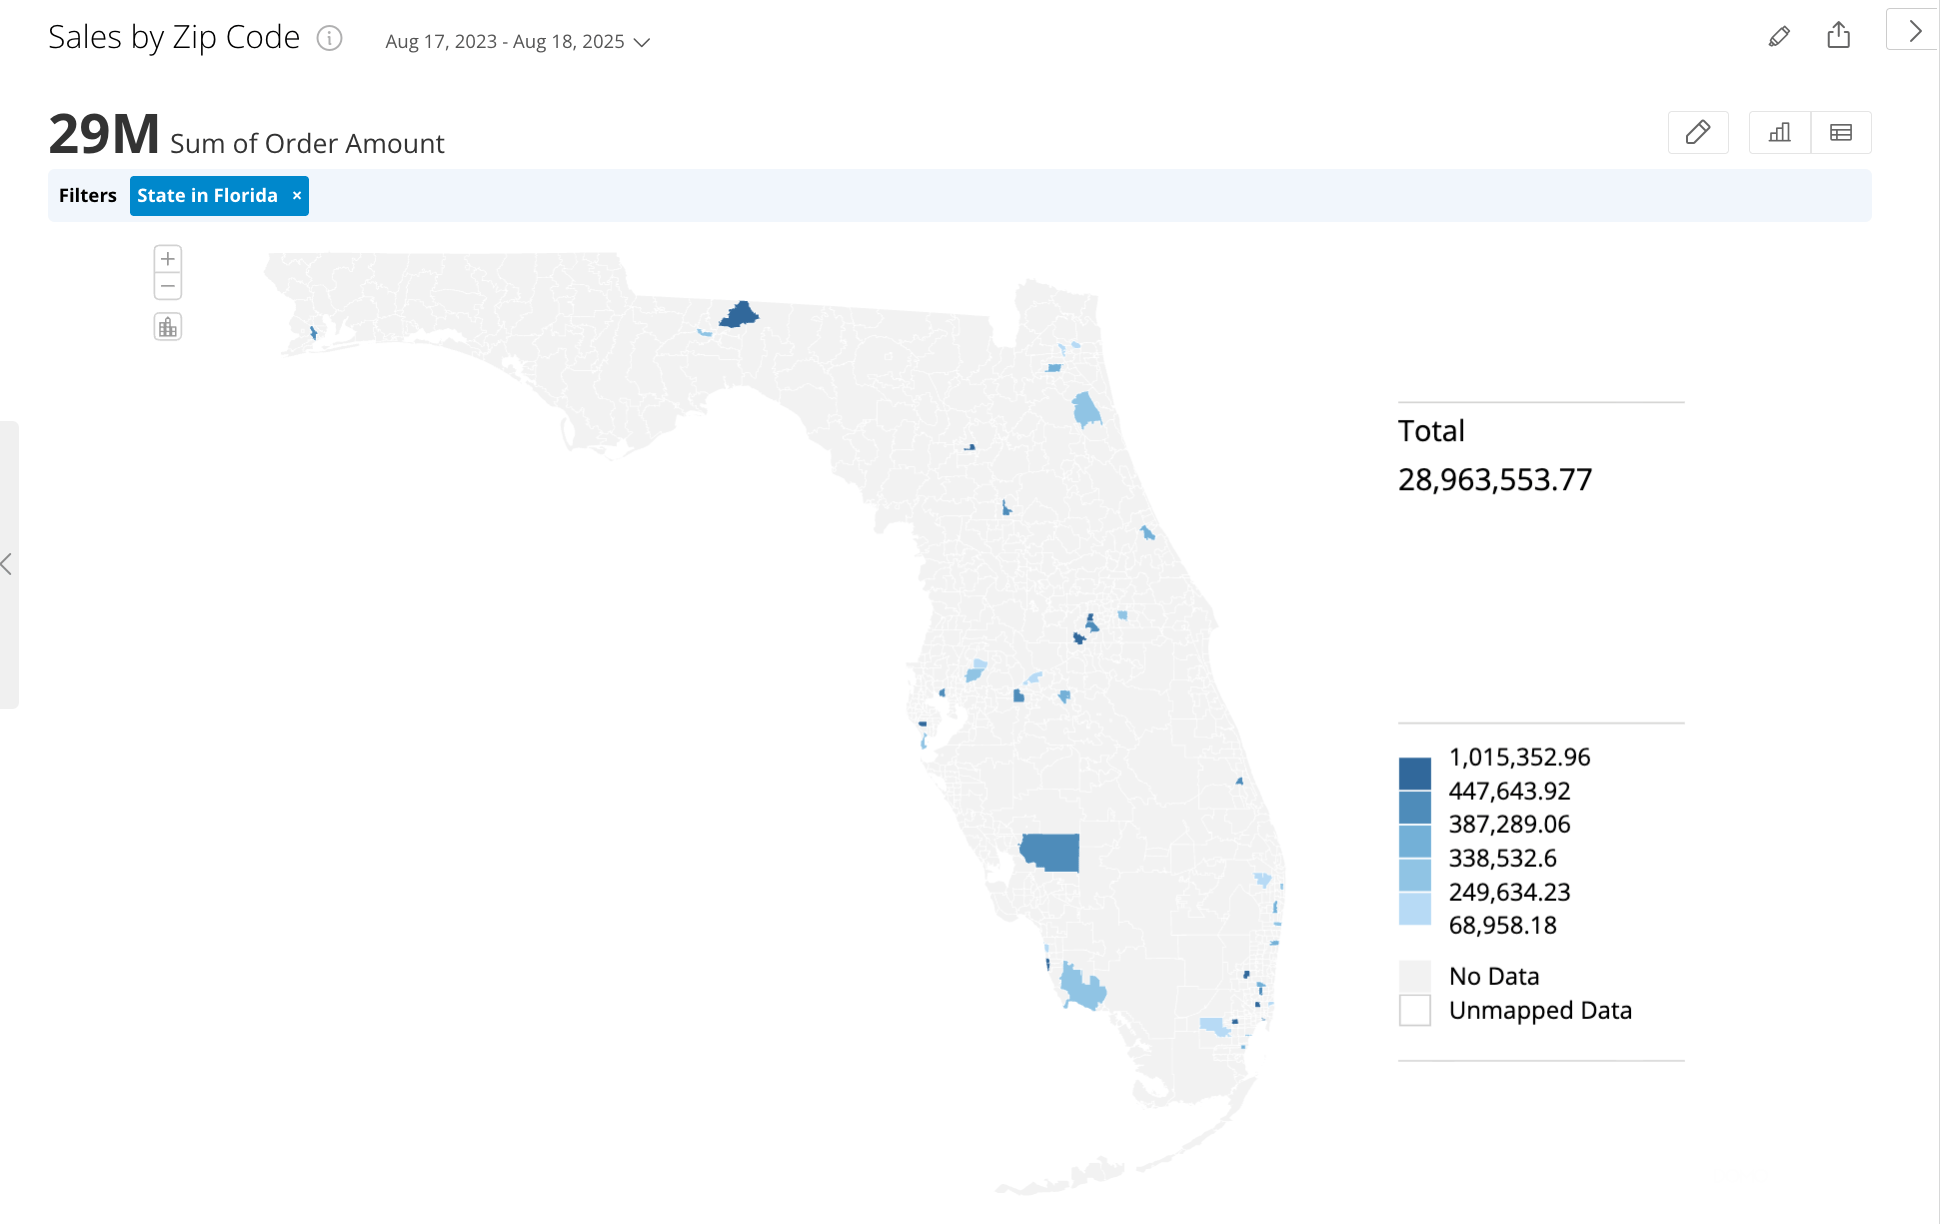 28. Navigate back using the breadcrumbs at the top of the chart.
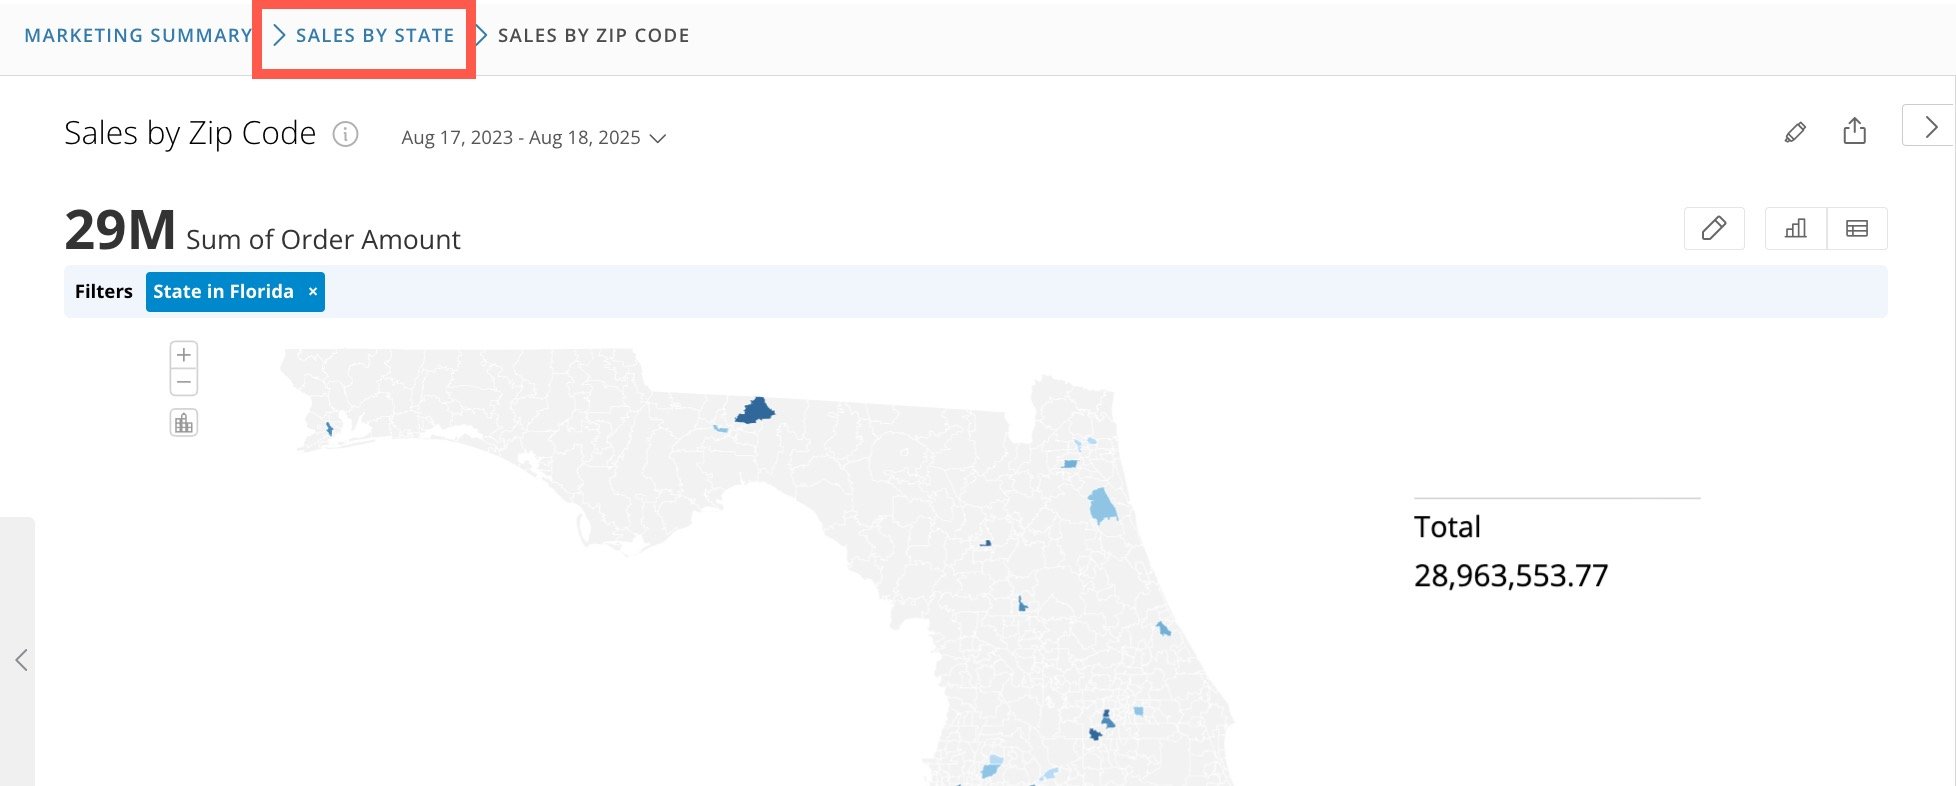 **Dashboard Functions**
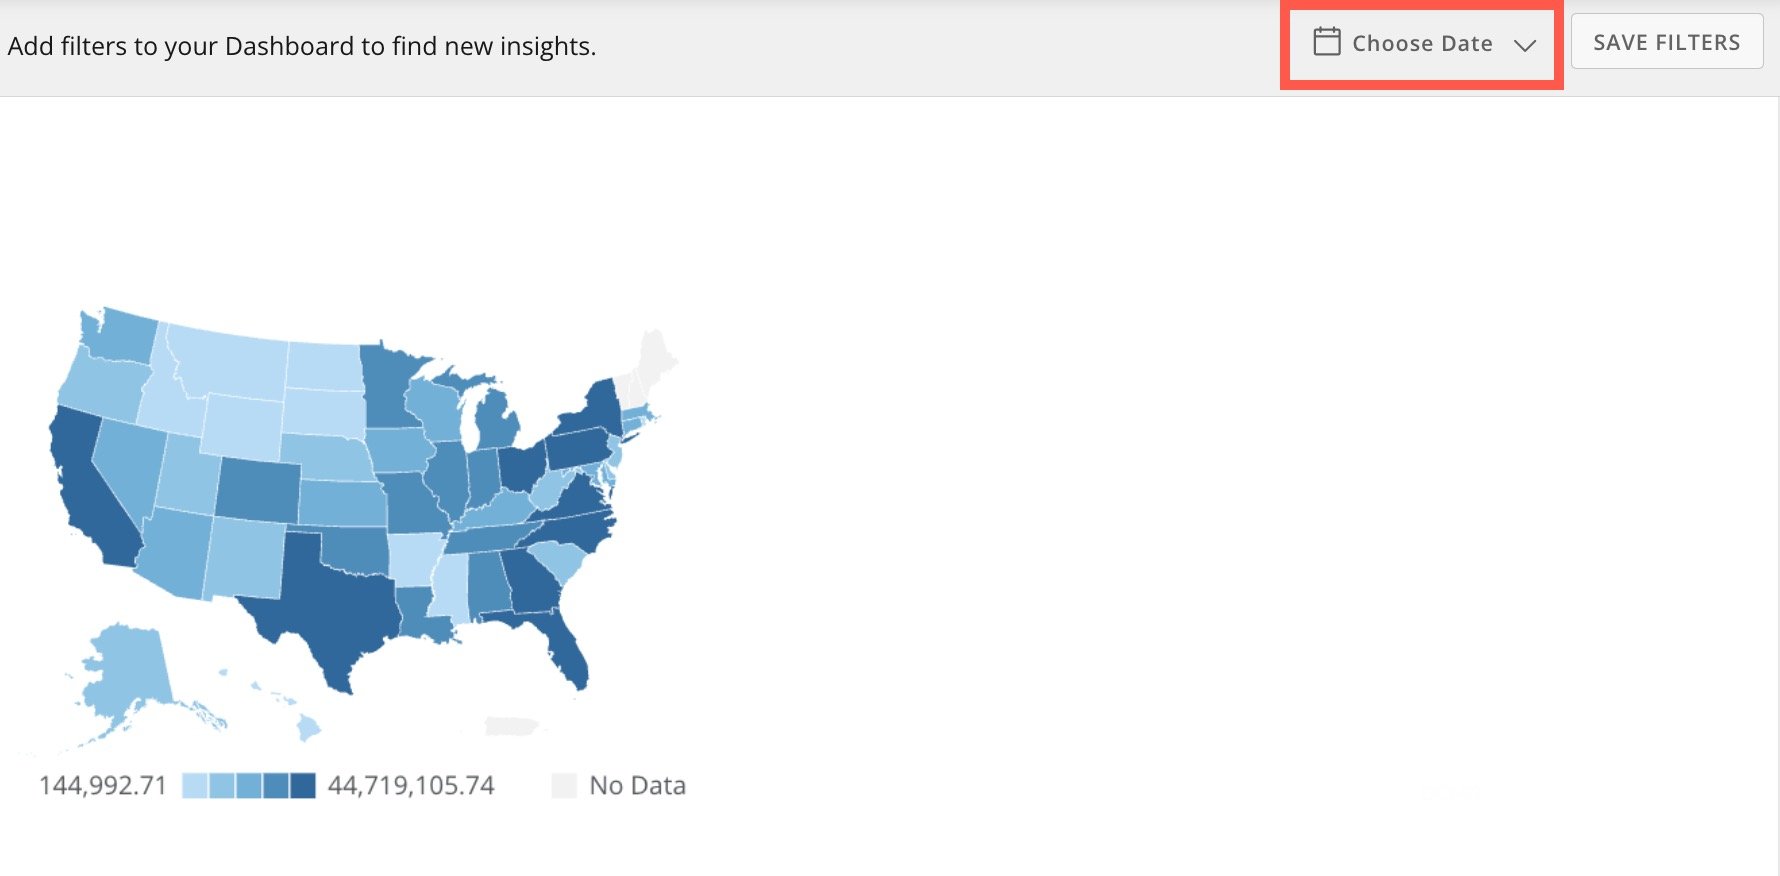
There are a lot of time ranges available when viewing your data on a dashboard.
29. Use the
**Choose Date** dropdown to explore the available time ranges and aggregations.
**Dashboard Functions**
There are a lot of time ranges available when viewing your data on a dashboard.
29. Use the
**Choose Date** dropdown to explore the available time ranges and aggregations.
 ### Get Started with Alerts
Domo Alerts is a powerful tool that can help you monitor specific conditions within your data and notify you when these conditions are met. This guide describes how to set up effective alerts for the five cards you built using the Marketing DataSet.
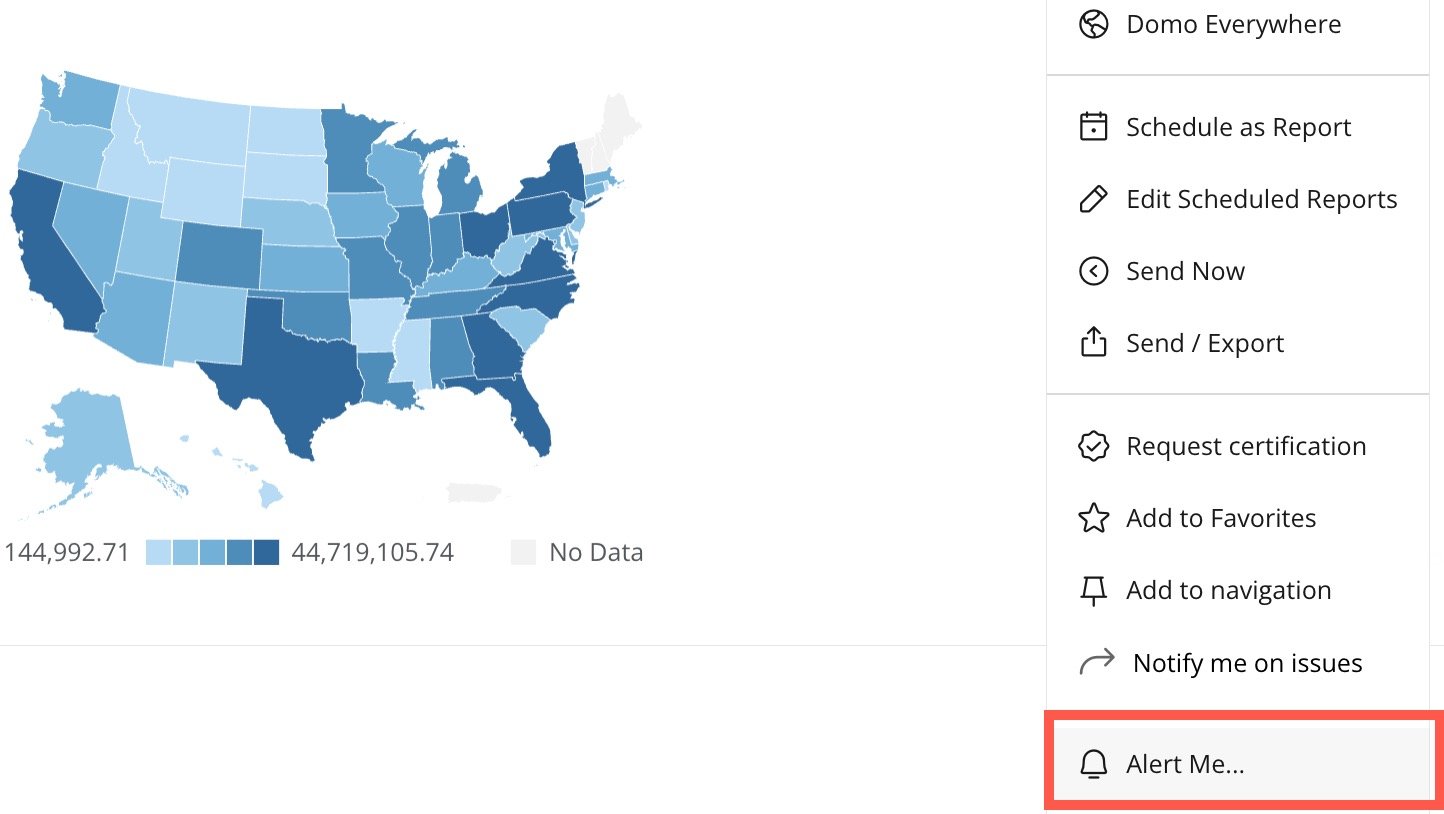
1. From the dashboard or appendix, hover over a card and select
**Card options** (wrench icon) > **Alert Me...**.
### Get Started with Alerts
Domo Alerts is a powerful tool that can help you monitor specific conditions within your data and notify you when these conditions are met. This guide describes how to set up effective alerts for the five cards you built using the Marketing DataSet.
1. From the dashboard or appendix, hover over a card and select
**Card options** (wrench icon) > **Alert Me...**.
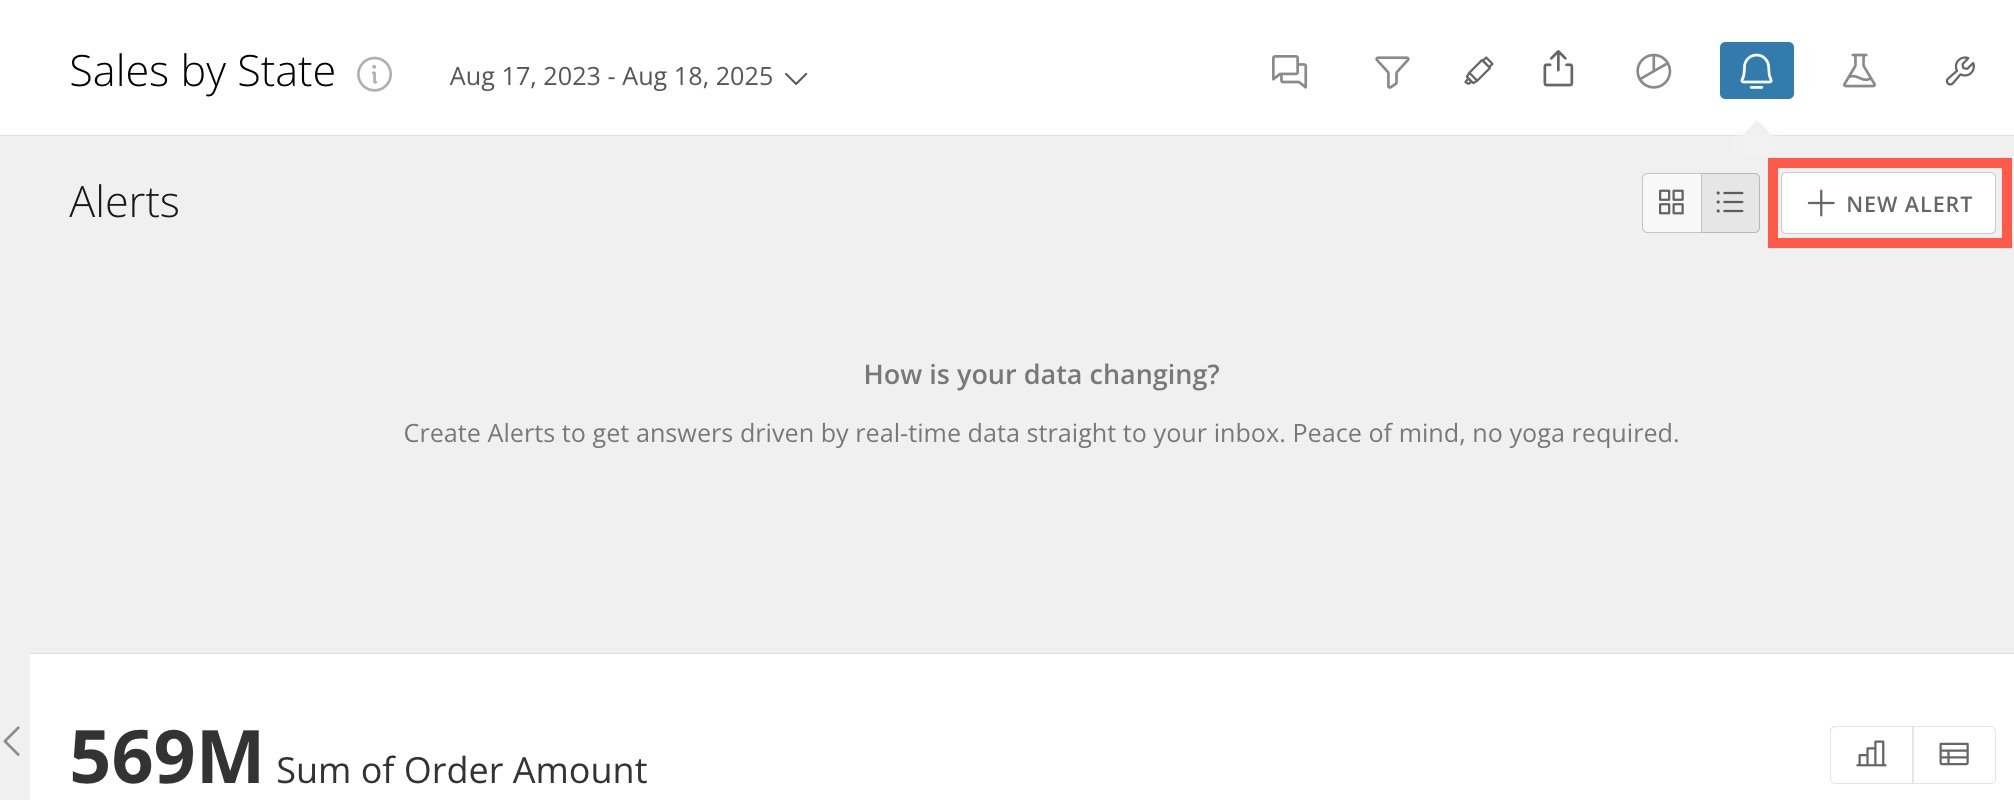
 2. Select
**+ New Alert** to open the alert modal.
2. Select
**+ New Alert** to open the alert modal.
 3. Use the
**Metric** dropdown to choose the metric you want to monitor. We'll choose **Summary number**.
4. Use the conditions dropdown to choose "Changes by —" and enter the value for that condition.
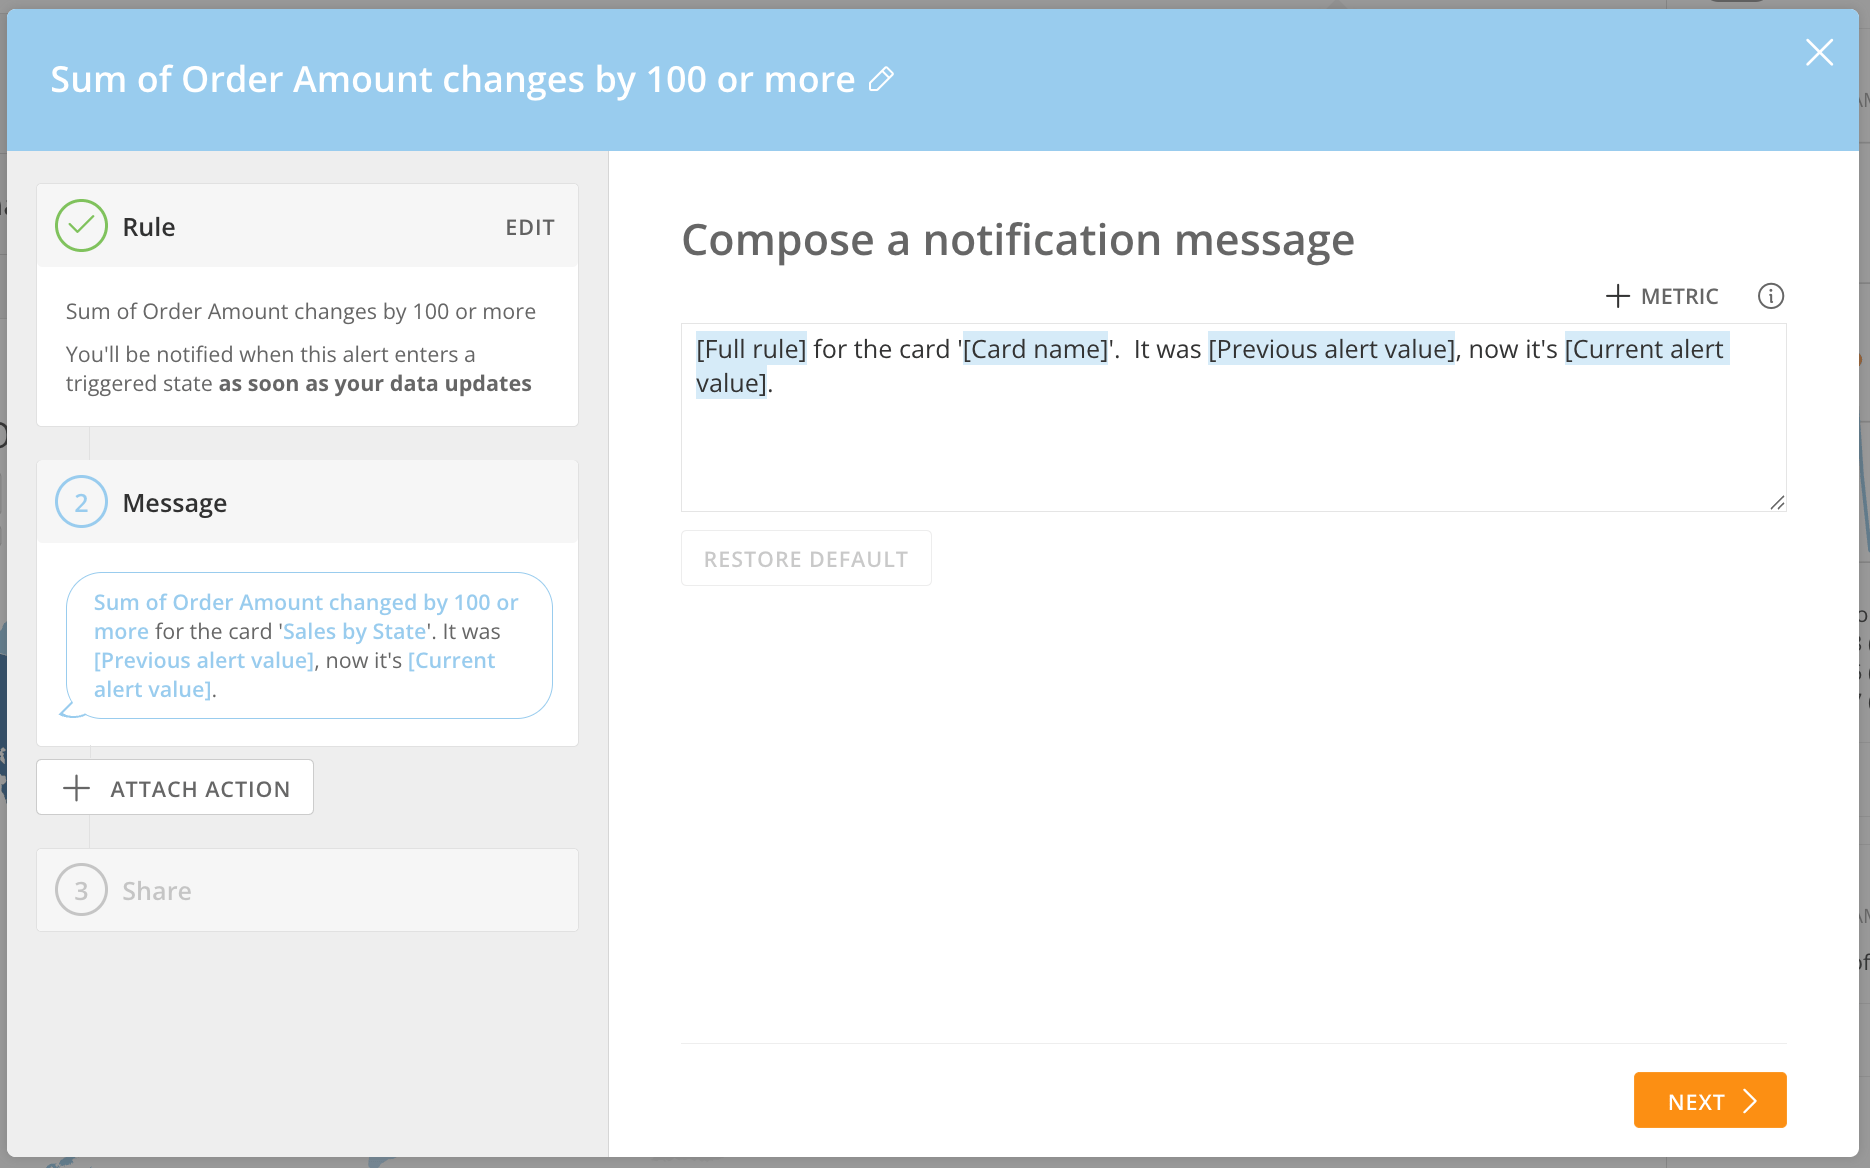
5. Select
**Next** and compose the message you want to receive when the alert triggers.
3. Use the
**Metric** dropdown to choose the metric you want to monitor. We'll choose **Summary number**.
4. Use the conditions dropdown to choose "Changes by —" and enter the value for that condition.
5. Select
**Next** and compose the message you want to receive when the alert triggers.
 6. Select
**Next** and choose anyone with whom to share the alert, then select **Save**. Close the alert modal.
**Tip:**
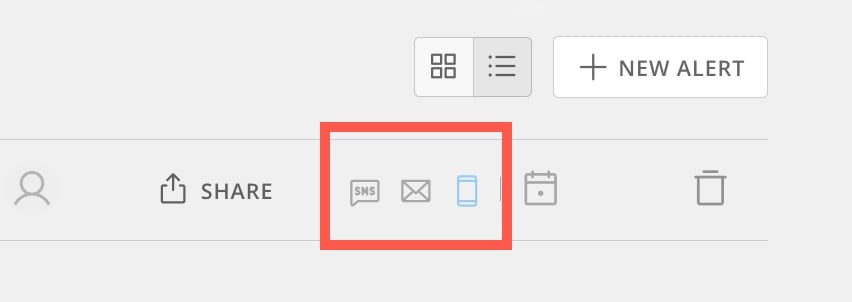
After setting an alert, you can choose how you want to receive the alert from the
**See Alerts**
section on the card. Options include via text, email, and mobile app notification.
6. Select
**Next** and choose anyone with whom to share the alert, then select **Save**. Close the alert modal.
**Tip:**
After setting an alert, you can choose how you want to receive the alert from the
**See Alerts**
section on the card. Options include via text, email, and mobile app notification.