> ## Documentation Index
> Fetch the complete documentation index at: https://domoinc-openapi-sync-dataflows.mintlify.site/llms.txt
> Use this file to discover all available pages before exploring further.

# Forecasting Universal Model

export const InlineImage = ({src, alt = '', height = '1.6em'}) => {
  return <img noZoom src={src} alt={alt} style={{
    display: 'inline',
    verticalAlign: 'start',
    height: height,
    margin: '0'
  }} />;
};

### Intro

The Forecasting Universal Model simplifies predictive forecasting, making it accessible to all technical levels. With easy-to-select options, you can configure the Forecasting Universal Model to predict future data points based on patterns or trends in your data without needing to build a forecasting model from the beginning. Learn more about forecasting generally in the [FAQ](#general_forecasting_questions) below.

In this article, learn how to [add a forecast to a line or bar chart](#forecasting_in_app) to a card in App Studio (the forecast includes two confidence interval ranges) or [try out different configurations](#forecasting_in_aiplayground) in the Domo. AI Playground. With the Forecasting Service, you can extract the cURL code and use it in other settings, such as when interacting with an API.

<Tip>
  **Learn more about forecasting and Universal Models with these resources:**

  * [Forecasting overview](https://github.com/domoinc/domo-data-science-resources/blob/main/webinars/Domo_Lunch%26Learn_Forecasting_230406.pdf)
    <InlineImage src="/images/kb/ka0Vq0000000qbJ-00N5w00000Ri7BU-0EMVq000000MdXN.jpg" /> (slide deck)
  * [Forecasting with Domo](https://www.youtube.com/live/60LNo7Nzoe8?si=AqYEW3GeINHfjRE-\&t=308)
    [<InlineImage src="/images/kb/ka0Vq0000000qbJ-00N5w00000Ri7BU-0EMVq000000MdXN.jpg" />](https://www.youtube.com/live/60LNo7Nzoe8?si=AqYEW3GeINHfjRE-\&t=308) (webinar from Domo data scientists)
  * [Domo blog on Universal Models](https://www.domo.com/blog/universal-models-forecast-and-more-without-building-a-model-from-scratch/)
    [<InlineImage src="/images/kb/ka0Vq0000000qbJ-00N5w00000Ri7BU-0EMVq000000MdXN.jpg" />](https://www.youtube.com/live/60LNo7Nzoe8?si=AqYEW3GeINHfjRE-\&t=308)
  * [Live demo of Universal Models](https://www.linkedin.com/events/7211414990803587076/comments/)
    [<InlineImage src="/images/kb/ka0Vq0000000qbJ-00N5w00000Ri7BU-0EMVq000000MdXN.jpg" />](https://www.youtube.com/live/60LNo7Nzoe8?si=AqYEW3GeINHfjRE-\&t=308) on LinkedIn
</Tip>

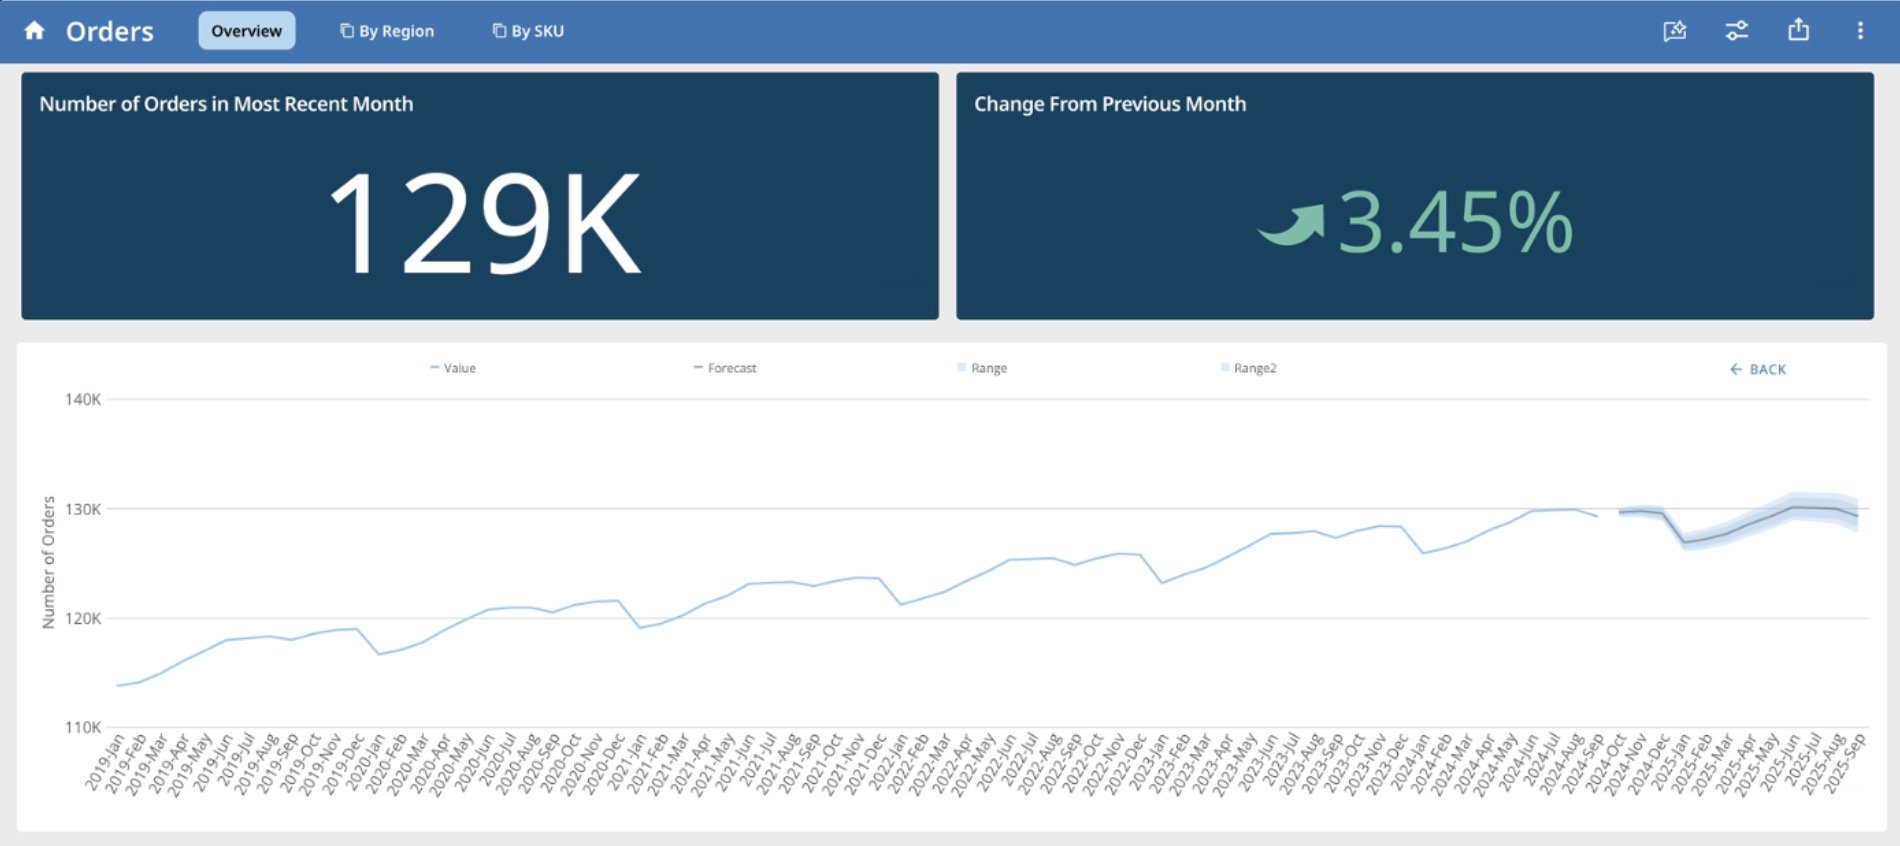
Image: *Forecasting in a Domo App via the Forecasting Universal Model*

<Frame>
  <img alt="forecasting with um in app studio.jpg" src="https://mintcdn.com/domoinc-openapi-sync-dataflows/EtHMjR0Dwu423b1z/images/kb/ka0Vq0000004swH-00N5w00000Ri7BU-0EMVq000003QVGA.jpg?fit=max&auto=format&n=EtHMjR0Dwu423b1z&q=85&s=d8a19c5fde582dbf100f4a934fd9ff7a" style={{width: 900, height: 401}} width="1900" height="846" data-path="images/kb/ka0Vq0000004swH-00N5w00000Ri7BU-0EMVq000003QVGA.jpg" />
</Frame>

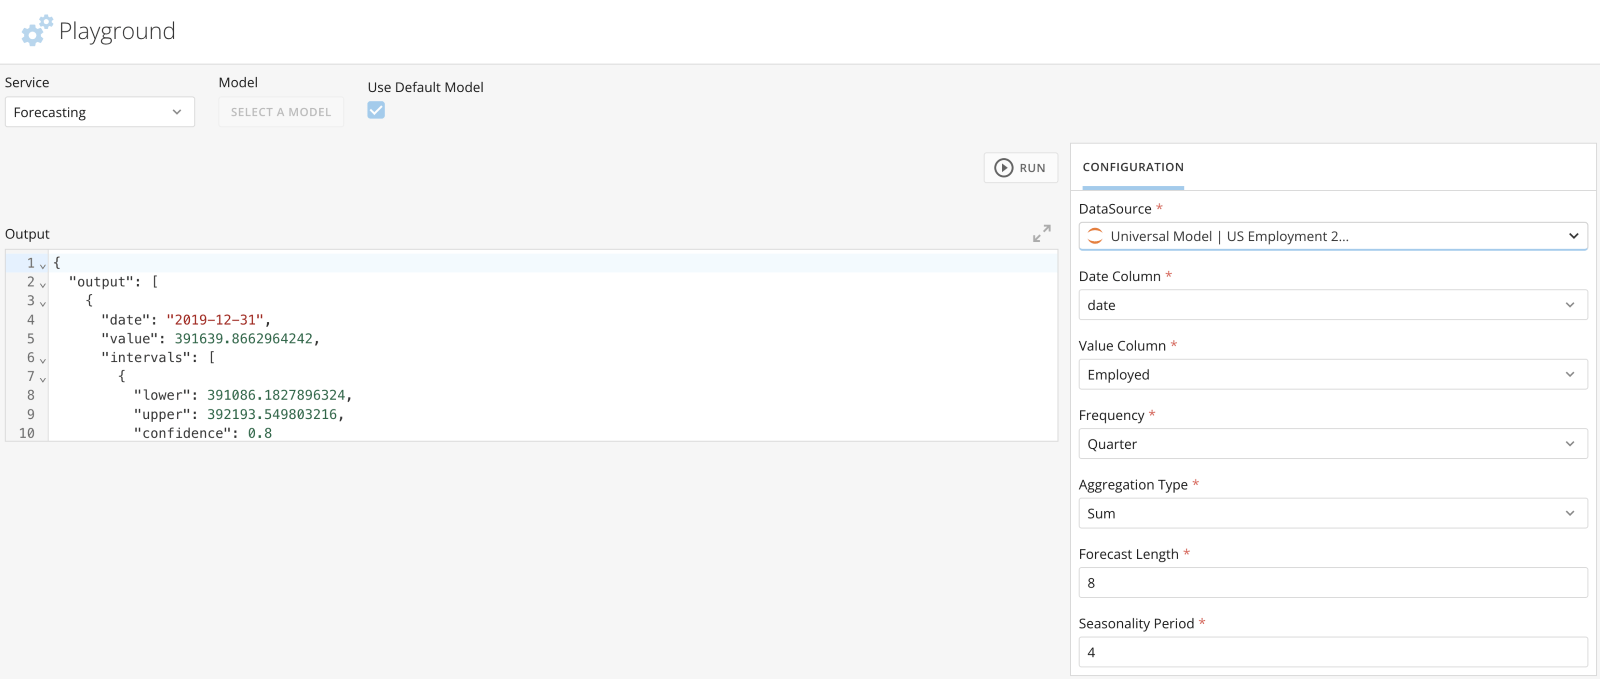
Image: *Forecasting in [Domo.AI](http://Domo.AI) Playground via the Forecasting Universal Model*
<Frame>
  <img alt="A screenshot of a computerDescription automatically generated" src="https://mintcdn.com/domoinc-openapi-sync-dataflows/EtHMjR0Dwu423b1z/images/kb/ka0Vq0000004swH-00N5w00000Ri7BU-0EMVq0000032BfB.jpg?fit=max&auto=format&n=EtHMjR0Dwu423b1z&q=85&s=10925d374eb6a6efc6a6070828bb70c2" style={{width: 882, height: 375}} width="1600" height="679" data-path="images/kb/ka0Vq0000004swH-00N5w00000Ri7BU-0EMVq0000032BfB.jpg" />
</Frame>

***

### Enable the Forecasting Universal Model

Contact your Domo account team to enable the Forecasting Universal Model in your instance. See [Required Grants](#required_grants) for information on controlling access to the tool when enabled.

### Required Grants

To access the Forecasting Universal Model, one of the following three grants must be enabled for your role:

* **Create AI Service Models —** Allows users to create new models and edit, deploy, and delete models you can access.
* **Use AI Services —** Allows users to access AI services for use in Domo apps, Domo Bricks, Jupyter Workspaces, and Workflows. This grant should be given to any user who needs to use AI services but does not need to manage them.
* (Admin only) **Manage AI Services —** Allows admins to create, edit, deploy, and delete all models in AI Models.

If you are using the Forecasting Universal Model via App Studio, you also need the following grant. Domo admins have this grant by default.

* **Edit App (App Studio)** **—** Create, edit, share, and delete apps in App Studio.

Learn more about [grants](/s/article/360043438973).

### Forecast in a Domo App

The Forecasting Universal Model allows you to easily add a forecast to a line or bar chart card in a Domo app. You can use App Studio to input the seasonality of your data and the number of time points you would like to forecast. The forecast is automatically added to your card along with two confidence interval ranges.

Note that the line or bar chart you add to a forecast must have the following:

* A *date* column on the x-axis (values must be stored as a timestamp data type or with a daily, weekly, monthly, quarterly, or yearly granularity level)
* A *numeric* column on the y-axis (values in this column must be stored as an integer, floating decimal, or fixed decimal data type)
* No *series* column.

In the example image below, a line chart is embedded in an app that could be used for forecasting using the Forecasting Universal Model. The "Number of Orders | By Month" card uses a date column on the x-axis and a numeric column on the y-axis.
<Frame>
  <img alt="forecasting with um in app studio.jpg" src="https://mintcdn.com/domoinc-openapi-sync-dataflows/EtHMjR0Dwu423b1z/images/kb/ka0Vq0000004swH-00N5w00000Ri7BU-0EMVq000003QVGA.jpg?fit=max&auto=format&n=EtHMjR0Dwu423b1z&q=85&s=d8a19c5fde582dbf100f4a934fd9ff7a" style={{width: 898, height: 400}} width="1900" height="846" data-path="images/kb/ka0Vq0000004swH-00N5w00000Ri7BU-0EMVq000003QVGA.jpg" />
</Frame>

<Tip>
  **Tip:** Learn more about [App Studio](https://domo-support.domo.com/s/topic/0TOVq0000000iU5OAI/app-studio?language=en_US) in the Knowledge Base.
</Tip>

# Other Forecasting Scenarios

Do you want to add a forecast to an existing line or bar chart card that is not embedded in an app? You'll need to embed it in an app. Learn how to [create an app](https://domo-support.domo.com/s/article/000005295?language=en_US#create_app) and then [embed your existing card](https://domo-support.domo.com/s/article/000005295?language=en_US#add_actions_and_elements).

Do you want to add a forecast to a line or bar chart card embedded in an app someone else owns? The app owner must share the app with you. Learn how to [share apps](https://domo-support.domo.com/s/article/000005295?language=en_US#view_app) with other Domo users.

Still have questions? See the [FAQ](#faq).

# Add a Forecast to a Line or Bar Chart Card

To add a forecast generated by the Forecasting Universal Model to a Line or Bar Chart embedded in an app, you must have the [required grants](#required_grants) and follow these steps:

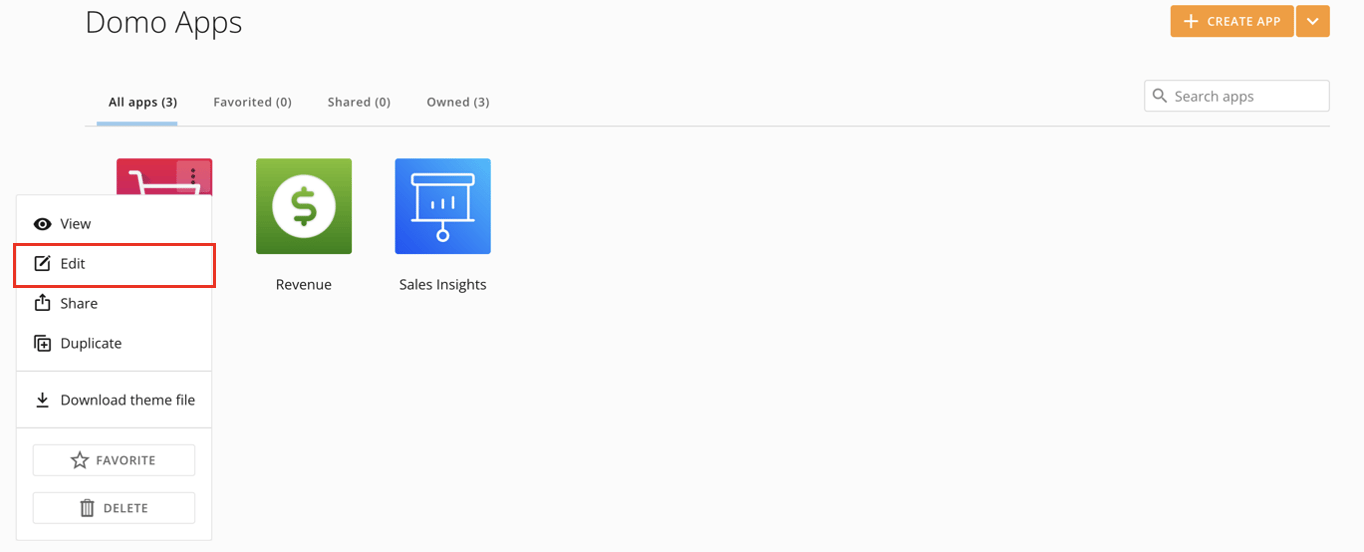
1. Go to the Apps Home and locate the app to which you want to add the forecast.
2. Hover over the app's icon and select
   <InlineImage src="/images/kb/ka0Vq0000005PU1-00N5w00000Ri7BU-0EMVq0000032UzZ.jpg" /> **More** (three vertical dots icon) > **Edit** to open it in edit mode.

   <Frame>
     <img alt="A screenshot of a computerDescription automatically generated" src="https://mintcdn.com/domoinc-openapi-sync-dataflows/EtHMjR0Dwu423b1z/images/kb/ka0Vq0000004swH-00N5w00000Ri7BU-0EMVq0000032VKX.jpg?fit=max&auto=format&n=EtHMjR0Dwu423b1z&q=85&s=4d0f6405614e96c49b17c86e6862eb35" style={{width: 800, height: 323}} width="1364" height="552" data-path="images/kb/ka0Vq0000004swH-00N5w00000Ri7BU-0EMVq0000032VKX.jpg" />
   </Frame>
3. Find and select the specific card you want to add the forecast to.

   The card displays with a blue outline and the right configuration panel opens.
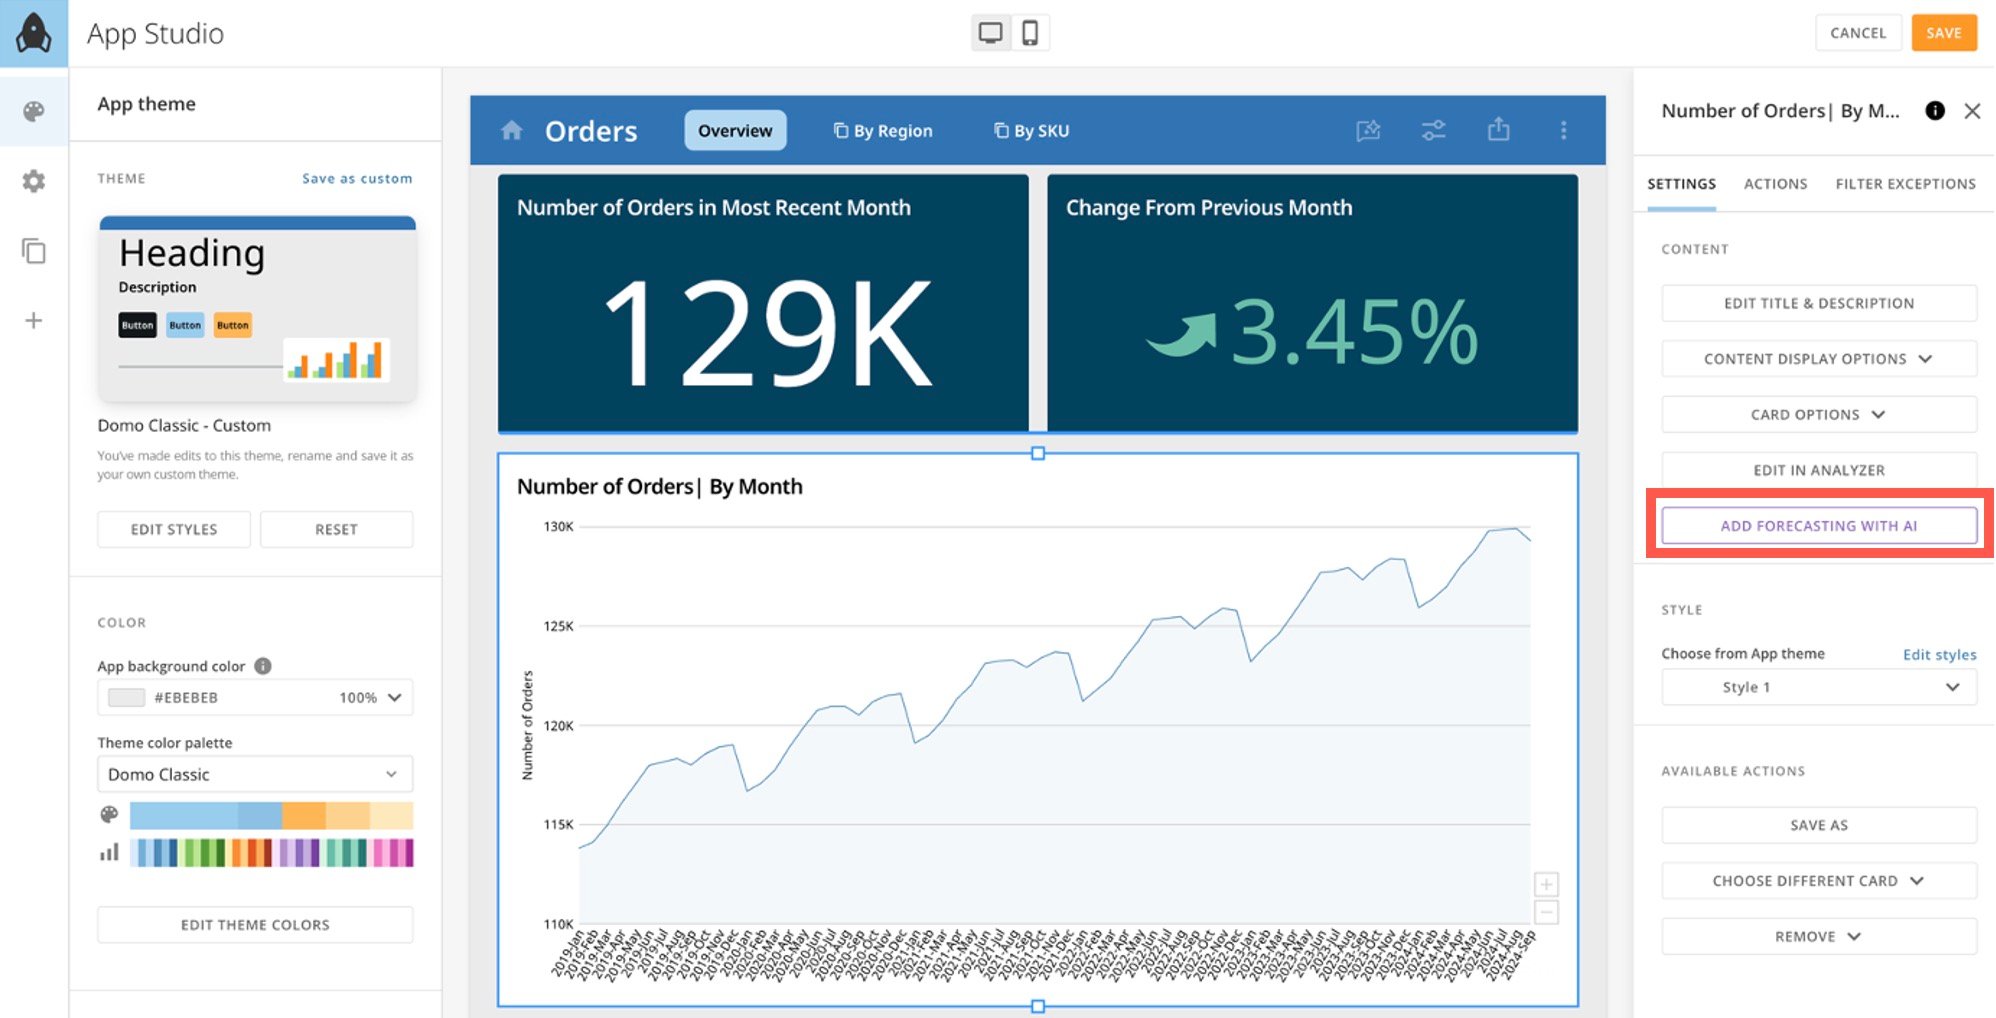
4. In the **Settings** tab of the right configuration panel, select **Add Forecasting with AI**. If this option is not enabled, then the card is not compatible with the Forecasting Universal Model.
   <Frame>
     <img alt="add forecasting with ai.jpg" src="https://mintcdn.com/domoinc-openapi-sync-dataflows/EtHMjR0Dwu423b1z/images/kb/ka0Vq0000004swH-00N5w00000Ri7BU-0EMVq000003QtSA.jpg?fit=max&auto=format&n=EtHMjR0Dwu423b1z&q=85&s=6e371a1a6dd145b4f617bd51f933c105" style={{width: 900, height: 459}} width="1996" height="1018" data-path="images/kb/ka0Vq0000004swH-00N5w00000Ri7BU-0EMVq000003QtSA.jpg" />
   </Frame>

   <Warning>
     **Important:** Within App Studio, the Forecasting Universal Model is compatible with either Line Chart Cards or Bar Chart Cards that have been added as an element in an app. The line or bar chart must have the following:

     * A
       *date* column (values in this column must be stored as a date or time stamp data type, and be at the daily, weekly\*, monthly, quarterly, or yearly granularity level) on the X-axis
     * A
       *numeric* column (values in this column must be stored as an integer, floating decimal, or fixed decimal data type) on the Y-axis
     * No
       `Series` column

     \*If your date column is of weekly granularity, it must follow the *YYYY* - *WW format.* For example, the second week of year 2024 would be formatted as "2024-02."

     Note that having weeks with partial or incomplete data, such as at the beginning or end of the year when only a few days fall within a given week, can lead to inaccurate forecasts.

     To address this, ensure consistent aggregation of data by either normalizing partial weeks (for example, prorating data for incomplete weeks) or excluding them from your DataSet.
   </Warning>

The
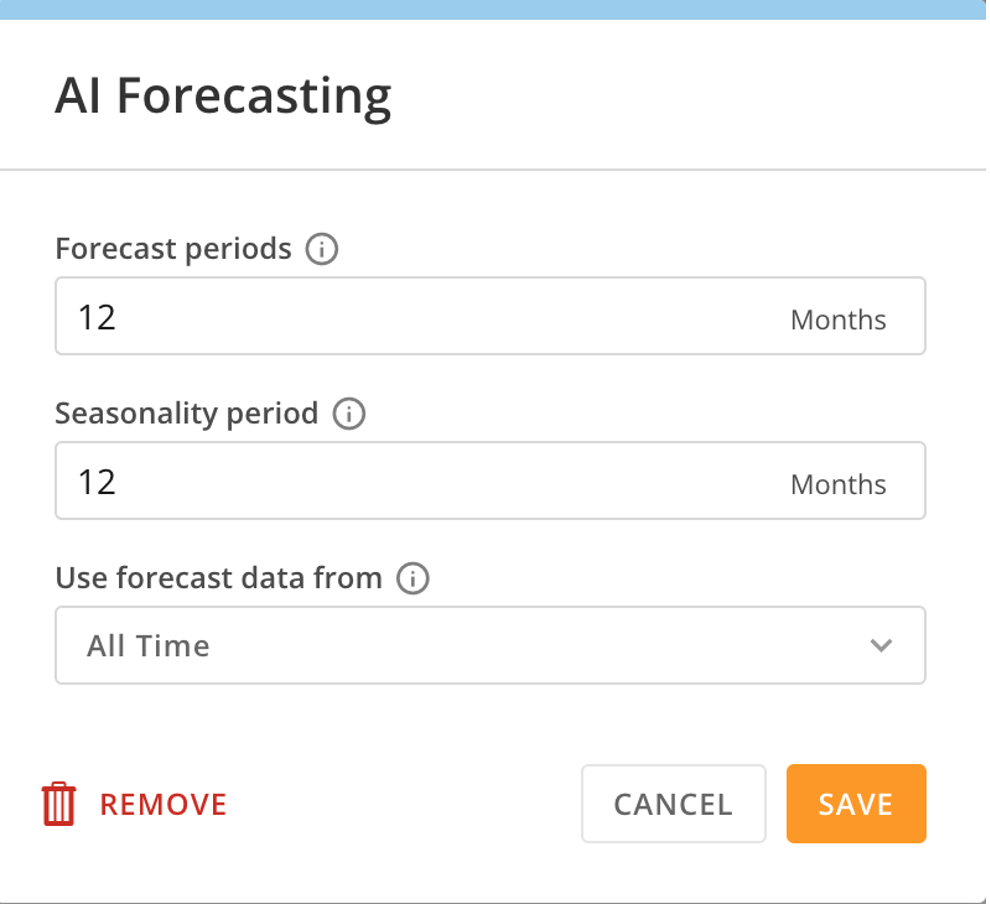
**AI Forecasting** modal opens, containing various forecasting settings. Learn how to configure them in the table below.

<Frame>
  <img alt="Screenshot 2024-10-24 at 3.54.30 PM.png" src="https://mintcdn.com/domoinc-openapi-sync-dataflows/EtHMjR0Dwu423b1z/images/kb/ka0Vq0000004swH-00N5w00000Ri7BU-0EMVq000003R4nO.jpg?fit=max&auto=format&n=EtHMjR0Dwu423b1z&q=85&s=02ead4844262e08d1b3408ffcd1a5bc3" style={{width: 400, height: 368}} width="990" height="912" data-path="images/kb/ka0Vq0000004swH-00N5w00000Ri7BU-0EMVq000003R4nO.jpg" />
</Frame>

5. After configuring your settings, save them and close the app.
6. Open the app in view mode.
7. Locate the card and select **Generate AI Forecast**.

   <Frame>
     <img alt="generate ai forecast.jpg" src="https://mintcdn.com/domoinc-openapi-sync-dataflows/EtHMjR0Dwu423b1z/images/kb/ka0Vq0000004swH-00N5w00000Ri7BU-0EMVq000003R4Ij.jpg?fit=max&auto=format&n=EtHMjR0Dwu423b1z&q=85&s=edeeabfb985b7f88614c1f5115af92e9" style={{width: 900, height: 429}} width="2326" height="1108" data-path="images/kb/ka0Vq0000004swH-00N5w00000Ri7BU-0EMVq000003R4Ij.jpg" />
   </Frame>

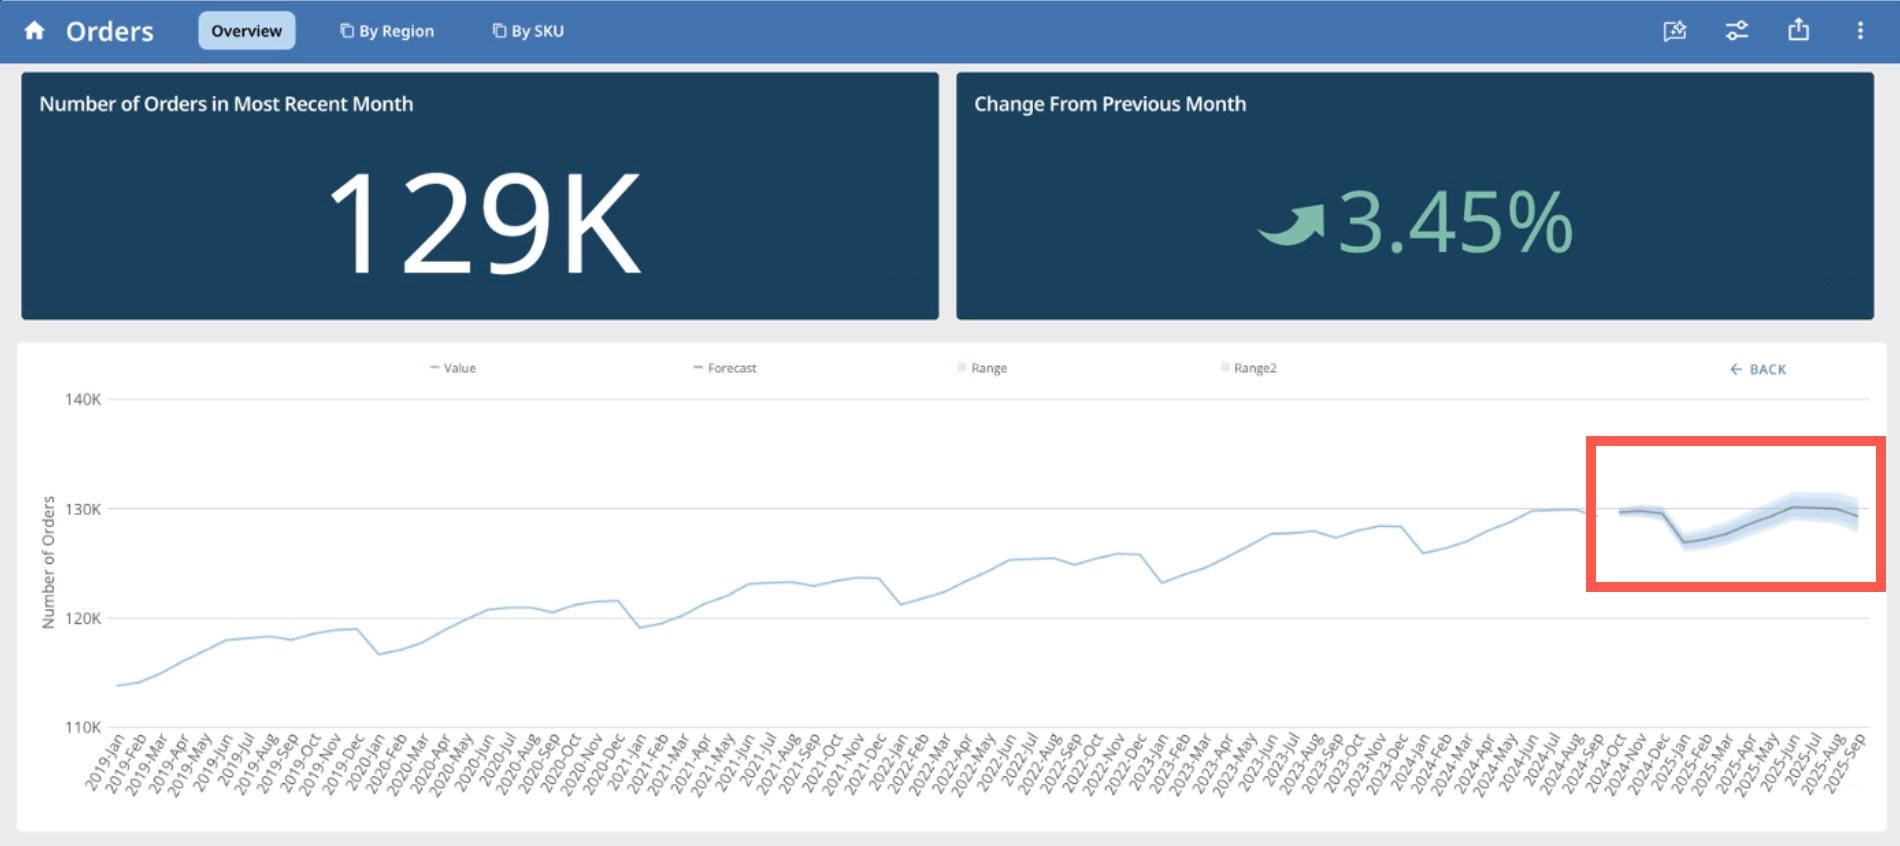
   After a few seconds, the forecast should appear on the card.
   <Frame>
     <img alt="forecast callout.jpg" src="https://mintcdn.com/domoinc-openapi-sync-dataflows/EtHMjR0Dwu423b1z/images/kb/ka0Vq0000004swH-00N5w00000Ri7BU-0EMVq000003Qxii.jpg?fit=max&auto=format&n=EtHMjR0Dwu423b1z&q=85&s=394a540bbeecea11111711b1d298e5f8" style={{width: 900, height: 401}} width="1900" height="846" data-path="images/kb/ka0Vq0000004swH-00N5w00000Ri7BU-0EMVq000003Qxii.jpg" />
   </Frame>

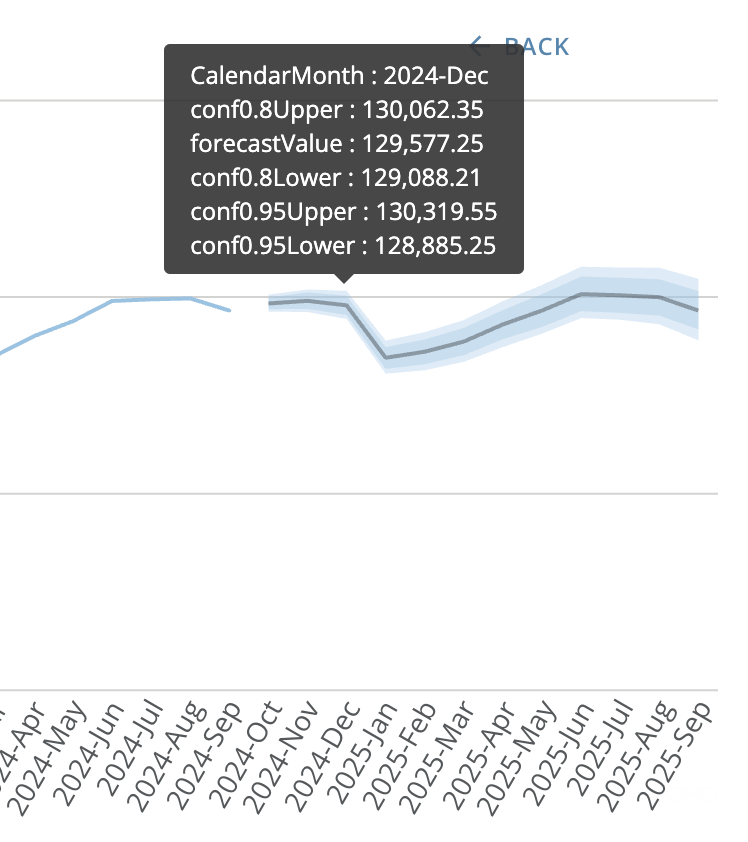
   You can interpret the forecast as follows:

* **Value (blue line) —** Data points from the numeric column displayed on the Y-axis; the forecast is based on patterns or trends in this data.
* **Forecast (gray line) and forecastValue —** Predicted data points by the Forecasting Universal Model; these points are equal to the average of the most probable potential results.
* **Range (darker blue shading) —** A narrower range of probable potential results; we are 80% confident that the actual data points will fall within this range.
* **Range2 (lighter blue shading) —** A wider range of probable potential results; we are 95% confident that the actual data points will fall within this range.
* **Conf0.8Upper —** Data point that corresponds to the upper bound (such as the largest value) of the range.
* **Conf0.8Lower —** Data point that corresponds to the lower bound (such as the smallest value) of the range.
* **Conf0.9Upper —** Data point that corresponds to the upper bound (such as the largest value) of the Range2.
* **Conf0.9Lower —** Data point that corresponds to the lower bound (such as the smallest value) of the Range2.
<Frame>
  <img alt="A screenshot of a graphDescription automatically generated" src="https://mintcdn.com/domoinc-openapi-sync-dataflows/EtHMjR0Dwu423b1z/images/kb/ka0Vq0000004swH-00N5w00000Ri7BU-0EMVq0000034vfW.jpg?fit=max&auto=format&n=EtHMjR0Dwu423b1z&q=85&s=39af9fce7759388aafaa008c732c1e93" style={{width: 278, height: 313}} width="748" height="842" data-path="images/kb/ka0Vq0000004swH-00N5w00000Ri7BU-0EMVq0000034vfW.jpg" />
</Frame>

<Tip>
  **Tip:** Learn more about forecasting in our [resources](#resources) above.
</Tip>

#### Table of Forecast Settings

This table describes how to configure the settings in the **AI Forecasting** modal.

<Frame>
  <img alt="Screenshot 2024-10-24 at 3.54.30 PM.png" src="https://mintcdn.com/domoinc-openapi-sync-dataflows/EtHMjR0Dwu423b1z/images/kb/ka0Vq0000004swH-00N5w00000Ri7BU-0EMVq000003R4nO.jpg?fit=max&auto=format&n=EtHMjR0Dwu423b1z&q=85&s=02ead4844262e08d1b3408ffcd1a5bc3" style={{width: 400, height: 368}} width="990" height="912" data-path="images/kb/ka0Vq0000004swH-00N5w00000Ri7BU-0EMVq000003R4nO.jpg" />
</Frame>

<table border="1" cellpadding="1" cellspacing="1" data-aura-rendered-by="33:207;a"><thead><tr><th colspan="1" rowspan="1"><p> Setting </p></th><th colspan="1" rowspan="1"><p> Description </p></th><th colspan="1" rowspan="1"><p> Recommendations </p></th></tr></thead><tbody><tr><td colspan="1" rowspan="1"><p> Forecast periods </p></td><td colspan="1" rowspan="1"><p> Enter the number of time intervals you want to forecast. </p><p> For example, if your date column on the X-axis is measured in days and you would like to receive a forecast for the next two weeks, you would enter 14. </p><p><b> Note: </b> The number you use should be an integer (whole numbers, no decimals) that is greater than or equal to one (1). </p><p><b> Default value: </b> The default value displayed is based on the time frequency of your date column on the X-axis. </p><ul><li> If your date column is measured in days, the default value is seven. </li><li> If your date column is measured in weeks, the default value is four. </li><li> If your date column is measured in months, the default value is 12. <a id="seasonality" target="_blank" /></li><li> If your date column is measured in quarters, the default value is four. </li></ul></td><td colspan="1" rowspan="1"><p> — </p></td></tr><tr><td colspan="1" rowspan="1"><p> Seasonality period </p></td><td colspan="1" rowspan="1"><p> Seasonality is a repeating pattern that occurs in your data at a fixed frequency (every hour, day, week, or month). </p><p> Enter an integer (a whole number, no decimals) that is greater than or equal to 1 that represents the seasonality that you want the forecast to take into account. </p><p> For example, if you have daily sales data and tend to observe higher sales on weekdays than weekends, your data exhibits weekly seasonality and you would set the <b> seasonality period </b> to 7. </p><p> However, if you have daily sales data and generally observe higher sales at the beginning and end of the month compared to the middle of the month, then your data exhibits monthly seasonality and you would set the <b> seasonality period </b> to 30. </p><p> The next column contains recommendations for how to set the seasonality based on the time frequency of your date column on the X-axis. </p><p><b> Default value: </b> The default value displayed is based on the time-frequency of your date column on the X-axis. If your date column is measured in days, the default value equals 7. If your date column is measured in weeks, the default value equals 4, and so on. </p></td><td colspan="1" rowspan="1"><ul><li><b> Daily Data </b><ul><li> Weekly seasonality (a reoccurring pattern for every seven days): set your seasonality period to 7. </li><li> Monthly seasonality (reoccurring pattern every thirty days): set your seasonality period to 30. </li><li> Annual seasonality (reoccurring pattern every 365 days): set your seasonality period to 365. </li></ul></li><li><b> Weekly Data </b><ul><li> Weekly seasonality (a reoccurring pattern every four weeks): set your seasonality period to 4. </li><li> Quarterly seasonality (a reoccurring pattern every thirteen weeks): set your seasonality period to 13. </li><li> Annual seasonality (a reoccurring pattern every fifty-two weeks): set your seasonality period to 52. </li></ul></li><li><b> Monthly Data </b><ul><li> Quarterly seasonality (a reoccurring pattern every three months): set your seasonality period to 3. </li><li> Annual seasonality (a reoccurring pattern every twelve months): set your seasonality period to 12. </li></ul></li><li><b> Quarterly Data </b><ul><li> Annual seasonality (a reoccurring pattern every four quarters): set the seasonality period to 4. </li></ul></li><li><b> Yearly Data </b><ul><li> If your data exhibits a reoccurring pattern every X years (such as 1, 2, 3...), set the seasonality period to X. </li></ul></li></ul><p /><p><b> If you want your forecast to account for no seasonality, set the seasonality period to 1. </b></p></td></tr><tr><td colspan="1" rowspan="1"><p> Use forecast data from </p></td><td colspan="1" rowspan="1"><p> The Forecasting Universal Model generates a forecast based on patterns or trends detected in the Y-axis column. Select the time period in the Y-axis column for which you would like the model to consider data. </p></td><td colspan="1" rowspan="1"><p> Use the following dropdown options to specify the time period: </p><ul><li><b> All Time — </b> This option results in all Y-axis column data in your DataSet to be considered by the model. This is the default option. </li><li><b> Current </b><b> — </b> Select the current time period, such as a quarter, that you want the model to consider. If you choose quarter, the model considers the Y-axis column data from the current 3-month period. </li><li><b> Previous </b><b> — </b> Select the previous time period, such as a month, that you want the model to consider. If you choose month, the model considers the Y-axis column data from the last 30 days. <a id="edit_forecast" target="_blank" /></li><li><b> Next — </b> Select the next time period, such as a week, that you want the model to consider. If you choose week, the model considers the Y-axis column data for the next 7 days. </li></ul></td></tr></tbody></table>

# Edit the Forecast

To edit the configuration for a forecast that has been added to a card and is embedded in a Domo app, follow these steps:

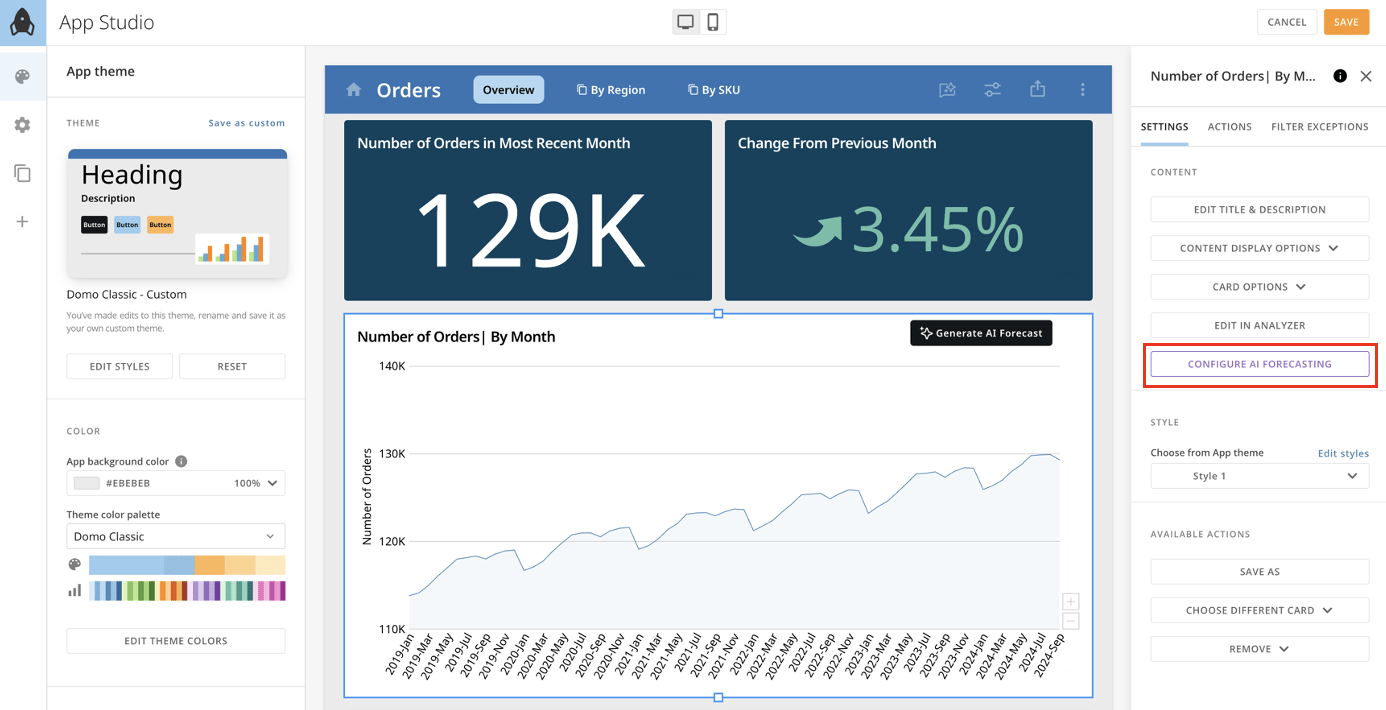
1. [Open the app](#generated_step_onetwo) in App Studio edit mode and select the card containing the forecast to open the right configuration panel.
2. In the **Settings** tab of the configuration panel, select **Configure AI Forecast**.

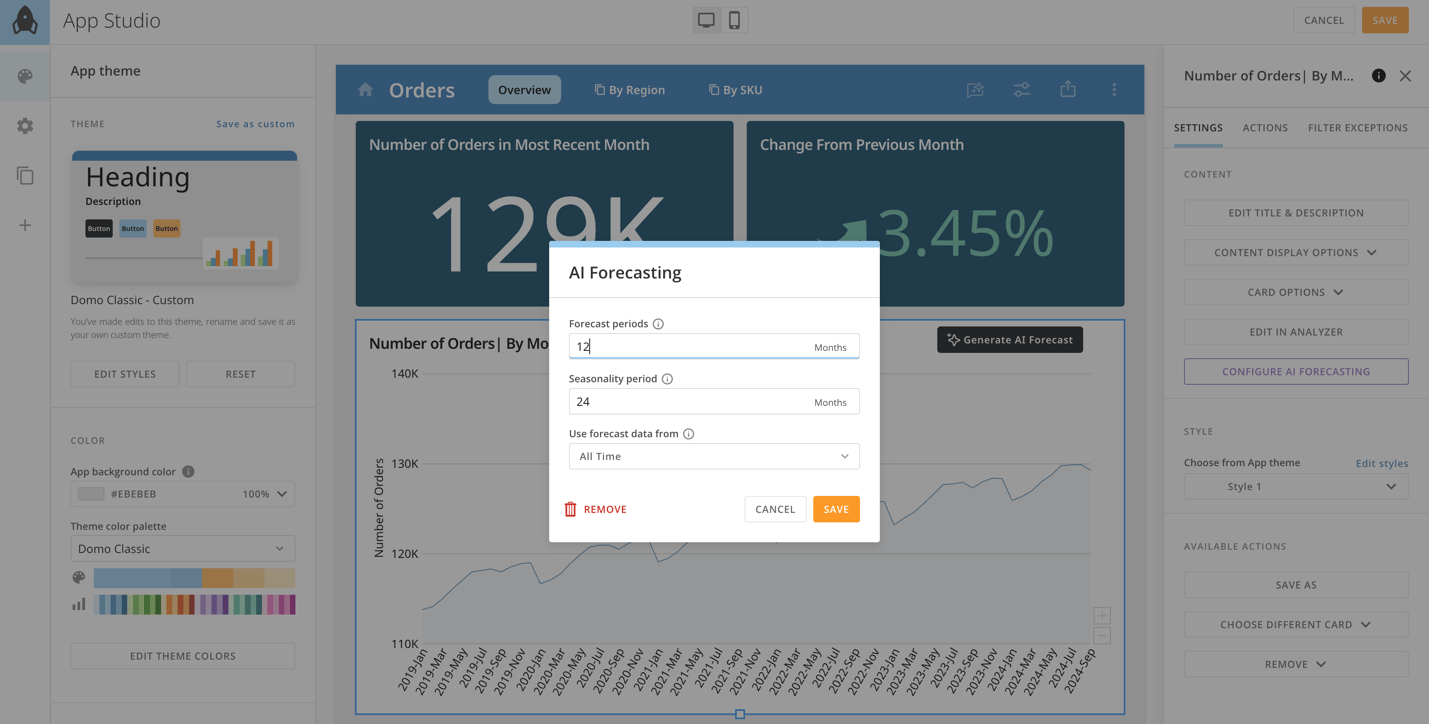
   The **AI Forecasting** modal displays.

   <Frame>
     <img src="https://mintcdn.com/domoinc-openapi-sync-dataflows/EtHMjR0Dwu423b1z/images/kb/ka0Vq0000004swH-00N5w00000Ri7BU-0EMVq0000032iPq.jpg?fit=max&auto=format&n=EtHMjR0Dwu423b1z&q=85&s=3b3c17e92560dd28b3a13fdc017dd37c" style={{width: 900, height: 460}} width="1386" height="710" data-path="images/kb/ka0Vq0000004swH-00N5w00000Ri7BU-0EMVq0000032iPq.jpg" />
   </Frame>
3. Makes edits to the
   [settings](#table_forecast_settings).

   After saving your changes, the updated forecast displays on the card.
   <Frame>
     <img src="https://mintcdn.com/domoinc-openapi-sync-dataflows/EtHMjR0Dwu423b1z/images/kb/ka0Vq0000004swH-00N5w00000Ri7BU-0EMVq0000032r9l.jpg?fit=max&auto=format&n=EtHMjR0Dwu423b1z&q=85&s=2c99b8ebf4df19e0a75b56c8219ee56a" style={{width: 895, height: 452}} width="1429" height="724" data-path="images/kb/ka0Vq0000004swH-00N5w00000Ri7BU-0EMVq0000032r9l.jpg" />
   </Frame>

# Remove the Forecast

To remove a forecast that has been added to a card embedded in a Domo app, follow these steps:

1. [Open the app](#generated_step_onetwo) in App Studio edit mode and select the card containing the forecast to open the right configuration panel.
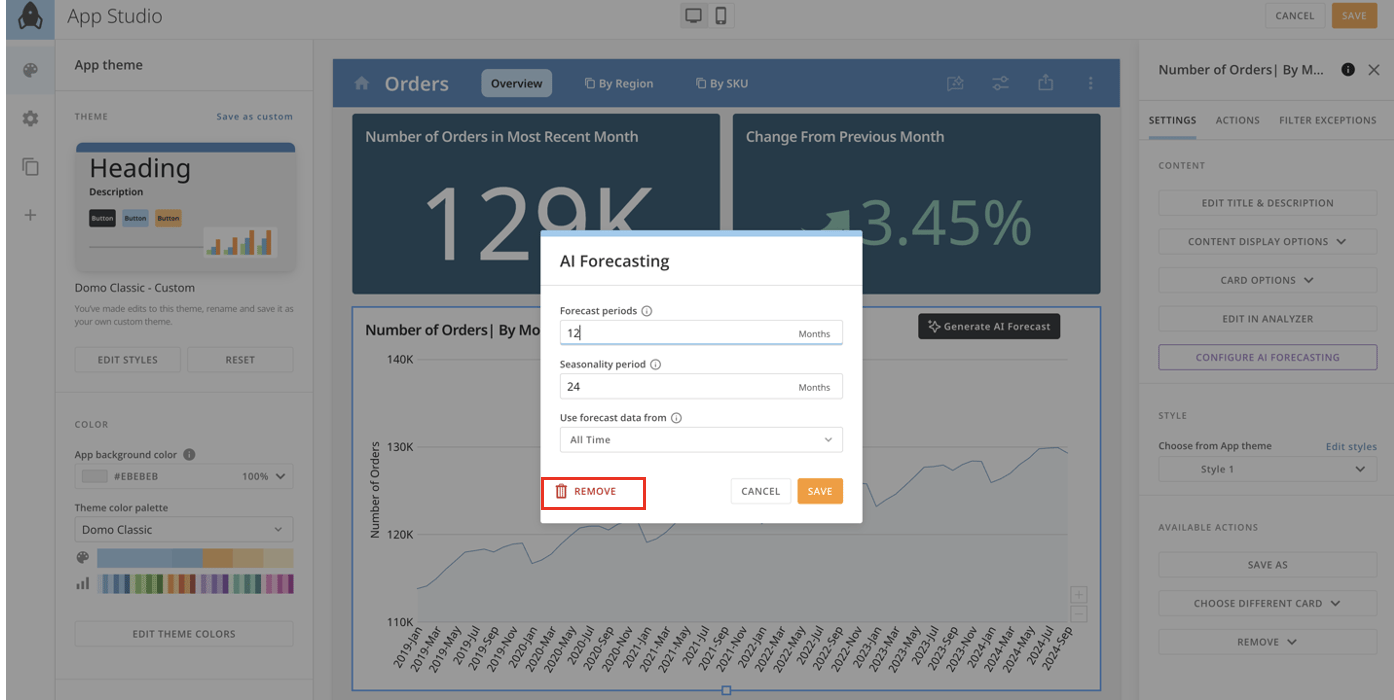
2. In the **Settings** tab of the configuration panel, select **Configure AI Forecast**. The **AI Forecasting** modal displays.

   <Frame>
     <img src="https://mintcdn.com/domoinc-openapi-sync-dataflows/EtHMjR0Dwu423b1z/images/kb/ka0Vq0000004swH-00N5w00000Ri7BU-0EMVq0000032iPq.jpg?fit=max&auto=format&n=EtHMjR0Dwu423b1z&q=85&s=3b3c17e92560dd28b3a13fdc017dd37c" style={{width: 884, height: 452}} width="1386" height="710" data-path="images/kb/ka0Vq0000004swH-00N5w00000Ri7BU-0EMVq0000032iPq.jpg" />
   </Frame>
3. In the modal, select **Remove**.

   After saving your changes, the option to **Generate AI Forecast** is removed from the card.
   <Frame>
     <img src="https://mintcdn.com/domoinc-openapi-sync-dataflows/EtHMjR0Dwu423b1z/images/kb/ka0Vq0000004swH-00N5w00000Ri7BU-0EMVq0000032s4D.jpg?fit=max&auto=format&n=EtHMjR0Dwu423b1z&q=85&s=e7933a7f2c577d4730387fd206a840b7" style={{width: 893, height: 448}} width="1394" height="700" data-path="images/kb/ka0Vq0000004swH-00N5w00000Ri7BU-0EMVq0000032s4D.jpg" />
   </Frame>

### Use the Forecasting Service in Domo. AI Playground

You can try out various configurations of the Forecasting Universal Model and compare the resulting outputs via the Forecasting Service in Domo. AI Playground. From the Forecasting Service, you can also extract the cURL code that generates the forecast and use the code in other settings, like interacting with an API.
<Tip>
  **Tip:** Check out our [forecasting resources](#resources). If you have other questions, see the [FAQ](#faq).
</Tip>

# Access the Forecasting Service

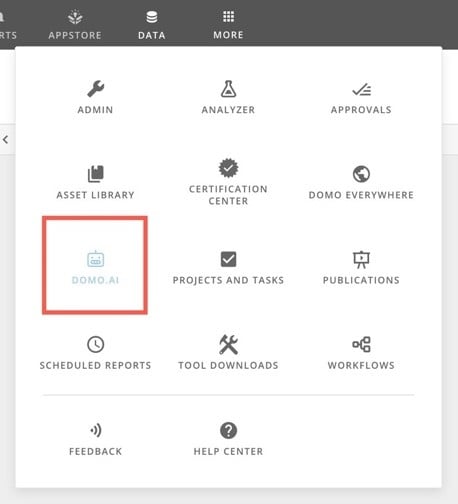
Access the Forecasting Service in Domo. AI Playground from the navigation by selecting **More** > **Domo. AI**.

<Frame>
  <img alt="A screenshot of a computerDescription automatically generated" src="https://mintcdn.com/domoinc-openapi-sync-dataflows/EtHMjR0Dwu423b1z/images/kb/ka0Vq0000004swH-00N5w00000Ri7BU-0EMVq0000032trV.jpg?fit=max&auto=format&n=EtHMjR0Dwu423b1z&q=85&s=e1b7dbcd837969337c11411afc137fc5" style={{width: 239, height: 263}} width="458" height="504" data-path="images/kb/ka0Vq0000004swH-00N5w00000Ri7BU-0EMVq0000032trV.jpg" />
</Frame>

In the left sidebar, select <InlineImage src="/images/kb/ka0Vq0000005PU1-00N5w00000Ri7BU-0EMVq0000032tuj.jpg" /> **Playground**.

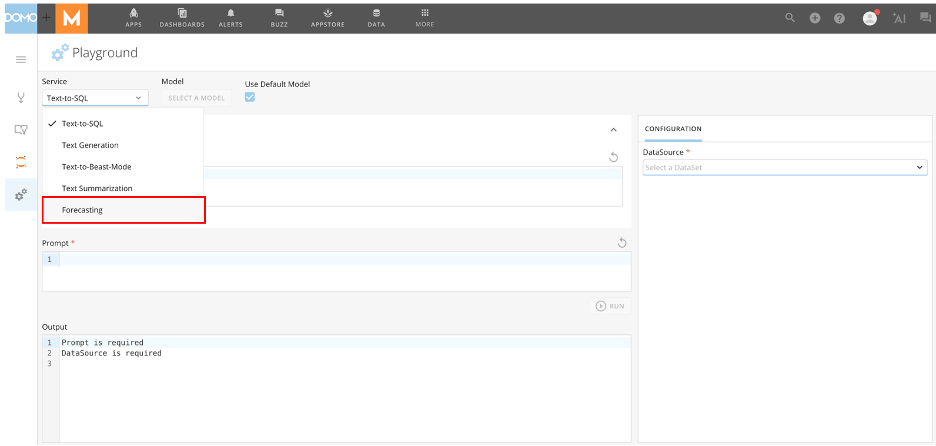
In the **Service** dropdown, choose **Forecasting**.

<Frame>
  <img alt="A screenshot of a computerDescription automatically generated" src="https://mintcdn.com/domoinc-openapi-sync-dataflows/EtHMjR0Dwu423b1z/images/kb/ka0Vq0000004swH-00N5w00000Ri7BU-0EMVq0000032tzZ.jpg?fit=max&auto=format&n=EtHMjR0Dwu423b1z&q=85&s=97cea32981b7ea4f3126ce591d3c0ed9" style={{width: 899, height: 429}} width="936" height="446" data-path="images/kb/ka0Vq0000004swH-00N5w00000Ri7BU-0EMVq0000032tzZ.jpg" />
</Frame>

# Use the Forecasting Service

To test various configurations of the Forecasting Universal Model via the Forecasting Service and compare to the resulting forecasting output, you must have the [required grants](#required_grants) enabled and follow these steps:

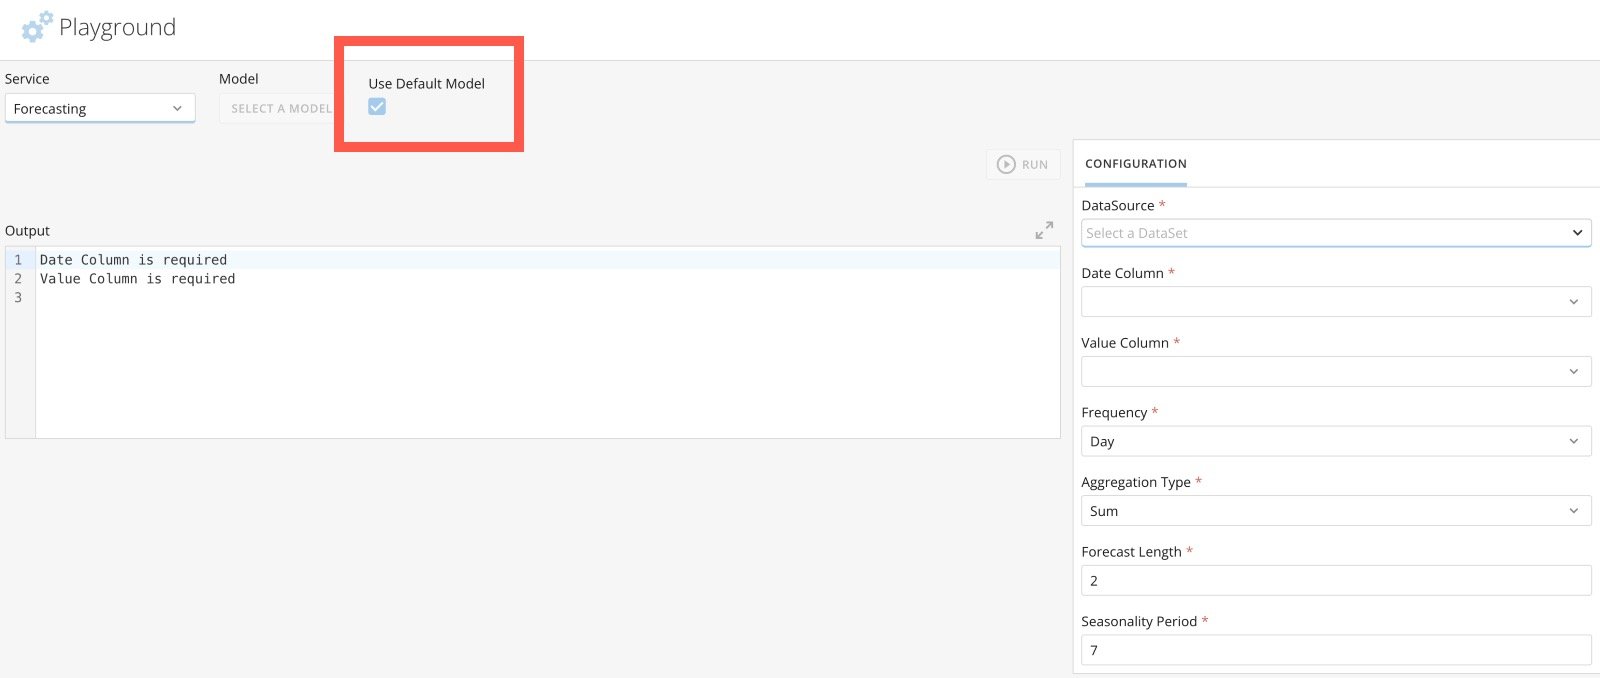
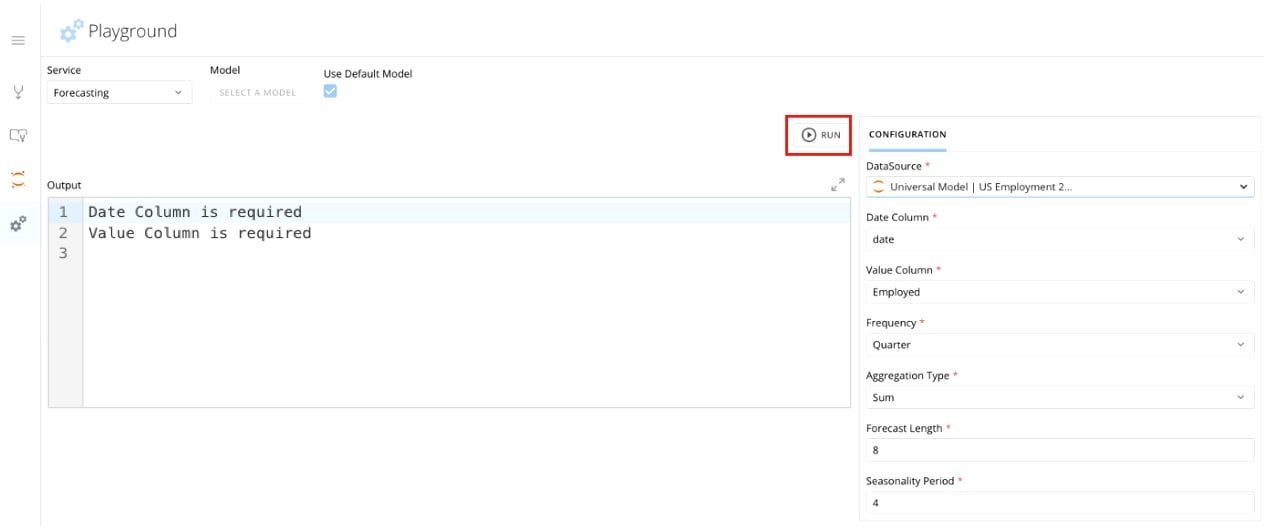
1. Configure the forecasting settings in the **Configuration** pane. The table below describes the configuration settings.
   <Note>
     **Note:**

     When the checkbox labeled **Use Default Model** is marked, a default Forecasting Universal Model is automatically selected for use with the Forecast Service.  The default Forecasting Universal Model is an ARIMA (AutoRegressive Integrated Moving Average) model. An ARIMA model is a forecasting method that combines autoregression and differencing to make the data stationary and a moving average of past forecast errors. Data scientists commonly use ARIMA models for forecasting. Learn how to [change the default Forecasting Universal Model](#change_default_model).
   </Note>

   <Frame>
     <img alt="use default panel.jpg" src="https://mintcdn.com/domoinc-openapi-sync-dataflows/EtHMjR0Dwu423b1z/images/kb/ka0Vq0000004swH-00N5w00000Ri7BU-0EMVq000003Vz0f.jpg?fit=max&auto=format&n=EtHMjR0Dwu423b1z&q=85&s=d182a959fb54264ddb8f75eea667567e" style={{width: 899, height: 381}} width="1600" height="678" data-path="images/kb/ka0Vq0000004swH-00N5w00000Ri7BU-0EMVq000003Vz0f.jpg" />
   </Frame>

   <table border="1" cellpadding="1" cellspacing="1"><thead><tr><th colspan="1" rowspan="1"><p> Settings </p></th><th colspan="1" rowspan="1"><p> Description </p></th><th colspan="1" rowspan="1"><p> Recommendations </p></th></tr></thead><tbody><tr><td colspan="1" rowspan="1"><p> DataSource </p></td><td colspan="1" rowspan="1"><p> Select the DataSet to use for forecasting. The DataSet you select needs to have one date column and one numeric column in order to configure subsequent options. </p></td><td colspan="1" rowspan="1"><p> — </p></td></tr><tr><td colspan="1" rowspan="1"><p> Date Column </p></td><td colspan="1" rowspan="1"><p> Select the date column that identifies the date interval corresponding to each row in your DataSet. Values in this column must be stored as a date or time-stamp data type and must also be at the daily, weekly, monthly, quarterly, or yearly granularity level. If you have selected a DataSource, all available data columns with date or time-stamp data types are listed. </p></td><td colspan="1" rowspan="1"><p> — </p></td></tr><tr><td colspan="1" rowspan="1"><p> Value Column </p></td><td colspan="1" rowspan="1"><p> Select the numeric column of data to forecast. Values in this column must be stored as an integer, floating decimal, or fixed decimal data type. If you have selected a DataSource, all available numeric data columns that are an integer, floating decimal, or fixed decimal data type are listed. </p></td><td colspan="1" rowspan="1"><p> — </p></td></tr><tr><td colspan="1" rowspan="1"><p> Frequency </p></td><td colspan="1" rowspan="1"><p> Select the time frequency to forecast. </p></td><td colspan="1" rowspan="1"><p> — </p></td></tr><tr><td colspan="1" rowspan="1"><p> Aggregation Type </p></td><td colspan="1" rowspan="1"><p> Select the aggregation that should be applied to the Value Column (numeric column of the data you want to forecast). </p><p> If the data in the Value Column is measured simultaneously as the frequency you'd like to forecast (<em> ex., </em> you have daily data and want to forecast at the daily level), select <b> Average </b> (this does not aggregate your data). </p><p> If the data in the Value column is not measured at the same time frequency as you'd like to forecast (<em> ex., </em> you have daily data and want to forecast at the monthly level), select how your data should be aggregated to the level you would like to forecast at. For example, if you have daily revenue data and would like to forecast monthly revenue, set the <b> Frequency </b> to "Month" and <b> Aggregation Type </b> to "Sum." </p></td><td colspan="1" rowspan="1"><p> — </p></td></tr><tr><td colspan="1" rowspan="1"><p> Forecast Length </p></td><td colspan="1" rowspan="1"><p> Select or input the number of time intervals you want to forecast. <a id="seasonality_period" target="_blank" /> For example, if you select the <b> Day </b> option for the <b> Frequency </b> setting and want to receive a forecast for the next two weeks, enter 14 for the Forecast Length. The number you input should be an integer (whole number, no decimals) that is greater than or equal to 1. </p></td><td colspan="1" rowspan="1"><p> — </p></td></tr><tr><td colspan="1" rowspan="1"><p> Seasonality Period </p></td><td colspan="1" rowspan="1"><p> Input the number of seasonality periods you would like the forecast to take into consideration. The input should be an integer (whole number, no decimals) that is greater than or equal to one. </p><p> Seasonality refers to a repeating pattern that occurs in your data at a fixed frequency (ex., every hour, day, week, or month). For example, if you have daily sales data and tend to observe higher sales on weekdays than weekends, your data exhibits weekly seasonality and should set your Seasonality Period to seven. </p></td><td colspan="1" rowspan="1"><ul><li><b> Daily Data </b><ul><li> Weekly seasonality (a reoccurring pattern for every seven days): set your seasonality period to 7. </li><li> Monthly seasonality (reoccurring pattern every thirty days): set your seasonality period to 30. </li><li> Annual seasonality (reoccurring pattern every 365 days): set your seasonality period to 365. </li><li> For no seasonality, set the period to 1. </li><li> The seasonality period is set to 7 if the Frequency = Day. </li></ul></li><li><b> Weekly Data </b><ul><li> Weekly seasonality (a reoccurring pattern every four weeks): set your seasonality period to 4. </li><li> Quarterly seasonality (a reoccurring pattern every thirteen weeks): set your seasonality period to 13. </li><li> Annual seasonality (a reoccurring pattern every fifty-two weeks): set your seasonality period to 52. </li><li> For no seasonality, set the period to 1. </li><li> The seasonality period is set to 1 if the Frequency = Week. </li></ul></li><li><b> Monthly Data </b><ul><li> Quarterly seasonality (a reoccurring pattern every three months): set your seasonality period to 3. </li><li> Annual seasonality (a reoccurring pattern every twelve months): set your seasonality period to 12. </li><li> For no seasonality, set the period to 1. </li><li> The seasonality period is set to 12 if the Frequency = Day. </li></ul></li><li><b> Quarterly Data </b><ul><li> Annual seasonality (a reoccurring pattern every four quarters): set the seasonality period to 4. </li><li> For no seasonality, set the period to 1. </li><li> The seasonality period is set to 4 if the Frequency = Quarterly. </li></ul></li><li><b> Yearly Data </b><ul><li> If your data exhibits a reoccurring pattern every X years (such as 1, 2, 3..., set the seasonality period to X. </li><li> For no seasonality, set the period to one. </li><li> The seasonality period is set to one if the Frequency = Yearly. </li></ul></li></ul></td></tr></tbody></table>

2. After configuring your settings in the **Configuration** pane, select **Run** to generate the forecast.

   Forecast results are displayed in the **Output** pane.

<Frame>
  <img alt="run forecast in playground.jpg" src="https://mintcdn.com/domoinc-openapi-sync-dataflows/EtHMjR0Dwu423b1z/images/kb/ka0Vq0000004swH-00N5w00000Ri7BU-0EMVq000003UWTl.jpg?fit=max&auto=format&n=EtHMjR0Dwu423b1z&q=85&s=20c72a52a310a7ee76a2d47561d4ad76" style={{width: 900, height: 375}} width="1267" height="528" data-path="images/kb/ka0Vq0000004swH-00N5w00000Ri7BU-0EMVq000003UWTl.jpg" />
</Frame>

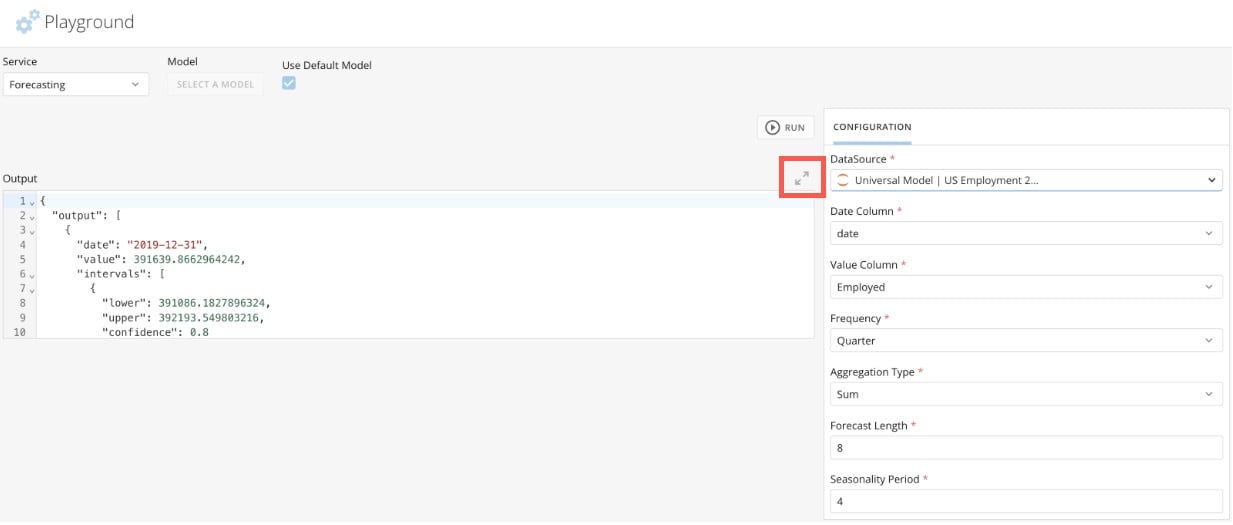
3. (Optional) Expand the
   **Output** pane by selecting <InlineImage src="/images/kb/ka0Vq0000005PU1-00N5w00000Ri7BU-0EMVq0000034prq.jpg" /> **Expand**.
<Frame>
  <img alt="expand.jpg" src="https://mintcdn.com/domoinc-openapi-sync-dataflows/EtHMjR0Dwu423b1z/images/kb/ka0Vq0000004swH-00N5w00000Ri7BU-0EMVq000003UWOv.jpg?fit=max&auto=format&n=EtHMjR0Dwu423b1z&q=85&s=361a037c20ad5a5ef7b5755d731dd93b" style={{width: 900, height: 383}} width="1233" height="525" data-path="images/kb/ka0Vq0000004swH-00N5w00000Ri7BU-0EMVq000003UWOv.jpg" />
</Frame>

# Interpret Forecast Results

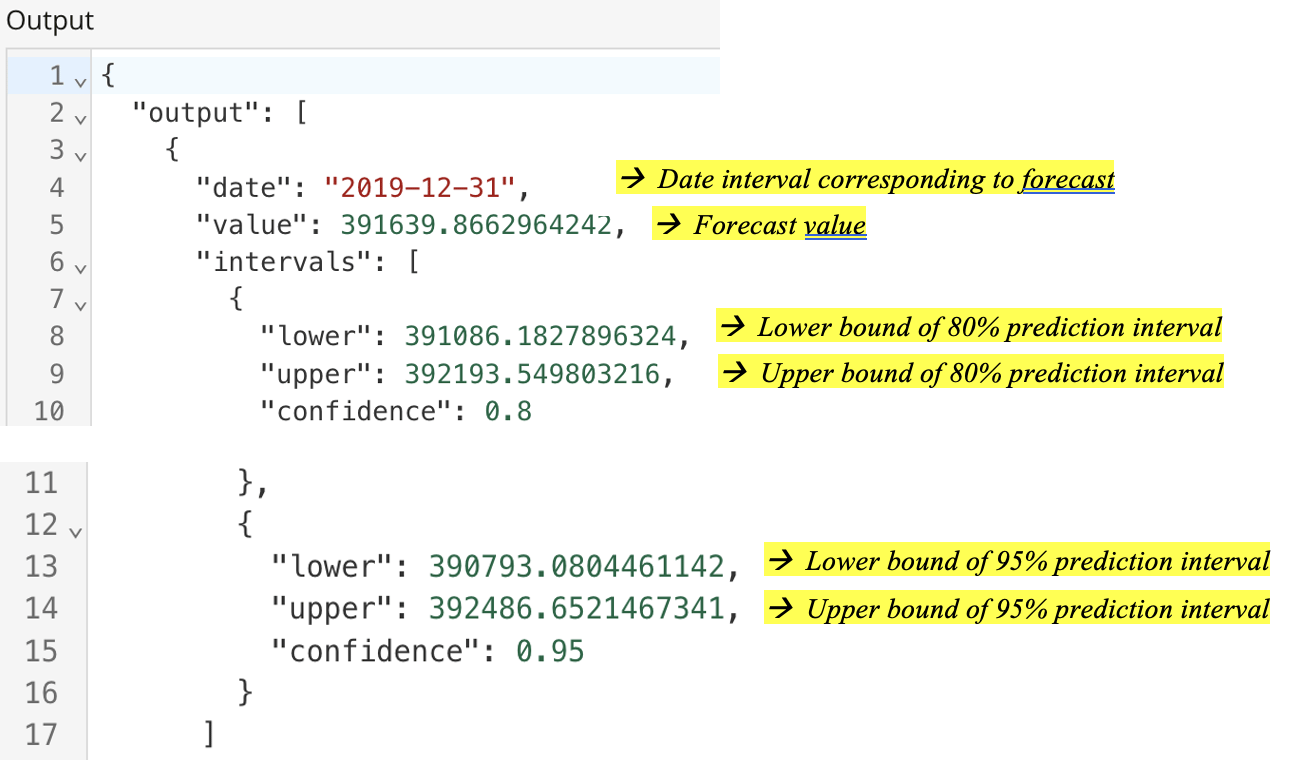
The forecast results can be interpreted as follows (see highlighted text). You receive this information for each time point of your forecast in the **O** **utput** pane.
<Frame>
  <img alt="A screenshot of a computerDescription automatically generated" src="https://mintcdn.com/domoinc-openapi-sync-dataflows/EtHMjR0Dwu423b1z/images/kb/ka0Vq0000004swH-00N5w00000Ri7BU-0EMVq0000033ZKT.jpg?fit=max&auto=format&n=EtHMjR0Dwu423b1z&q=85&s=3f8242ba464066ae2420981c2349245b" style={{width: 624, height: 368}} width="1306" height="770" data-path="images/kb/ka0Vq0000004swH-00N5w00000Ri7BU-0EMVq0000033ZKT.jpg" />
</Frame>

For example, if you select Forecast Length = 8 in the **Configuration** pane, you receive the forecast results for each of the eight time points forecasted.

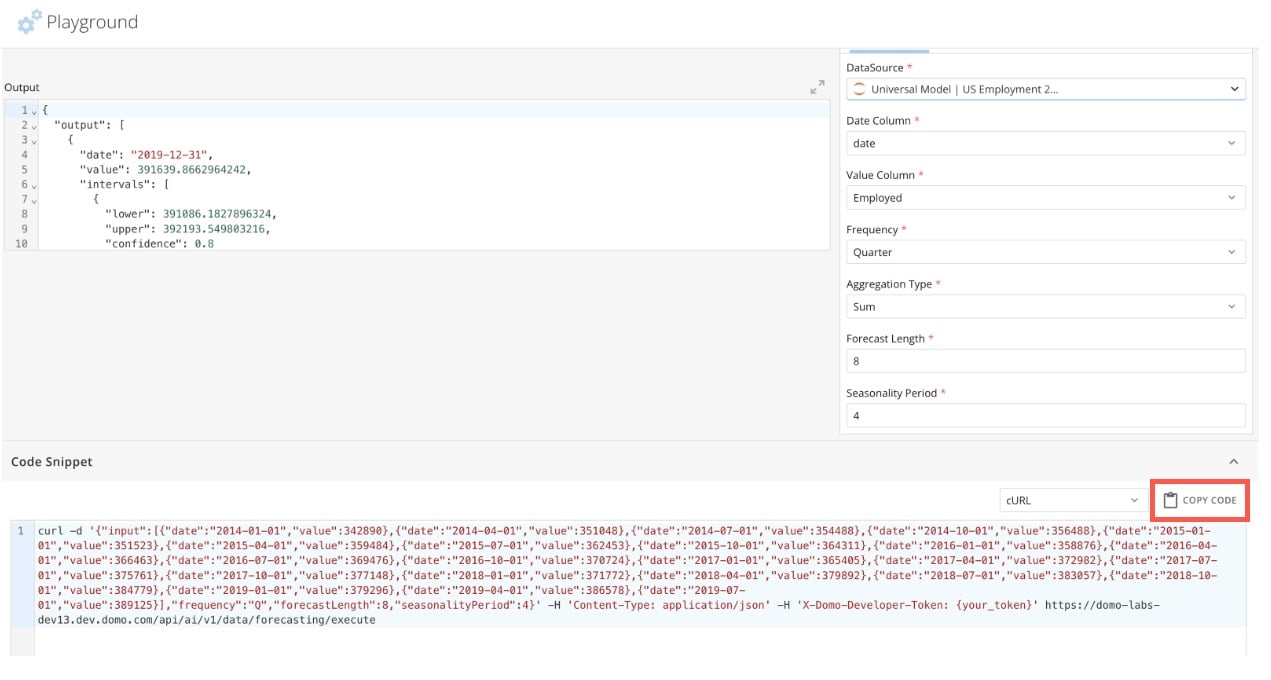
If you expand the **Code Snippet** pane, you can view the block of cURL code that generates the forecast output. You can select **Copy Code** to copy this code to your machine's clipboard and use it in other settings, such as interacting with an API.
<Frame>
  <img alt="copy code.jpg" src="https://mintcdn.com/domoinc-openapi-sync-dataflows/EtHMjR0Dwu423b1z/images/kb/ka0Vq0000004swH-00N5w00000Ri7BU-0EMVq000003UXG9.jpg?fit=max&auto=format&n=EtHMjR0Dwu423b1z&q=85&s=e9771801a973fd7d3d5292a1c85bee09" style={{width: 798, height: 427}} width="1271" height="680" data-path="images/kb/ka0Vq0000004swH-00N5w00000Ri7BU-0EMVq000003UXG9.jpg" />
</Frame>

**Note:** To regenerate the forecast based on different configurations, change the settings in the **Configuration** pane and select **Run**.

### Change the Default Forecasting Universal Model

The default Forecasting Universal Model is an ARIMA (AutoRegressive Integrated Moving Average) model. An ARIMA model is a forecasting method that combines autoregression and differencing to make the data stationary and a moving average of past forecast errors. Data scientists commonly use ARIMA models for forecasting.

The [AI Service Layer Settings](https://domo-support.domo.com/s/article/000005279?language=en_US) allow you to change the default Forecasting Universal Model to a model you built or from an external third party.

### FAQ

<AccordionGroup>
  <Accordion title="What is forecasting?">
    Forecasting is the process of predicting future outcomes based on historical data. Forecasting can help businesses and individuals make informed decisions by estimating future trends such as sales, demand, and customer behavior.
  </Accordion>

  <Accordion title="How does forecasting actually work?">
    Forecasting identifies patterns or trends in past data and applies statistical models to project those trends into the future. By analyzing past behavior, it can provide an estimate of what is likely to happen next.
  </Accordion>

  <Accordion title="What kind of data can I use to forecast?">
    Generally, you can forecast any count-based metric. For example, you can forecast financial data (revenue, sales, prices, profit), marketing data (customer churn, engagement, traffic), or operations data (employee turnover, inventory, demand).
  </Accordion>

  <Accordion title="Can I forecast without a lot of data?">
    While having more data generally improves forecast accuracy, it's still possible to create forecasts with limited data. However, the less data you have, the less confident you can be in the results.
  </Accordion>

  <Accordion title="My data lacks a clear trend or pattern. Does this impact the forecast?">
    Forecasts are generally more accurate when applied to outcomes that exhibit clear, sequential patterns (such as trends and seasonality) over time. The more consistent and observable the pattern, the better the forecast's accuracy. For random or unpredictable events like lottery events, fashion trends, or natural disasters, forecasting becomes unreliable due to the lack of a discernible pattern.
  </Accordion>

  <Accordion title="How far into the future can I forecast?">
    The further into the future you try to predict, the less accurate your forecast is likely to be. Short-term forecasts are generally more reliable because they are less likely to have unexpected changes or variables.
  </Accordion>

  <Accordion title="What is a forecast range?">
    A forecast range is a statistical interval that indicates the degree of uncertainty around a forecasted value. It provides a range within which the actual outcome is expected to fail based on a specified level of confidence (for example, 90-95%).

    Forecast ranges are important because they help quantify uncertainty in forecasts, allowing stakeholders to gauge prediction reliability. Smaller forecast ranges usually indicate greater reliability. By providing a range rather than a single value, forecast ranges facilitate better decision-making by highlighting potential risks and the likelihood of different outcomes.
  </Accordion>

  <Accordion title="Why are my forecast ranges so wide?">
    Large forecast ranges can occur for several reasons, including high variability in historical data, insufficient data points, or the presence of outliers that skew the predictions. Additionally, if the underlying model doesn't adequately capture the trends or patterns in the data, it can lead to increased uncertainty and wider ranges. To improve the precision of your forecasts, consider refining your model, increasing the amount of historical data, or addressing any anomalies in your DataSet.
  </Accordion>

  <Accordion title="What is forecast accuracy?">
    Forecast accuracy refers to how closely a forecasted value matches the actual outcome. It measures the reliability of the prediction with higher accuracy, meaning the forecast is closer to reality.
  </Accordion>

  <Accordion title="Does forecasting guarantee accurate results?">
    No, forecasting gives an estimate, not a guarantee. The accuracy depends on the quality of the data, how consistent the patterns are, and how far into the future you're trying to predict. However, good forecasts can provide valuable insights for decision-making.
  </Accordion>

  <Accordion title="How do I measure the accuracy of a forecast?">
    You can evaluate forecast accuracy by comparing your predicted values to the actual outcomes using various metrics. Two common methods include creating a forecast for a specific number of future periods and comparing it to actual results after the period ends, or withholding a set of historical observations, forecasting those dates, and then comparing the predictions to the actuals. Metrics like Mean Absolute Error (MAE) and Recall can be used to quantify the accuracy of your forecasts.

    # Forecasting Universal Model Questions
  </Accordion>

  <Accordion title="Does the Forecasting Universal Model work if there are missing or null values in my data?">
    T he model will NOT generate a forecast if there are missing or null values in the numeric column you would like to use to forecast.

    For example, if you have two years of monthly revenue data for the years 202 2 and 202 3 and revenue is missing for the row corresponding to May 202 3 (see sample sub-section of data below), the model will not be able to generate a forecast.

    <table border="1" cellpadding="1" cellspacing="1" data-aura-rendered-by="33:207;a"><thead><tr><th colspan="1" rowspan="1"><p> Date </p></th><th colspan="1" rowspan="1"><p> Revenue </p></th></tr></thead><tbody><tr><td colspan="1" rowspan="1"><p> 2023-03 </p></td><td colspan="1" rowspan="1"><p> 134,589.12 </p></td></tr><tr><td colspan="1" rowspan="1"><p> 2023-04 </p></td><td colspan="1" rowspan="1"><p> 144,567.45 </p></td></tr><tr><td colspan="1" rowspan="1"><p> 2023-05 </p></td><td colspan="1" rowspan="1"><p> NULL </p></td></tr><tr><td colspan="1" rowspan="1"><p> 2023-06 </p></td><td colspan="1" rowspan="1"><p> 154,387.98 </p></td></tr></tbody></table>

    However, if an entire row of data is miss ing, the model can generate a forecast.

    F or example, if you have two years of monthly revenue data for years 2022 and 2023 and the entire row corresponding to May 2023 is missing (see sample sub-section of data below), the model produces a foreca st. Please note that missing entire rows of data will likely affect the accuracy of your forecast.

    <table border="1" cellpadding="1" cellspacing="1" data-aura-rendered-by="33:207;a"><thead><tr><th colspan="1" rowspan="1"><p> Date </p></th><th colspan="1" rowspan="1"><p> Revenue </p></th></tr></thead><tbody><tr><td colspan="1" rowspan="1"><p> 2023-03 </p></td><td colspan="1" rowspan="1"><p> 134,589.12 </p></td></tr><tr><td colspan="1" rowspan="1"><p> 2023-04 </p></td><td colspan="1" rowspan="1"><p> 144,567.45 </p></td></tr><tr><td colspan="1" rowspan="1"><p> 2023-06 </p></td><td colspan="1" rowspan="1"><p> 154,387.98 </p></td></tr></tbody></table>
  </Accordion>

  <Accordion title="How do I know what seasonality to select when using the model?">
    For most use cases, the default seasonality is the right fit. However, there are cases in which the default seasonality is not necessarily the obvious answer.

    For example, national soccer jerseys sales spike around World Cup events, which occur every four years. The data is captured in yearly observations, but a forecast for national soccer jerseys would likely benefit from a seasonality of four to identify that there is a cyclical pattern every four years.
  </Accordion>

  <Accordion title="What factors about my data are considered in the default Forecasting Universal Model?">
    The Forecasting Universal Model utilizes ARIMA as the default algorithm. The ARIMA al gorith m considers trend (the general direction of the data), seasonality (the recurring patterns in the data), statistical properties of the data (such as the mean), autocorrelation (the relationship between data points over time), and noise (random fluctuations that do not match the general behavior of the data) when generating a forecast.
  </Accordion>

  <Accordion title="What are the limitations of the default Forecasting Universal Model?">
    The Forecasting Universal Model utilizes ARIMA as the default algorithm. While this is a popular and respected algorithm, there are limitations. For example, ARIMA assumes a linear relationship for the target variable, which may not always be the case. ARIMA, like many forecasting models, is also sensitive to outliers. T he Forecasting Universal Model also only supports univariate forecasting, which means you cannot account for external factors in a forecast (for example, weather features when forecasting amusement park attendance ).
  </Accordion>

  <Accordion title="Can I replace the default Forecasting Universal Model with one of my own models?">
    While you can't currently replace the default model, this functionality is planned. It will be available via the [AI Service Layer Settings](https://domo-support.domo.com/s/article/000005279?language=en_US).
  </Accordion>

  <Accordion title="The Forecasting Universal Model doesn't meet my needs. Can I build a customized forecasting model in Domo?">
    Yes, you can build a custom forecasting model in Domo. W e recommend using Domo’s [Jupyter Workspaces](https://domo-support.domo.com/s/article/36004740075?language=en_US#faq) to do so. Please note that you need experience with either R or Python coding languages to use Jupy t er Workspaces.

    Domo also offers consulting services with their team of experienced data scientists who can help you build a custom forecasting solution; p lease contact your Domo account team for more information.

    # Add a Forecast Card Embedded in a Domo App

    <Note>
      **Note:** Adding a forecast generated by the Forecasting Universal Model to a card embedded in a Domo app is currently in Alpha. Please be aware of the following limitations, which Domo is actively working to address:

      * When you select
        **Generate AI Forecast**, the card may go blank, and no forecast appears. If this situation occurs, it means the forecast failed to generate. Please review how you configured the forecast and try to generate it again. Error messages that describe the specific error reason are coming soon.
      * Adding a forecast to a Bar Chart Card changes the card to a Line Chart Card. The ability to display a forecast in a Bar Chart Card is coming soon.
      * Adding a forecast to a Line or Bar Chart Card results in pre-set Color Rules being applied to the card. The ability to keep pre-forecasting Color Rules applied to the card is coming soon.
      * The ability to select the color(s) of the forecasted output—forecast values and ranges—is forthcoming.

      To get help with forecasting, the Domo AI Labs team is offering one complimentary office hour. Meet with a data scientist and get your questions answered. Email [datascienceSME@domo.com](mailto:datascienceSME@domo.com) <InlineImage src="/images/kb/ka0Vq00000001FR-00N5w00000Ri7BU-0EMVq0000000XDh.jpg" /> to sign up.
    </Note>
  </Accordion>

  <Accordion title="Can I use the Forecasting Universal Model to forecast the series in the same card?">
    No, the Forecasting Universal Model does not support series-specific forecasts. To create a series in the same card, you must create a separate card for each series segment and then add a forecast with the Forecasting Universal Model.
  </Accordion>

  <Accordion title="Is the forecast output that's seen in a card saved to a Domo DataSet?">
    No. The ability to access the forecasted data points and ranges in a Domo DataSet is coming soon.
  </Accordion>

  <Accordion title="A forecast appears on my card, but it looks strange or not as expected. What could be causing this?">
    If a forecast appears strange or not as expected, several factors could be contributing to this issue, including:

    * **Missing Data —** Incomplete data can lead to inaccurate forecasts, as the model may not properly capture underlying patterns or trends. Try to i dentify and fill in missing values using techniques such as interpolation, forward/backward filling, or employing domain knowledge to estimate missing data points.

    * **Insufficient Data —** Forecasting models rely on past observations to identify trends and seasonal patterns. If you try to forecast with a DataSet that has too few rows of data, the model may lack the needed information to make accurate predictions, leading to forecasts that do not align with expected outcomes. Try to add additional rows of data to your DataSet if possible.

    * **Outliers —** Outliers are unusually high or low data points. For example, unusually low sales in April 2020 (due to the pandemic ) would be an outlier in a `Monthly Revenue` column.

      The presence of outliers can significantly impact forecasts. Identify and analyze outliers to determine if they should be removed, adjusted, or included in your DataSet. Learn how to identify and address outliers from this [presentation](https://github.com/domoinc/domo-data-science-resources/blob/main/webinars/Handling_ExtremeValues_Outliers.pdf) <InlineImage src="/images/kb/ka0Vq00000001FR-00N5w00000Ri7BU-0EMVq0000000XDh.jpg" /> by Domo data scientists.

    * **Improperly Specified** **Seasonality —** If seasonality isn't accurately specified when configuring the forecast, the model will fail to account for the true seasonal pattern in your data, resulting in a misleading forecast. **Learn about seasonality.**

    Experiencing issues? Contact [support@domo.com](mailto:support@domo.com) <InlineImage src="/images/kb/ka0Vq0000005PU1-00N5w00000Ri7BU-0EMVq000003UTR3-3.jpg" /> for assistance.
  </Accordion>
</AccordionGroup>