> ## Documentation Index
> Fetch the complete documentation index at: https://domoinc-openapi-sync-dataflows.mintlify.site/llms.txt
> Use this file to discover all available pages before exploring further.

# Data Science Charts: Correlation and Confusion Matrix

# Intro

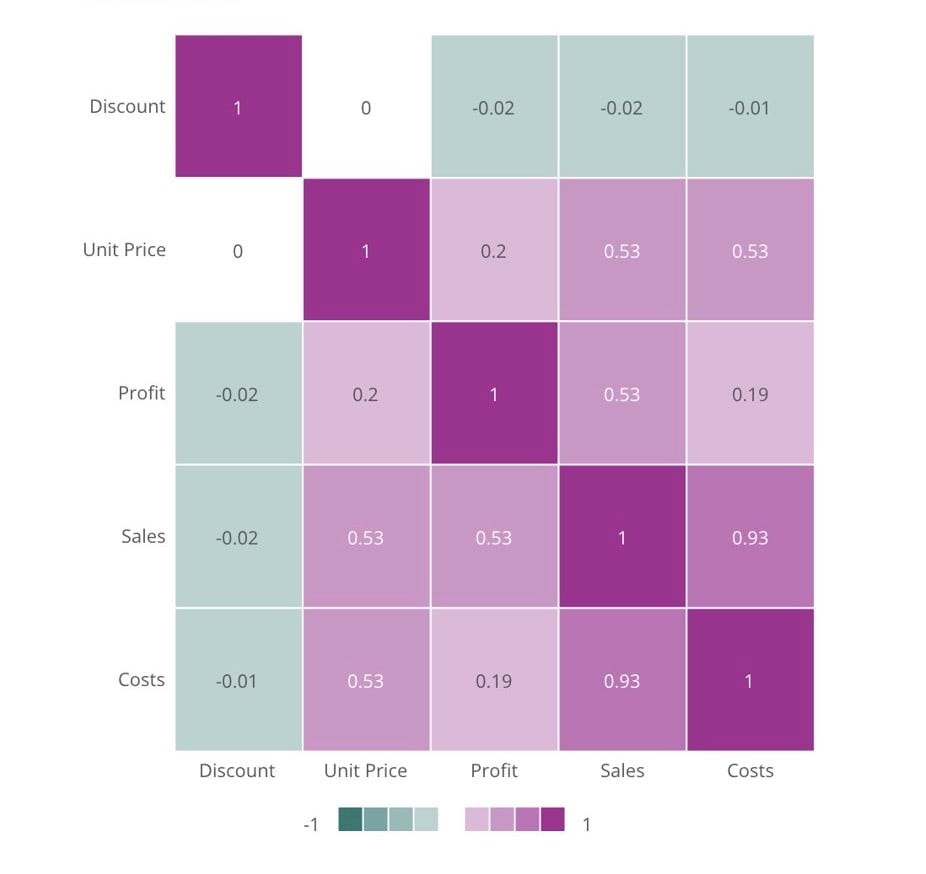
Two new Data Science charts—confusion matrix and correlation matrix—can save you time when identifying exceptions and next steps in your business analysis. A correlation matrix shows how variables in your DataSet relate to each other. Learn more about [correlation matrices](https://www.questionpro.com/blog/correlation-matrix/).  A confusion matrix summarizes the predictive performance of a machine learning classification model. Learn more about [confusion matrices](https://en.wikipedia.org/wiki/Confusion_matrix).

**Correlation Matrix**

<Frame>
  <img alt="correlation matrix.jpg" src="https://mintcdn.com/domoinc-openapi-sync-dataflows/OgxhwqPV4Aq-rsgt/images/kb/ka05w0000012BO6-00N5w00000Ri7BU-0EM5w000006w76s.jpg?fit=max&auto=format&n=OgxhwqPV4Aq-rsgt&q=85&s=c2a0973e933c041097502089ac62af88" style={{width: 436.996, height: 411.989}} width="926" height="874" data-path="images/kb/ka05w0000012BO6-00N5w00000Ri7BU-0EM5w000006w76s.jpg" />
</Frame>

**Confusion Matrix**

<Frame>
  <img alt="prediction v actual example.jpg" src="https://mintcdn.com/domoinc-openapi-sync-dataflows/OgxhwqPV4Aq-rsgt/images/kb/ka05w0000012BO6-00N5w00000Ri7BU-0EM5w000006w9HJ.jpg?fit=max&auto=format&n=OgxhwqPV4Aq-rsgt&q=85&s=c27670d9da2fdff8d71d7c8aad97dbbe" style={{width: 514.993, height: 348.999}} width="2128" height="1444" data-path="images/kb/ka05w0000012BO6-00N5w00000Ri7BU-0EM5w000006w9HJ.jpg" />
</Frame>

***

# Correlation Matrix

A correlation matrix is a table showing correlation coefficients between sets of variables. Each random variable (Xi) in the table is correlated with each of the other values in the table. This allows you to see which pairs have the highest correlation.

The diagonal of the matrix is always a set of ones because the correlation between a variable and itself is always 1. You can fill in the upper-right triangle, but these values are a repeat of the lower-left triangle. In other words, a correlation matrix is also a symmetric matrix.

One example of a correlation matrix is the relationship between a student’s exam score and several other variables. Sample variables could include “hours of study”, “IQ score” and “hours of sleeping”.

Here is an example table with these variables:

<Frame>
  <img alt="correlation table.jpg" src="https://mintcdn.com/domoinc-openapi-sync-dataflows/OgxhwqPV4Aq-rsgt/images/kb/ka05w0000012BO6-00N5w00000Ri7BU-0EM5w000006w8yb.jpg?fit=max&auto=format&n=OgxhwqPV4Aq-rsgt&q=85&s=da46c8d6fb10d0d553ff3814dbb51c9e" style={{width: 850.98, height: 195}} width="3378" height="774" data-path="images/kb/ka05w0000012BO6-00N5w00000Ri7BU-0EM5w000006w8yb.jpg" />
</Frame>

In this format, this data is hard to analyze for correlation. Using a correlation matrix chart does much of the work for you.

Here is a correlation matrix with the identity diagonal and the top half of the chart (duplicate data) removed.

<Frame>
  <img alt="example matrix.jpg" src="https://mintcdn.com/domoinc-openapi-sync-dataflows/OgxhwqPV4Aq-rsgt/images/kb/ka05w0000012BO6-00N5w00000Ri7BU-0EM5w000006w8xo.jpg?fit=max&auto=format&n=OgxhwqPV4Aq-rsgt&q=85&s=8d270c54aeef655c8a09cf2fe42e0c5b" style={{width: 695.987, height: 323.999}} width="3378" height="1570" data-path="images/kb/ka05w0000012BO6-00N5w00000Ri7BU-0EM5w000006w8xo.jpg" />
</Frame>

The correlation matrix chart helps you see positive and negative correlations, and which relationships have higher and lower correlation, more easily.

# Power a Correlation Matrix

A correlation matrix requires at least two numeric columns to populate the x and y axes. You cannot use text columns in a correlation matrix. You should choose columns that allow you to see correlation between your data.

In Analyzer, you can choose the columns containing the data for your correlation matrix. For more information about choosing data columns, see [Applying DataSet Columns to Your Chart](https://domo-support.domo.com/s/article/360043428713?language=en_US).

In the example below, overall Sales data is being compared and correlated using cost, profit, and sales data. You can see how each of the three inputs correlates to one another using the scale key below the chart.

<Frame>
  <img alt="example correlation matrix.jpg" src="https://mintcdn.com/domoinc-openapi-sync-dataflows/OgxhwqPV4Aq-rsgt/images/kb/ka05w0000012BO6-00N5w00000Ri7BU-0EM5w000006w785.jpg?fit=max&auto=format&n=OgxhwqPV4Aq-rsgt&q=85&s=0ca32621ed3f64aad82f8258c7b6ad12" style={{width: 793.999, height: 382.997}} width="1600" height="772" data-path="images/kb/ka05w0000012BO6-00N5w00000Ri7BU-0EM5w000006w785.jpg" />
</Frame>

# Customize a Correlation Matrix

You can customize the appearance of a correlation matrix by editing its chart properties. For information about all available chart properties, see [Chart Properties](https://domo-support.domo.com/s/article/360042925374?language=en_US).

Unique properties of a correlation matrix include the following:

<table border="1" cellpadding="1" cellspacing="1" data-aura-rendered-by="33:205;a"><thead><tr><th colspan="0.5" rowspan="1"><p> Property </p></th><th colspan="0.5" rowspan="1"><p> Description </p></th><th colspan="2" rowspan="1"><p> Example </p></th></tr></thead><tbody><tr><td colspan="0.5" rowspan="1"><p> General > Positive Color </p></td><td colspan="0.5" rowspan="1"><p> The color displayed <br /> for positive values </p></td><td colspan="2" rowspan="1"><p><img src="https://mintcdn.com/domoinc-openapi-sync-dataflows/OgxhwqPV4Aq-rsgt/images/kb/ka05w0000012BO6-00N5w00000Ri7BU-0EM5w000006w7Cp.png?fit=max&auto=format&n=OgxhwqPV4Aq-rsgt&q=85&s=a46c72e7468d0529cea39da57bcb9dbc" style={{width: 390.994, height: 93.9915}} width="1600" height="361" data-path="images/kb/ka05w0000012BO6-00N5w00000Ri7BU-0EM5w000006w7Cp.png" /></p></td></tr><tr><td colspan="0.5" rowspan="1"><p> General > Zero Color </p></td><td colspan="0.5" rowspan="1"><p> The color displayed <br /> for ‘zero’ values </p></td><td colspan="2" rowspan="1"><p /><p><img alt="image" src="https://mintcdn.com/domoinc-openapi-sync-dataflows/OgxhwqPV4Aq-rsgt/images/kb/ka05w0000012BO6-00N5w00000Ri7BU-0EM5w000006w7Dw.jpg?fit=max&auto=format&n=OgxhwqPV4Aq-rsgt&q=85&s=26cfd66e75080f7825ecfe352ba68fea" style={{width: 390, height: 67.9901}} width="1600" height="271" data-path="images/kb/ka05w0000012BO6-00N5w00000Ri7BU-0EM5w000006w7Dw.jpg" /></p></td></tr><tr><td colspan="0.5" rowspan="1"><p> General > Negative Color </p></td><td colspan="0.5" rowspan="1"><p> The color displayed <br /> for negative values </p></td><td colspan="2" rowspan="1"><p /><p><img src="https://mintcdn.com/domoinc-openapi-sync-dataflows/OgxhwqPV4Aq-rsgt/images/kb/ka05w0000012BO6-00N5w00000Ri7BU-0EM5w000006w7E1.png?fit=max&auto=format&n=OgxhwqPV4Aq-rsgt&q=85&s=3c93826448ca15f6ea02151b61702428" style={{width: 390, height: 161.989}} width="1004" height="428" data-path="images/kb/ka05w0000012BO6-00N5w00000Ri7BU-0EM5w000006w7E1.png" /></p></td></tr><tr><td colspan="0.5" rowspan="1"><p> General > Cell Border Color </p></td><td colspan="0.5" rowspan="1"><p> The color of the cell borders. </p></td><td colspan="2" rowspan="1"><p /><p /><p><img src="https://mintcdn.com/domoinc-openapi-sync-dataflows/OgxhwqPV4Aq-rsgt/images/kb/ka05w0000012BO6-00N5w00000Ri7BU-0EM5w000006w7E2.png?fit=max&auto=format&n=OgxhwqPV4Aq-rsgt&q=85&s=0a78f98127d1301cdec89ebbedc126ce" style={{width: 388.999, height: 138.977}} width="904" height="338" data-path="images/kb/ka05w0000012BO6-00N5w00000Ri7BU-0EM5w000006w7E2.png" /></p><p /></td></tr><tr><td colspan="0.5" rowspan="1"> General > Show Half Grid </td><td colspan="0.5" rowspan="1"> Displays the matrix <br /> as only a half-grid </td><td colspan="2" rowspan="1"><img alt="show half grid.png" src="https://mintcdn.com/domoinc-openapi-sync-dataflows/OgxhwqPV4Aq-rsgt/images/kb/ka05w0000012BO6-00N5w00000Ri7BU-0EM5w000006wAD8.jpg?fit=max&auto=format&n=OgxhwqPV4Aq-rsgt&q=85&s=434adaecfd3853c356ad45fc87d8e7a1" style={{width: 439.993, height: 76.9957}} width="936" height="164" data-path="images/kb/ka05w0000012BO6-00N5w00000Ri7BU-0EM5w000006wAD8.jpg" /></td></tr><tr><td colspan="0.5" rowspan="1"> General > Half Grid Position </td><td colspan="0.5" rowspan="1"> If a half-grid is selected, <br /> this property changes its positioning. </td><td colspan="2" rowspan="1"><br /><img src="https://mintcdn.com/domoinc-openapi-sync-dataflows/OgxhwqPV4Aq-rsgt/images/kb/ka05w0000012BO6-00N5w00000Ri7BU-0EM5w000006w7EL.png?fit=max&auto=format&n=OgxhwqPV4Aq-rsgt&q=85&s=a39e35843b19119bc554214cf1920b7d" style={{width: 352.969, height: 146.989}} width="782" height="340" data-path="images/kb/ka05w0000012BO6-00N5w00000Ri7BU-0EM5w000006w7EL.png" /></td></tr><tr><td colspan="0.5" rowspan="1"> General > Exclude Identity </td><td colspan="0.5" rowspan="1"> Removes identity data <br /> from the matrix. </td><td colspan="2" rowspan="1"><img alt="exclude identity.png" src="https://mintcdn.com/domoinc-openapi-sync-dataflows/OgxhwqPV4Aq-rsgt/images/kb/ka05w0000012BO6-00N5w00000Ri7BU-0EM5w000006wADI.jpg?fit=max&auto=format&n=OgxhwqPV4Aq-rsgt&q=85&s=248007669bd9cd770dc05120848817a9" style={{width: 390, height: 161.989}} width="756" height="306" data-path="images/kb/ka05w0000012BO6-00N5w00000Ri7BU-0EM5w000006wADI.jpg" /></td></tr></tbody></table>

# Power a Confusion Matrix

A confusion matrix requires the following:

* A ‘Predicted Value’ measure or dimension — the predicted value defaults to the y-axis
* An ‘Actual Value’ measure or dimension — the actual value defaults to the x-axis

A confusion matrix chart uses 1/0, yes/no, or true/false value input types.

In Analyzer, you can choose the columns containing the data for your confusion matrix. For more information about choosing data columns, see our article about [Applying DataSet Columns to Your Chart](https://domo-support.domo.com/s/article/360043428713?language=en_US).

In the example below, Employee Retention data is being used to show how the predicted value of employees being left out of projects correlates to the actual number of employees who leave a company.

<Frame>
  <img src="https://mintcdn.com/domoinc-openapi-sync-dataflows/OgxhwqPV4Aq-rsgt/images/kb/ka05w0000012BO6-00N5w00000Ri7BU-0EM5w000006w7H0.png?fit=max&auto=format&n=OgxhwqPV4Aq-rsgt&q=85&s=50177cbe29aec7f231ba2e6693bdcc91" style={{width: 703.991, height: 340}} width="1600" height="773" data-path="images/kb/ka05w0000012BO6-00N5w00000Ri7BU-0EM5w000006w7H0.png" />
</Frame>

# Customize a Confusion Matrix

You can customize the appearance of a confusion matrix by editing its chart properties. For information about all available chart properties, see [Chart Properties](https://domo-support.domo.com/s/article/360042925374?language=en_US).

Unique properties of a confusion matrix include the following:

<table border="1" cellpadding="1" cellspacing="1" data-aura-rendered-by="33:205;a"><thead><tr><th colspan="0.5" rowspan="1"><p> Property </p></th><th colspan="0.5" rowspan="1"><p> Description </p></th><th colspan="2" rowspan="1"><p> Example </p></th></tr></thead><tbody><tr><td colspan="0.5" rowspan="1"><p> General > Actual Position </p></td><td colspan="0.5" rowspan="1"><p> Determines the position of the ‘Actual’ values and label </p></td><td colspan="2" rowspan="1"><p><img src="https://mintcdn.com/domoinc-openapi-sync-dataflows/OgxhwqPV4Aq-rsgt/images/kb/ka05w0000012BO6-00N5w00000Ri7BU-0EM5w000006w7Jp.png?fit=max&auto=format&n=OgxhwqPV4Aq-rsgt&q=85&s=1661283bca975c516016960b3d3701d2" style={{width: 300, height: 102.99}} width="974" height="334" data-path="images/kb/ka05w0000012BO6-00N5w00000Ri7BU-0EM5w000006w7Jp.png" /></p></td></tr><tr><td colspan="0.5" rowspan="1"><p> General > Actual Predicted Color </p></td><td colspan="0.5" rowspan="1"><p> The fill color for the Actual and Predicted text sections </p></td><td colspan="2" rowspan="1"><p><img src="https://mintcdn.com/domoinc-openapi-sync-dataflows/OgxhwqPV4Aq-rsgt/images/kb/ka05w0000012BO6-00N5w00000Ri7BU-0EM5w000006w7Jq.png?fit=max&auto=format&n=OgxhwqPV4Aq-rsgt&q=85&s=dbdecb5343fb4a0628b7da8c0aa8da4c" style={{width: 320.994, height: 107.99}} width="1600" height="592" data-path="images/kb/ka05w0000012BO6-00N5w00000Ri7BU-0EM5w000006w7Jq.png" /></p></td></tr><tr><td colspan="0.5" rowspan="1"><p> General > Positive Label </p></td><td colspan="0.5" rowspan="1"><p> The text to be used for the positive column label </p></td><td colspan="2" rowspan="1"><p><img alt="positive label.jpg" src="https://mintcdn.com/domoinc-openapi-sync-dataflows/OgxhwqPV4Aq-rsgt/images/kb/ka05w0000012BO6-00N5w00000Ri7BU-0EM5w000006wADS.jpg?fit=max&auto=format&n=OgxhwqPV4Aq-rsgt&q=85&s=f2ecf0e21acf4fdab962f1604303cb3e" style={{width: 288.999, height: 223.999}} width="518" height="402" data-path="images/kb/ka05w0000012BO6-00N5w00000Ri7BU-0EM5w000006wADS.jpg" /></p></td></tr><tr><td colspan="0.5" rowspan="1"><p> General > Negative Label </p></td><td colspan="0.5" rowspan="1"><p> The text to be used for the negative column label </p></td><td colspan="2" rowspan="1"><p><img alt="negative label.jpg" src="https://mintcdn.com/domoinc-openapi-sync-dataflows/OgxhwqPV4Aq-rsgt/images/kb/ka05w0000012BO6-00N5w00000Ri7BU-0EM5w000006wADX.jpg?fit=max&auto=format&n=OgxhwqPV4Aq-rsgt&q=85&s=6633083e3ca2c4cde8bd66af20b6f165" style={{width: 288.999, height: 223.991}} width="518" height="402" data-path="images/kb/ka05w0000012BO6-00N5w00000Ri7BU-0EM5w000006wADX.jpg" /></p></td></tr><tr><td colspan="0.5" rowspan="1"> General > Positive Position </td><td colspan="0.5" rowspan="1"> Determines whether the positive column/row will be shown first or last </td><td colspan="2" rowspan="1"><div><img src="https://mintcdn.com/domoinc-openapi-sync-dataflows/OgxhwqPV4Aq-rsgt/images/kb/ka05w0000012BO6-00N5w00000Ri7BU-0EM5w000006w7Jr.png?fit=max&auto=format&n=OgxhwqPV4Aq-rsgt&q=85&s=3bd2b4393e543a02273ca1f8cadb049d" style={{width: 320.987, height: 107.99}} width="954" height="306" data-path="images/kb/ka05w0000012BO6-00N5w00000Ri7BU-0EM5w000006w7Jr.png" /></div></td></tr><tr><td colspan="0.5" rowspan="1"> General > Positive Negative Color </td><td colspan="0.5" rowspan="1"> The fill color for the Positive and Negative text sections <br /></td><td colspan="2" rowspan="1"><br /><img src="https://mintcdn.com/domoinc-openapi-sync-dataflows/OgxhwqPV4Aq-rsgt/images/kb/ka05w0000012BO6-00N5w00000Ri7BU-0EM5w000006w7Js.png?fit=max&auto=format&n=OgxhwqPV4Aq-rsgt&q=85&s=ebf263257e884c2541273e9c8ae00858" style={{width: 371.982, height: 60}} width="1600" height="259" data-path="images/kb/ka05w0000012BO6-00N5w00000Ri7BU-0EM5w000006w7Js.png" /><br /></td></tr><tr><td colspan="0.5" rowspan="1"> General > Value Label </td><td colspan="0.5" rowspan="1"> The text used for the value label </td><td colspan="2" rowspan="1"><div><img src="https://mintcdn.com/domoinc-openapi-sync-dataflows/OgxhwqPV4Aq-rsgt/images/kb/ka05w0000012BO6-00N5w00000Ri7BU-0EM5w000006w7Jt.png?fit=max&auto=format&n=OgxhwqPV4Aq-rsgt&q=85&s=9090d5fe9452871bd5df5aee0e022021" style={{width: 256.996, height: 71.9957}} width="1600" height="447" data-path="images/kb/ka05w0000012BO6-00N5w00000Ri7BU-0EM5w000006w7Jt.png" /> — </div></td></tr><tr><td colspan="0.5" rowspan="1"> General > True Positive Color </td><td colspan="0.5" rowspan="1"> Fill color for the True Positive quadrant </td><td colspan="2" rowspan="1"><div><img src="https://mintcdn.com/domoinc-openapi-sync-dataflows/OgxhwqPV4Aq-rsgt/images/kb/ka05w0000012BO6-00N5w00000Ri7BU-0EM5w000006w7Ju.png?fit=max&auto=format&n=OgxhwqPV4Aq-rsgt&q=85&s=21318b5324f662cc22965bffa029caf9" style={{width: 264.993, height: 80.9943}} width="1422" height="436" data-path="images/kb/ka05w0000012BO6-00N5w00000Ri7BU-0EM5w000006w7Ju.png" /></div></td></tr><tr><td colspan="0.5" rowspan="1"> General > True Negative Color </td><td colspan="0.5" rowspan="1"> Fill color for the True Negative quadrant </td><td colspan="2" rowspan="1"><div><img src="https://mintcdn.com/domoinc-openapi-sync-dataflows/OgxhwqPV4Aq-rsgt/images/kb/ka05w0000012BO6-00N5w00000Ri7BU-0EM5w000006w7KA.png?fit=max&auto=format&n=OgxhwqPV4Aq-rsgt&q=85&s=5a268d015344737dace25a200a0e0c06" style={{width: 352.983, height: 116.996}} width="1600" height="541" data-path="images/kb/ka05w0000012BO6-00N5w00000Ri7BU-0EM5w000006w7KA.png" /></div></td></tr><tr><td colspan="0.5" rowspan="1"> General > False Positive Color </td><td colspan="0.5" rowspan="1"> Fill color for the False Positive quadrant </td><td colspan="2" rowspan="1"><div><img src="https://mintcdn.com/domoinc-openapi-sync-dataflows/OgxhwqPV4Aq-rsgt/images/kb/ka05w0000012BO6-00N5w00000Ri7BU-0EM5w000006w7KB.png?fit=max&auto=format&n=OgxhwqPV4Aq-rsgt&q=85&s=d2d9860a22cb22c85409c36dc265db7f" style={{width: 296.996, height: 70.9872}} width="1600" height="384" data-path="images/kb/ka05w0000012BO6-00N5w00000Ri7BU-0EM5w000006w7KB.png" /></div></td></tr><tr><td colspan="0.5" rowspan="1"> General > False Negative Color </td><td colspan="0.5" rowspan="1"> Fill color for the False Negative quadrant </td><td colspan="2" rowspan="1"><div><img src="https://mintcdn.com/domoinc-openapi-sync-dataflows/OgxhwqPV4Aq-rsgt/images/kb/ka05w0000012BO6-00N5w00000Ri7BU-0EM5w000006w7KD.png?fit=max&auto=format&n=OgxhwqPV4Aq-rsgt&q=85&s=1f9f95a9a8abe9516822536412a0efd3" style={{width: 314.986, height: 87.9972}} width="1538" height="436" data-path="images/kb/ka05w0000012BO6-00N5w00000Ri7BU-0EM5w000006w7KD.png" /></div></td></tr><tr><td colspan="0.5" rowspan="1"> General > Border Width </td><td colspan="0.5" rowspan="1"> Width of the border around each section </td><td colspan="2" rowspan="1"><img alt="confusion border width.jpg" src="https://mintcdn.com/domoinc-openapi-sync-dataflows/OgxhwqPV4Aq-rsgt/images/kb/ka05w0000012BO6-00N5w00000Ri7BU-0EM5w000006w9Gf.jpg?fit=max&auto=format&n=OgxhwqPV4Aq-rsgt&q=85&s=6acd4fdbc8ae4f69e7c0b6c5d86a0ffd" style={{width: 355.994, height: 206.989}} width="2526" height="1470" data-path="images/kb/ka05w0000012BO6-00N5w00000Ri7BU-0EM5w000006w9Gf.jpg" /></td></tr><tr><td colspan="0.5" rowspan="1"> General > Border Color </td><td colspan="0.5" rowspan="1"> The color for the border drawn around each section </td><td colspan="2" rowspan="1"><div><img src="https://mintcdn.com/domoinc-openapi-sync-dataflows/OgxhwqPV4Aq-rsgt/images/kb/ka05w0000012BO6-00N5w00000Ri7BU-0EM5w000006w7KE.png?fit=max&auto=format&n=OgxhwqPV4Aq-rsgt&q=85&s=8753478fcad1dad285374ee89a9bca15" style={{width: 332.99, height: 101.996}} width="1600" height="487" data-path="images/kb/ka05w0000012BO6-00N5w00000Ri7BU-0EM5w000006w7KE.png" /></div></td></tr></tbody></table>

# FAQ

**What specific equation is being used to calculate the correlation coefficients?**

Pearson correlation coefficients are calculated.