> ## Documentation Index
> Fetch the complete documentation index at: https://domoinc-openapi-sync-dataflows.mintlify.site/llms.txt
> Use this file to discover all available pages before exploring further.
# Mapbox World Map
### Intro
***
This tutorial walks through building a React + TypeScript app that renders a world map with [Mapbox GL JS](https://docs.mapbox.com/mapbox-gl-js/guides/), powered by a Domo dataset. You'll learn how to:
* Scaffold a Vite + React + TypeScript project with the [DA CLI](/portal/Apps/App-Framework/Tools/da-cli)
* Upload a CSV to Domo and wire it to your app through `manifest.json` mapping
* Publish an initial design, create a proxy card, and link it to your local dev server
* Fetch mapped data with `ryuu.js` and render it as a GeoJSON circle layer in Mapbox
* Use a custom Mapbox style and scale point radius / color by a numeric field
The finished code is at [DomoApps/mapbox-tutorial on GitHub](https://github.com/DomoApps/mapbox-tutorial).
**Prerequisite:** Complete the [Setup and Installation](/portal/Apps/App-Framework/Quickstart/Setup-and-Installation) guide and run `domo login` before starting.
### Step 1: Install the DA CLI and scaffold the app
***
The [DA CLI](/portal/Apps/App-Framework/Tools/da-cli) clones the [@domoinc/vite-react-template](https://www.npmjs.com/package/@domoinc/vite-react-template) — a Vite + React + TypeScript project preconfigured with the Domo proxy, ESLint, Prettier, Vitest, Storybook, and `da generate` scaffolding.
Install the CLI globally:
```bash theme={"dark"}
# pnpm (recommended)
pnpm add -g @domoinc/da
# or yarn
yarn global add @domoinc/da
# or npm
npm install -g @domoinc/da
```
Create the project:
```bash theme={"dark"}
da new mapbox-tutorial
cd mapbox-tutorial
```
`da new` prompts for a package manager (pick **pnpm**), clones the template, writes your app name, initializes git, and installs dependencies.
App names must be lowercase with hyphens only. Capitals, underscores, and periods are rejected.
Add the Mapbox runtime, the Domo JS client, and TypeScript types:
```bash theme={"dark"}
pnpm add mapbox-gl ryuu.js
pnpm add -D @types/mapbox-gl @types/geojson
```
### Step 2: Get a Mapbox access token
***
If you don't already have a Mapbox account, create one for free at [account.mapbox.com/auth/signup](https://account.mapbox.com/auth/signup/). Your default public access token is on the account home screen. Copy it — you'll paste it into the Map component in Step 6.
See Mapbox's guide on [access tokens](https://docs.mapbox.com/help/getting-started/access-tokens/) for details on scoping and restricting tokens for production use.
### Step 3: Upload a dataset to Domo
***
We need a dataset for the map to point at. Download [World\_Cities.csv](https://github.com/DomoApps/mapbox-tutorial/blob/main/data/World_Cities.csv) from the sample repo (\~47k rows with `city`, `country`, `lat`, `lng`, `population`).
In your Domo instance: **Data** → **CONNECT DATA** → **Upload a spreadsheet**, drag the CSV in, and save the dataset with defaults.
Once it's uploaded, open the dataset and copy its **dataset ID** from the URL (the UUID after `/datasources/`). You'll use it in the next step.
### Step 4: Declare the dataset mapping
***
Dataset mappings tell Domo which dataset to supply to your app at runtime. The `alias` (`geoData` here) becomes the URL path your app queries; `fields` rename columns so your app code doesn't care what the source column is called.
Replace `public/manifest.json` with:
```json theme={"dark"}
{
"name": "World Map App",
"version": "0.0.1",
"size": { "width": 3, "height": 3 },
"fullpage": true,
"mapping": [
{
"alias": "geoData",
"dataSetId": "YOUR_DATASET_ID",
"fields": [
{ "alias": "id", "columnName": "id" },
{ "alias": "city", "columnName": "city" },
{ "alias": "country", "columnName": "country" },
{ "alias": "lat", "columnName": "lat" },
{ "alias": "long", "columnName": "lng" },
{ "alias": "dataPoint", "columnName": "population" }
]
}
]
}
```
Replace `YOUR_DATASET_ID` with the UUID from Step 3. Note that `long` is aliased from the source column `lng` — this is the power of aliases: your app code uses whatever shape is convenient.
### Step 5: Publish the initial design and wire the proxy
***
Before local dev can query mapped data, Domo needs to know the app exists and be told which dataset to hand over to it.
```bash theme={"dark"}
pnpm upload
```
This runs `pnpm build` and `domo publish` from the `build/` folder. The output prints a link to the new App Design.
Then, in the Domo UI:
1. Open the App Design link — or go to **More** → **Asset Library** and find your design.
2. Click **New Card**. A new card is what Domo uses to route dataset requests from your local dev server.
3. When prompted, select the dataset you uploaded in Step 3.
4. Save the card.
Copy two values from the App Design page:
* `id` — the design ID
* `proxyId` — the card ID your local dev server will proxy through
Add both to `public/manifest.json`:
```json theme={"dark"}
{
"id": "922c41e1-20c0-4c96-93b5-4bf398cb392c",
"proxyId": "YOUR_PROXY_ID"
}
```
For multi-environment apps (dev/qa/prod), keep `manifest.json` clean and use `da manifest` to add overrides to `src/manifestOverrides.json`. `da apply-manifest` runs automatically as a `prestart` / `prebuild` hook.
### Step 6: Build the Map component
***
Create `src/components/Map/Map.module.scss`:
```scss theme={"dark"}
.mapContainer {
height: 100vh;
width: 100vw;
}
```
Create `src/components/Map/Map.tsx`. This does four things: fetch the mapped dataset through `ryuu.js`, transform rows into display-ready points (radius + color scaled by population), initialize the Mapbox map, and add a GeoJSON circle layer on `load`.
```tsx theme={"dark"}
import 'mapbox-gl/dist/mapbox-gl.css';
import mapboxgl from 'mapbox-gl';
import { FC, useEffect, useRef, useState } from 'react';
import domo from 'ryuu.js';
import styles from './Map.module.scss';
const POPULATION_LIMIT = 50_000;
const POINT_STEP = 100_000;
const COLORS = ['#8F1CCD', '#A221B9', '#E0329D', '#DF7B90', '#E8AD85'];
interface GeoRow {
city: string;
lat: number;
long: number;
dataPoint: number;
}
interface Point {
name: string;
latitude: number;
longitude: number;
radius: number;
color: string;
}
const getPointRadius = (row: GeoRow): number => {
const step = Math.min(
Math.floor((row.dataPoint - POPULATION_LIMIT) / POINT_STEP),
3,
);
return 1 + step * 0.2;
};
const getPointColor = (row: GeoRow): string => {
const step = Math.min(
Math.floor((row.dataPoint - POPULATION_LIMIT) / POINT_STEP),
4,
);
return COLORS[step];
};
export const Map: FC = () => {
const mapRef = useRef(null);
const mapContainerRef = useRef(null);
const [points, setPoints] = useState([]);
useEffect(() => {
const fetchData = async () => {
const response = (await domo.get(
'/data/v1/geoData',
)) as unknown as GeoRow[];
setPoints(
response.map((row) => ({
name: row.city,
latitude: row.lat,
longitude: row.long,
radius: getPointRadius(row),
color: getPointColor(row),
})),
);
};
fetchData();
}, []);
useEffect(() => {
if (points.length === 0 || !mapContainerRef.current) return;
mapboxgl.accessToken = 'YOUR_MAPBOX_ACCESS_TOKEN';
mapRef.current = new mapboxgl.Map({
container: mapContainerRef.current,
style: 'mapbox://styles/mapbox/light-v11',
maxBounds: [
[-230, -60],
[230, 70],
],
});
mapRef.current.on('load', () => {
const dataPoints: GeoJSON.FeatureCollection = {
type: 'FeatureCollection',
features: points.map((point) => ({
type: 'Feature',
geometry: {
type: 'Point',
coordinates: [point.longitude, point.latitude],
},
properties: {
name: point.name,
radius: point.radius,
color: point.color,
},
})),
};
mapRef.current?.addSource('dataPoints', {
type: 'geojson',
data: dataPoints,
});
mapRef.current?.addLayer({
id: 'circle-layer',
type: 'circle',
source: 'dataPoints',
paint: {
'circle-radius': ['get', 'radius'],
'circle-color': ['get', 'color'],
'circle-opacity': 0.7,
},
});
});
return () => {
mapRef.current?.remove();
};
}, [points]);
return ;
};
```
A few things worth calling out:
* **`domo.get('/data/v1/geoData')`** is the `ryuu.js` helper that queries whatever dataset the app's `proxyId` is wired to. The path suffix (`geoData`) matches the `alias` you set in `manifest.json`.
* **Two `useEffect`s** — one fetches data once, the second initializes the map when points arrive. Splitting them means the map isn't rebuilt every render.
* **GeoJSON + a circle layer** is Mapbox's idiomatic way to render thousands of points efficiently; the `['get', 'radius']` / `['get', 'color']` expressions read per-feature properties without needing a separate layer per color.
* **`maxBounds`** clips the map so users can't pan endlessly into empty ocean or Antarctica.
Replace `YOUR_MAPBOX_ACCESS_TOKEN` with the token you copied in Step 2.
### Step 7: Use a custom Mapbox style (optional)
***
The code above uses one of Mapbox's built-in styles (`mapbox://styles/mapbox/light-v11`). If you want a fully custom look, export a style as JSON from [Mapbox Studio](https://studio.mapbox.com/) and drop it next to the component as `map-style.json`, then swap the `style` option:
```tsx theme={"dark"}
import rawMapStyle from './map-style.json';
// ...in the map init:
style: rawMapStyle as unknown as mapboxgl.StyleSpecification,
```
The sample repo ships a monochrome dark style (`src/components/Map/map-style.json`) you can use as a starting point.
### Step 8: Wire up `App.tsx` and `main.tsx`
***
`src/components/App/App.tsx` just renders the map:
```tsx theme={"dark"}
import { Map } from 'components/Map/Map';
import { FC } from 'react';
export const App: FC = () => ;
```
The scaffold's `src/main.tsx` already renders `` inside `` — no change needed unless you want to strip Redux (not required for this app, but harmless to leave in place for future work).
Your final `src/` tree:
```text theme={"dark"}
src/
├── main.tsx
├── index.scss
└── components/
├── App/
│ └── App.tsx
└── Map/
├── Map.tsx
├── Map.module.scss
└── map-style.json (optional — custom style)
```
### Step 9: Test locally
***
```bash theme={"dark"}
pnpm start
```
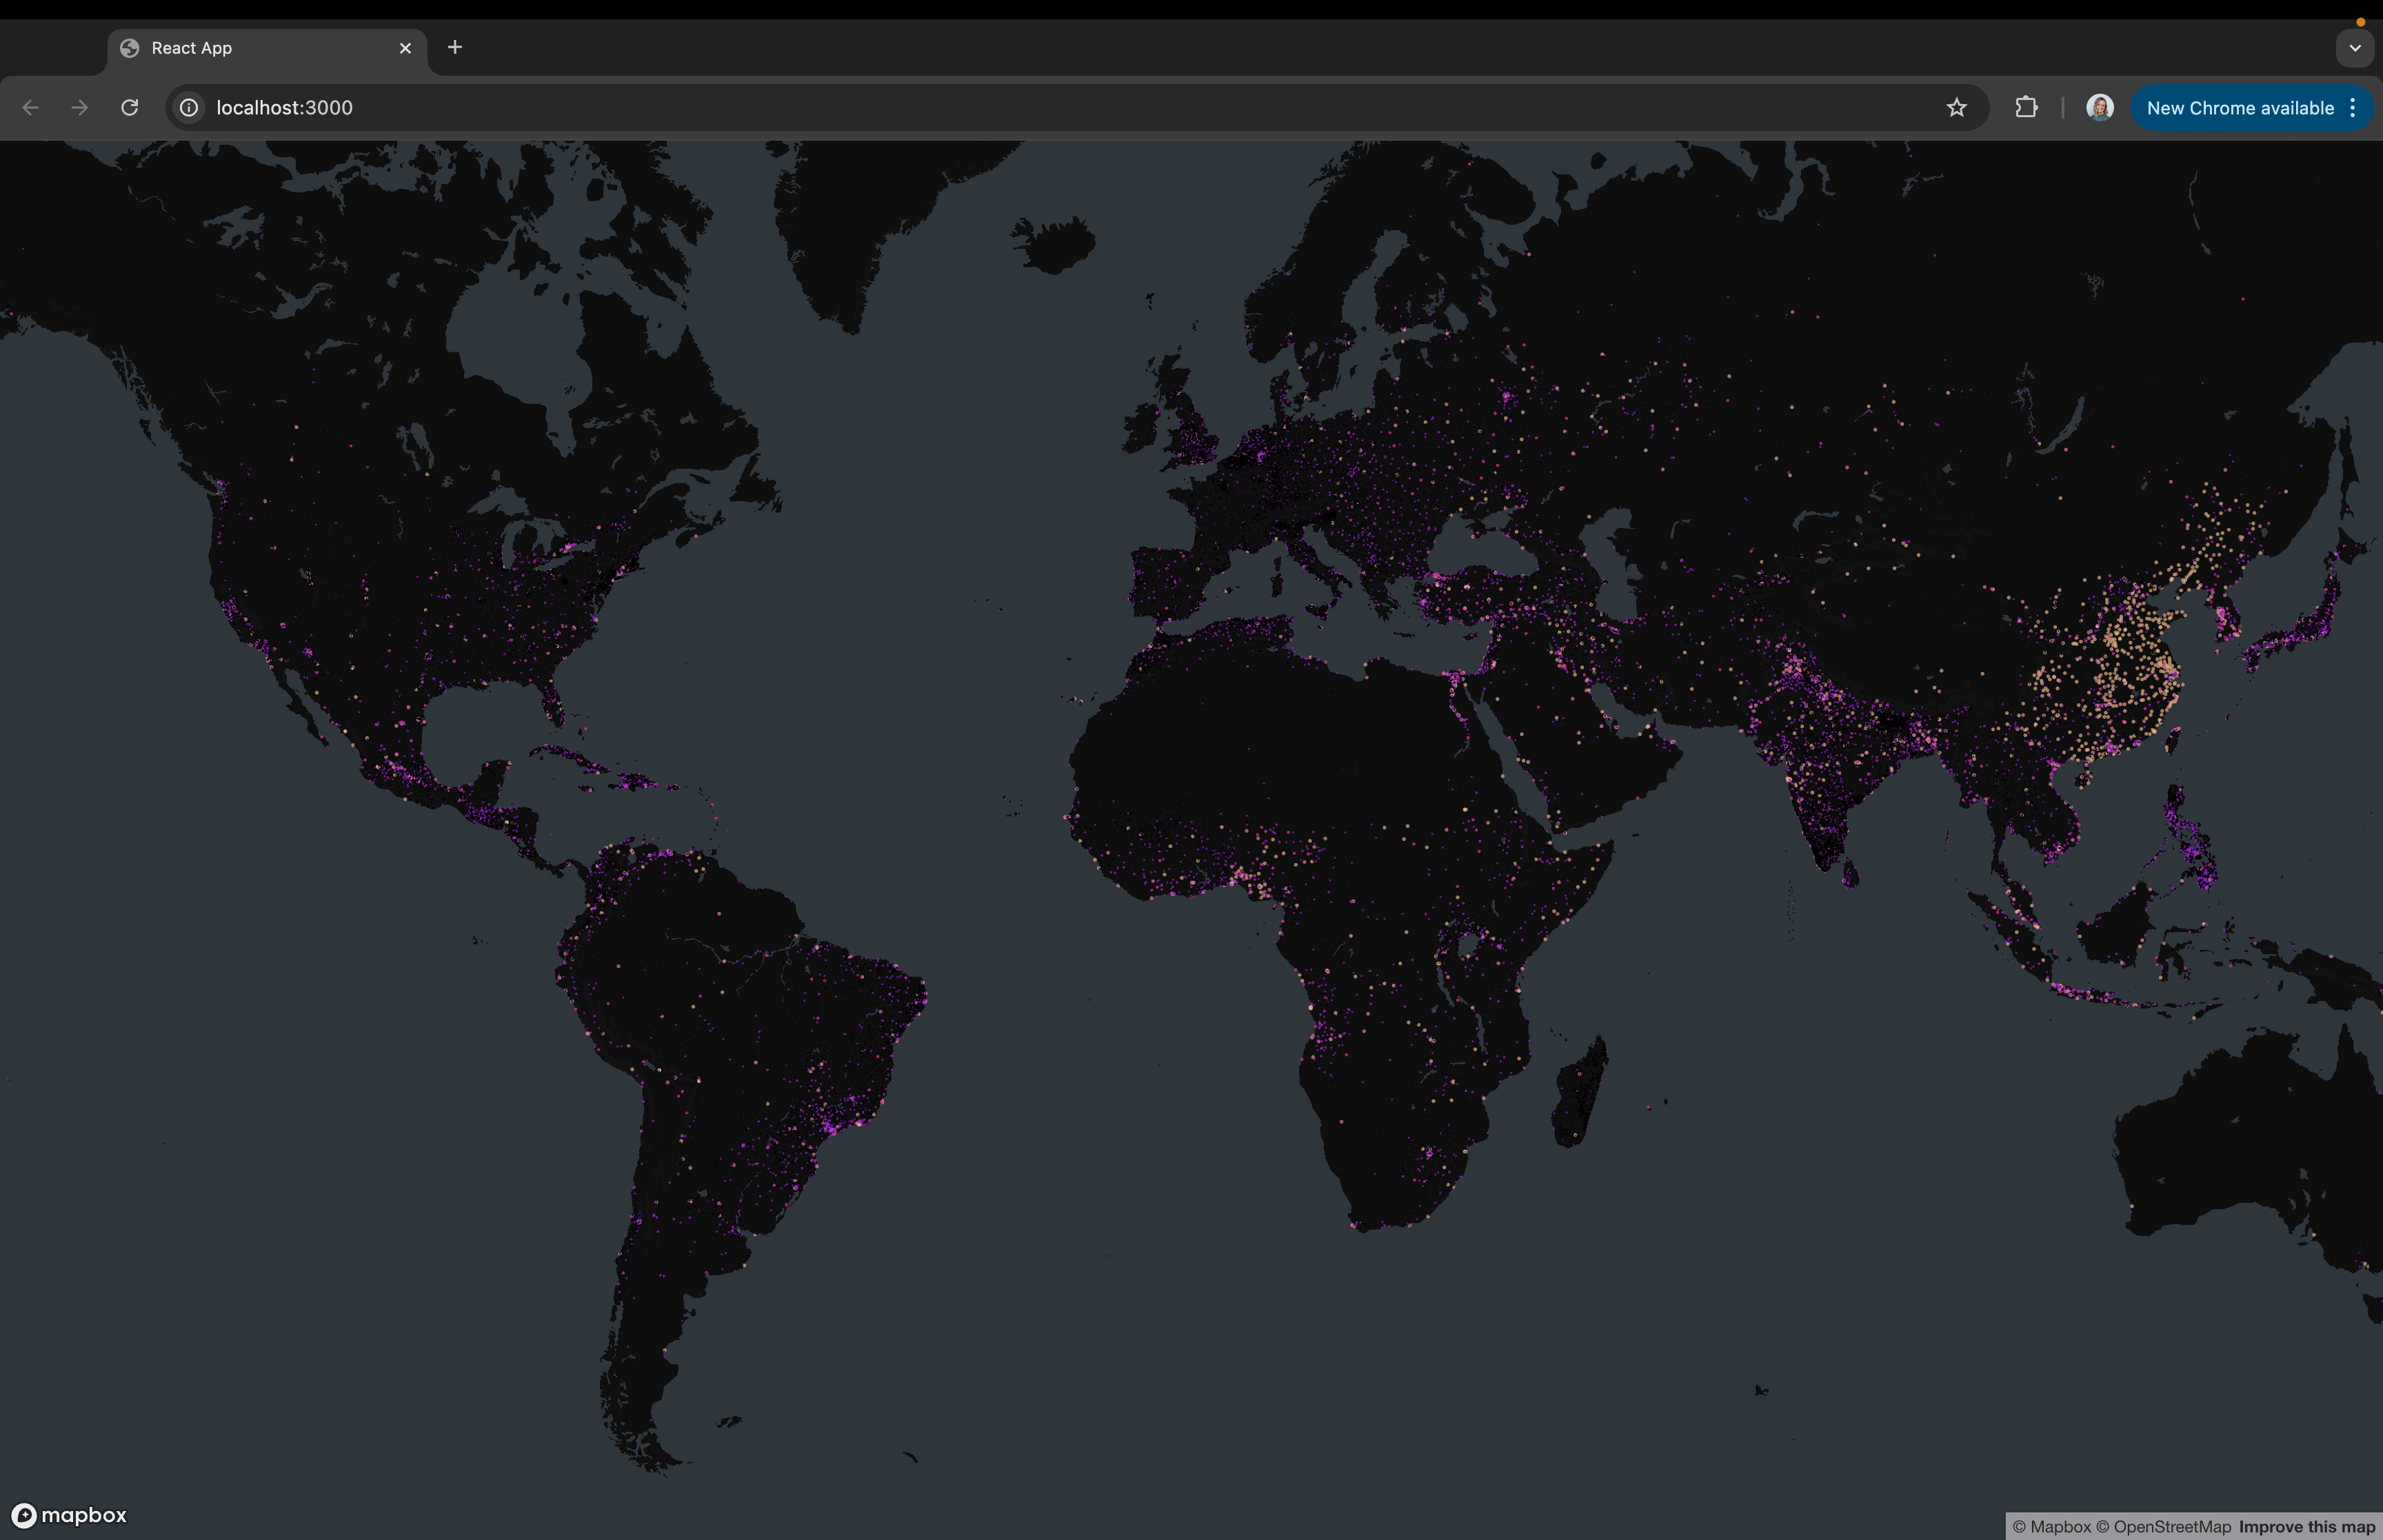
The Vite dev server starts on port 3000 (or 3001/3002 if busy). Because `proxyId` is set, `domo.get('/data/v1/geoData')` hits your real mapped dataset. You should see thousands of circles scattered across the world, sized and colored by city population.
 **Warning:** If the map stays blank, check the browser console. A 401 from Mapbox means the access token is wrong or missing; a 404 from `/data/v1/geoData` means `proxyId` in `manifest.json` isn't pointing at the card you created in Step 5.
### Step 10: Publish
***
When you're happy, publish the final version:
```bash theme={"dark"}
pnpm upload
```
The new build becomes the active design. Anyone instantiating the app from the Asset Library picks it up.
### Next steps
***
* Add hover popups with `mapboxgl.Popup` to show city names and populations on click.
* Swap `population` for any numeric column by changing the `dataPoint` alias in `manifest.json` — no code change required.
* Layer in a second mapping (e.g. country boundaries) by adding another entry under `mapping[]` and querying `/data/v1/`.
* Continue with [AI Book Recommender](/portal/Apps/App-Framework/Tutorials/React/AI-Book-Recommender) or [Todo App with AppDB](/portal/Apps/App-Framework/Tutorials/React/Todo-App).
**Warning:** If the map stays blank, check the browser console. A 401 from Mapbox means the access token is wrong or missing; a 404 from `/data/v1/geoData` means `proxyId` in `manifest.json` isn't pointing at the card you created in Step 5.
### Step 10: Publish
***
When you're happy, publish the final version:
```bash theme={"dark"}
pnpm upload
```
The new build becomes the active design. Anyone instantiating the app from the Asset Library picks it up.
### Next steps
***
* Add hover popups with `mapboxgl.Popup` to show city names and populations on click.
* Swap `population` for any numeric column by changing the `dataPoint` alias in `manifest.json` — no code change required.
* Layer in a second mapping (e.g. country boundaries) by adding another entry under `mapping[]` and querying `/data/v1/`.
* Continue with [AI Book Recommender](/portal/Apps/App-Framework/Tutorials/React/AI-Book-Recommender) or [Todo App with AppDB](/portal/Apps/App-Framework/Tutorials/React/Todo-App).