プロパティ
説明
例
[一般]>[バー間の間隔の割合]
バーチャートの間隔を指定します。
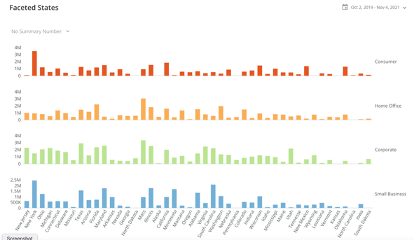
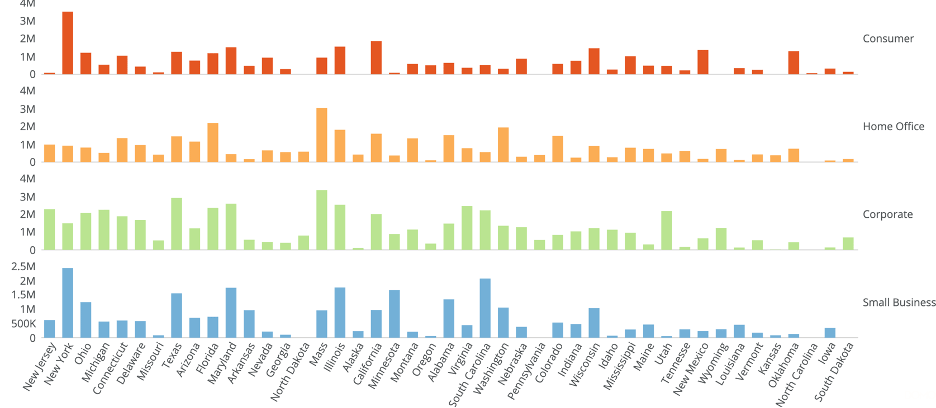 ## ファセットバーチャートの作成
ファセットバーチャートには、カテゴリー、値、系列が必要です。
値、カテゴリー、系列データの詳細については、「 [チャートデータについて](/s/article/360043428693) 」を参照してください。
Analyzerで、ファセットバーチャートのデータを含む列を選択します。データ列の選択の詳細については、「 [DataSetの列をチャートに適用する](/s/article/360043428713) 」を参照してください。
Analyzerでチャートをフォーマットする方法の詳細については、「 [可視化カード作成パート2:Analyzer](/s/topic/0TO5w000000ZaoUGAS) 」を参照してください。
## ファセットバーチャートのカスタマイズ
ファセットバーチャートの外観は、[ **チャートのプロパティ** を編集することでカスタマイズできます。すべてのチャートのプロパティについては、「 [チャートのプロパティ](/s/topic/0TO5w000000ZaodGAC "チャートのプロパティ") 」を参照してください。
ファセットバーチャート固有のプロパティを以下に示します。
## ファセットバーチャートの作成
ファセットバーチャートには、カテゴリー、値、系列が必要です。
値、カテゴリー、系列データの詳細については、「 [チャートデータについて](/s/article/360043428693) 」を参照してください。
Analyzerで、ファセットバーチャートのデータを含む列を選択します。データ列の選択の詳細については、「 [DataSetの列をチャートに適用する](/s/article/360043428713) 」を参照してください。
Analyzerでチャートをフォーマットする方法の詳細については、「 [可視化カード作成パート2:Analyzer](/s/topic/0TO5w000000ZaoUGAS) 」を参照してください。
## ファセットバーチャートのカスタマイズ
ファセットバーチャートの外観は、[ **チャートのプロパティ** を編集することでカスタマイズできます。すべてのチャートのプロパティについては、「 [チャートのプロパティ](/s/topic/0TO5w000000ZaodGAC "チャートのプロパティ") 」を参照してください。
ファセットバーチャート固有のプロパティを以下に示します。
プロパティ | 説明 | 例 |
|---|---|---|
[一般]>[バー間の間隔の割合] | バーチャートの間隔を指定します。 |
|